


 nueva página del texto (beta)
 Español (pdf)
 Artículo en XML
 Referencias del artículo
 Enviar artículo por email
 Citado por SciELO
  Similares en
SciELO
Similares en
SciELO 
 Permalink
1. Introduction
Globular clusters (GCs) are the oldest stellar systems in the Galaxy and their stellar populations are a good representation of the most evolved and metaldeficient stars. The population of variable stars in GCs is assorted but probably the most important variables are the RR Lyrae (RRL) as they are numerous and have been recognized as distance indicators since very early in the XX century when Shapley (1917) used them to estimate the distance to some GCs and proved that the Sun is not at the center of the Galaxy. It was from RRL in the Galactic bulge that Shapley (1939) and Baade (1946) estimated the distance to the Galactic center. The most complete compilation of variable stars in GCs is found in the Catalogue of Variable Stars in Galactic Globular Clusters described in detail by Clement et al. (2001) and which has been regularly updated for individual clusters under the curation of Prof. Christine Clement1.
A major problem in the search and monitoring of variables near the central regions of GCs is the overcrowding and overlapping of star images, which has for a long time severely hampered our ability to complete the variable star census in GCs. Since the introduction of CCD photometry and the approach of difference image analysis (DIA; cf. Alard & Lupton 1998), the study and census of variable stars in GCs has experienced a revitalization and many new variables as well as new properties of individual cases have been discovered. Since 2002 we have been carrying out a systematic CCD imaging program to obtain time-series photometry of a sample of GCs with a wide range of metallicities, with the aim of updating the variable star census and employing the Fourier decomposition of RRL light curves for the determination of specific stellar physical parameters of astrophysical relevance, such as metallicities, luminosities, masses and radii. The virtues of DIA as a powerful tool to discover variable stars, or unveil small amplitude variations in Blazhko RRL stars in the densely populated central regions of GCs, have been demonstrated in several recent papers by our group (e.g. Arellano Ferro et al. 2013a, 2012; Bramich et al. 2011; Figuera Jaimes et al. 2013; Kains et al. 2013). We used the DanDIA2 pipeline for the data reduction process (Bramich et al. 2013), which includes an algorithm that models the convolution kernel matching the PSF of a pair of images of the same field as a discrete pixel array (Bramich 2008).
In the present paper we summarize the variable stars found in our program for the GCs we have studied and describe the fundamental approach to the calculation of the physical parameters via the Fourier decomposition of the light curves of the RRL stars. The mean [Fe/H], MV and distance calculated from the Fourier decomposition procedure applied homogeneously to an extended data set are listed. These results are essential for the subsequent discussion on the luminosity of the Horizontal Branch and its dependence on the metallicity, i.e. the MV -[Fe/H] relation which we discuss in detail in § 5.
The Fourier decomposition procedure applied homogeneously to an extended data set have also led to a homogeneous set of distance estimates as described in section § 5.1.
2. Observations and reductions
2.1. Observations
The majority of the observations for our program have been carried out using the JohnsonKron-Cousins V and I filters and have been performed with the 2.0m Himalayan Chandra Telescope (HCT) of the Indian Astronomical Observatory (IAO), Hanle, India. We have also used the 2.15-m telescope of the Complejo Astronómico El Leoncito (CASLEO), San Juan, Argentina, and the Danish 1.54 m telescope at La Silla, Chile, and the LCOGT 1 m telescopes network at the South African Astronomical Observatory (SAAO) in Sutherland, South Africa, at the Siding Spring Observatory (SSO) in New South Wales, Australia, and at Cerro Tololo Inter-American Observatory (CTIO), Chile.
2.2. Transformation to the Standard System
Standard stars in the field of the clusters are mainly taken from the work of Stetson (2000) 3. Typically between 30 and 200 standard stars per GCs are used to transform our instrumental system into the Johnson-Kron-Cousins photometric system (Landolt 1992). The standard minus the instrumental magnitude differences show a mild dependence on the colour. The transformation equations are of the form:
where V and I are the magnitudes in the standard system, and v and i are in the instrumental system. A, B, C and D are the corresponding transformation coefficients.
3. Variable stars in our sample of globular clusters
The first step in identifying the known variable stars in a given cluster is based in the Catalogue of Variable Stars in Galactic Globular Clusters (CVSGGC) (Clement et al. 2001). We then explore the light curves of all stars produced by DanDIA in the field of our images for each cluster, in search of signs of variability. Towards this, we employ different statistical approaches that have been described in detail in the paper by Arellano Ferro et al. (2013a) and that for brevity we do not repeat here.
The colour-magnitude diagrams (CMD) of M5 and NGC 6229 shown in Fig. 1 illustrate all the regions where variable stars are expected to be present and hence the CMD guides the search for new variables.
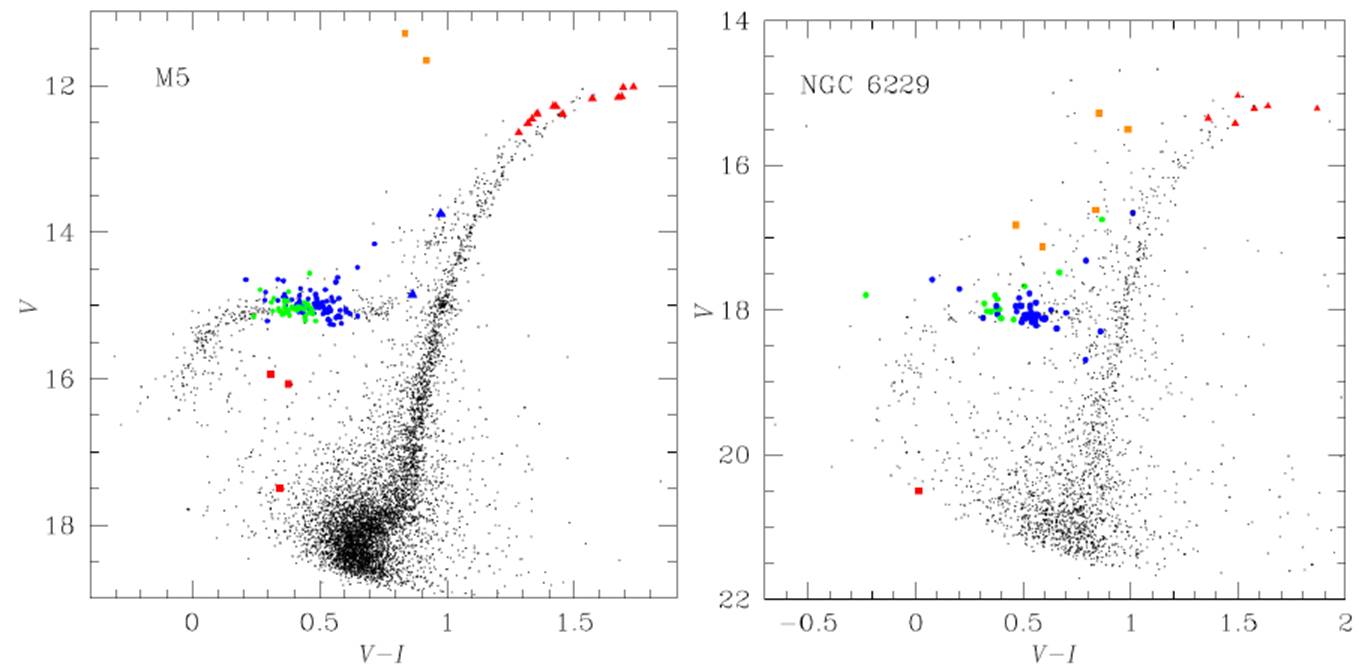
Fig. 1 Examples of colour-magnitude diagrams of M5 and NGC 6229 with their variable stars marked to illustrate the regions where variable stars are expected and hence to guide the search for new variables. Colours are: blue circles-RRab, green circles- RRc, orange squares- CW or RV Tau, red triangles- SR, red squares - SX Phe, blue triangles-Eclipsing binaries. The color figure can be viewed online.
We have so far discovered 253 new variables of different types (46 RRab, 30 RRc and 3 double mode RRL stars, 30 SX Phe, 7 eclipsing binaries (EB), 15 Pop II Cepheids (of which 2 are anomalous) and 122 SR or L as listed in Table 1.
Table 1 Number of presently known variables per cluster for the most common variable types, in a sample of GCS studied by our group†.
| GC | RRab | RRc | RRd | SX Phe | EB | CW-(AC)-RV | SR, L | Total per cluster | Ref. | |
| NGC (M) | ||||||||||
| 288 | 0/1 | 0/1 | 0/0 | 0/8 | 0/1 | 0/0 | 0/1 | 0/12 | 1 | |
| 1904 (M79) | 0/6 | 1/5 | 0/0 | 0/5 | 0/1 | 0/1 | 0/14 | 1/32 | 2 | |
| 3201 | 0/72 | 0/7 | 0/0 | 3/24 | 0/11 | 0/0 | 0/8 | 3/122 | 3 | |
| 4147 | 0/5 | 1/10 | 0/0 | 0/0 | 0/0 | 0/0 | 0/0 | 1/15 | 4 | |
| 4590 (M68) | 0/14 | 0/16 | 0/12 | 4/6 | 0/0 | 0/0 | 0/0 | 4/48 | 5 | |
| 5024 (M53) | 0/29 | 2/35 | 0/0 | 13/28 | 0/0 | 0/0 | 1/12 | 16/104 | 6,7 | |
| 5053 | 0/6 | 0/4 | 0/0 | 0/5 | 0/0 | 0/0 | 0/0 | 0/15 | 8 | |
| 5466 | 0/13 | 0/8 | 0/0 | 0/9 | 0/3 | 0/1 | 2/2 | 2/36 | 9 | |
| 5904 (M5) | 2/91 | 1/39 | 0/0 | 1/6 | 1/3 | 0/2 | 11/12 | 16/153 | 17,18 | |
| 6229 | 14/42 | 6/15 | 0/0 | 1/1 | 0/0 | 2/5 | 6/6 | 29/69 | 19 | |
| 6333 (M9) | 1/10 | 2/10 | 1/1 | 0/0 | 3/4 | 1/1 | 7/8 | 15/34 | 10 | |
| 6366 | 0/1 | 0/0 | 0/0 | 1/1 | 1/1 | 1/1 | 3/4 | 6/8 | 11 | |
| 6388 | 1/11 | 2/15 | 0/0 | 0/1 | 0/10 | 3/13 | 40/53 | 46/103 | 21 | |
| 6401‡ | 2/23 | 1/10 | 1/1 | 0/0 | 0/0 | 1/1 | 0/0 | 5/35 | 20 | |
| 6441 | 3/48 | 0/19 | 1/1 | 0/1 | 0/19 | 7/8 | 44/78 | 55/174 | 21 | |
| 6528 | 1/1 | 1/1 | 0/0 | 0/0 | 1/1 | 0/0 | 4/4 | 7/7 | 21 | |
| 6638 | 9/10 | 4/17 | 0/0 | 0/0 | 0/0 | 0/0 | 3/3 | 16/30 | 21 | |
| 6652 | 0/3 | 1/2 | 0/0 | 0/0 | 0/1 | 0/0 | 0/2 | 1/8 | 21 | |
| 6981 (M72) | 8/37 | 3/7 | 0/0 | 3/3 | 0/0 | 0/0 | 0/0 | 14/47 | 12 | |
| 7078 (M15) | 0/65 | 0/64 | 0/32 | 0/4 | 0/2 | 0/3 | 0/3 | 0/173 | 13 | |
| 7089 (M2) | 5/23 | 3/15 | 0/0 | 0/0 | 0/0 | 0/4 | 0/0 | 8/42 | 14 | |
| 7099 (M30) | 0/4 | 2/3 | 0/0 | 2/2 | 1/6 | 0/0 | 0/0 | 5/15 | 15 | |
| 7492 | 0/1 | 0/2 | 0/0 | 2/2 | 0/0 | 0/0 | 1/2 | 3/7 | 16 | |
| Total per type | 46/516 | 30/305 | 3/47 | 30/106 | 7/63 | 15/40 | 122/212 | 253/1289 | ||
4. Physical parameters of RR Lyrae stars
The Fourier decomposition of the RRL light curves is performed by fitting the observed light curve in V with a Fourier series model of the form:
where m(t) is the magnitude at time t, P is the period, and E is the epoch. A linear minimization routine is used to derive the best-fit values of the amplitudes Ak and phases φk of the sinusoidal components. From the amplitudes and phases of the harmonics in Equation 3, the Fourier parameters, defined as
Subsequently, the low-order Fourier parameters can be used in combination with semi-empirical calibrations to calculate [Fe/H] and M V for each RRL and hence the mean values of the metallicity and distance for the host cluster.
4.1. [Fe/H] and M V calibrations
For the calculation of [Fe/H] we adopted the following calibrations:
from Jurcsik & Kovács (1996) and Morgan et al. (2007) for RRab and RRc stars, respectively. The iron abundance on the Jurcsik & Kovács (1996) scale can be converted into the Zinn & West (1984) scale using the equation
For the calculation of M V we adopted the following calibrations:
from Kovács & Walker (2001) and Kovács (1998) for the RRab and RRc stars, respectively. The zero points of eqs. 6 and 7 have been calculated to scale the luminosities of RRab and RRc stars to the distance modulus of 18.5 mag for the Large Magellanic Cloud (LMC) (see the discussion in § 4.2 of Arellano Ferro et al. 2010).
In the equations above, the superscript (c) indicates that the Fourier decomposition is done using a cosine series, as in Equation 3, whereas a superscript (s) means that the equivalent sine series was employed.
In Table 2 we list the GCs studied by our team and the resulting
Table 2 mean values of [Fe/H] and M V from a homogeneous fourier decomposition of the light curves of RR Lyrae cluster members.
| GC | Oo Type | [Fe/H]ZW | MV | N | [Fe/H]ZW | MV | N | Ref. |
| NGC (M) | RRab | RRc | ||||||
| 1851 | I | -1.437±0.098 | 0.540±0.026 | 10 | -1.397±0.130 | 0.586±0.019 | 5 | 23 |
| 3201 | I | -1.483±0.098 | 0.604±0.045 | 19 | -1.473±0.098 | 0.576±0.045 | 2 | 3 |
| 4147 | I | -1.516±0.038 | 0.583±0.066 | 2 | -1.675±0.260 | 0.562±0.064 | 6 | 4 |
| 5272 (M3) | I | -1.560±0.156 | 0.589±0.046 | 59 | -1.648±0.136 | 0.555±0.059 | 23 | 24 |
| 5904 (M5) | I | -1.444±0.094 | 0.577±0.081 | 35 | -1.490±0.106 | 0.575±0.028 | 22 | 19 |
| 6171 (M107) | I | -1.310±0.120 | 0.635±0.104 | 6 | -1.034±0.115 | 0.573±0.037 | 7 | 22 |
| 6229 | I | -1.416±0.065 | 0.621±0.050 | 12 | -1.401±0.160 | 0.564±0.078 | 7 | 20 |
| 6362 | I | -1.345±0.149 | 0.589±0.032 | 6 | -1.229±0.221 | 0.574±0.053 | 10 | this work |
| 6366 | I | -0.844 | 0.705 | 1 | - | - | - | 112 |
| 6401 | I | -1.254±0.064 | 0.648±0.062 | 22 | -1.266±0.225 | 0.575±0.034 | 9 | 21 |
| 6934 | I | -1.571±0.137 | 0.584±0.052 | 16 | -1.531±0.110 | 0.593±0.010 | 5 | this work |
| 6981 (M72) | I | -1.482±0.030 | 0.623±0.023 | 13 | -1.661±0.082 | 0.568±0.038 | 4 | 14 |
| NGC(M) | RRab | RRc | ||||||
| 288 | II | -1.8525 | 0.376 | 1 | -1.591 | 0.579 | 1 | 1 |
| 1904 (M79) | II | -1.854±0.1375 | 0.459±0.084 | 5 | -1.732 | 0.584 | 1 | 2 |
| 4590 (M68) | II | -2.085±0.0935 | 0.495±0.067 | 3 | -2.087±0.026 | 0.532±0.011 | 15 | 5 |
| 5024 (M53) | II | -1.956±0.0665 | 0.452±0.052 | 19 | -1.839±0.131 | 0.519±0.062 | 3 | 6 |
| 5053 | II | -2.085±0.1595 | 0.462±0.081 | 3 | -1.995±0.184 | 0.550±0.048 | 4 | 7 |
| 5466 | II | -2.051±0.1395 | 0.438±0.088 | 7 | -1.900±0.212 | 0.532±0.065 | 5 | 8 |
| 6333 (M9) | II | -1.912±0.1305 | 0.467±0.034 | 7 | -1.709±0.230 | 0.554±0.042 | 6 | 9 |
| 6341 (M92) | II | -2.125±0.1205 | 0.498±0.066 | 5 | -2.063±0.019 | 0.504±0.017 | 2 | 10 |
| 7078 (M15) | II | -2.240±0.1885 | 0.506±0.044 | 14 | -2.097±0.070 | 0.524±0.031 | 8 | 15 |
| 7089 (M2) | II | -1.775±0.1795 | 0.552±0.150 | 11 | -1.760±0.165 | 0.507±0.067 | 2 | 16 |
| 7099 (M30) | II | -2.066±0.0505 | 0.405±0.044 | 3 | -2.032 | 0.541 | 1 | 17 |
| 7492 | II | -1.8935 | 0.376 | 1 | - | - | - | 184 |
| RRab | RRc | |||||||
| 6388 | III | -1.345±0.054 | 0.528±0.040 | 2 | -0.672±0.236 | 0.609±0.068 | 6 | 12 |
| 6441 | III | -1.348±0.172 | 0.434±0.078 | 7 | -1.028±0.338 | 0.546±0.080 | 8 | 13 |
1Quoted uncertainties are 1-σ errors calculated from the scatter in the data for each cluster. The number of stars considered in the calculations is given by N.
2The only RRL V1 is probably not a cluster member.
3Adopted since published Fourier coefficients are insufficient.
4Based on one light curve not fully covered.
5This value has a -0.21 dex added, see § 5 for a discussion.
References are the source of the Fourier coefficients: 1. Arellano Ferro et al. (2013b); 2. Kains et al. (2012); 3. Arellano Ferro et al. (2014a); 4. Arellano Ferro et al. (2004); 5. Kains et al. (2015), 6. Arellano Ferro et al. (2011), 7. Arellano Ferro et al. (2010), 8. Arellano Ferro et al. (2008a), 9. Arellano Ferro et al. (2013a), 10. Marín (2002), 11. Arellano Ferro et al. (2008b), 12. Pritzl, et al. (2002), 13. Pritzl, et al. (2001), 14. Bramich et al. (2011)); 15. Arellano Ferro et al. (2006); 16. Lázaro et al. (2006); 17. Kains et al. (2013); 18. Figuera Jaimes et al. (2013); 19. Arellano Ferro et al. (2016); 20. Arellano Ferro et al. (2015b); 21. Tsapras et al. (2017); 22. Clement & Shelton(1997); 23. Walker (1998); 24. Cacciari et al. (2005).
5. The MV -[Fe/H] relation
The importance of RR Lyrae stars of being good distance indicators is well known since the early XXth century. Shapley (1917) recognized that "The median magnitude of the short-period variables [RR Lyrae stars] apparently has a rigorously constant value in each globular cluster”, a fact that was used later by Shapley himself to describe the Galactic distribution of globular clusters (Shapley 1918). This apparently constant value of the mean magnitude of the RR Lyraes can now be interpreted as the luminosity level of the horizontal branch (HB) being constant in all globular clusters. The fact that this is not exactly the case, but instead that metallicity plays a role in the luminosity level of the HB, has been demonstrated via synthetic models of Lee, Demarque & Zinn (1990) although the metallicity dependence was also known through the work by Sandage (1981a,b). Lee, Demarque & Zinn (1990) provide a calibration of the MV -[Fe/H] relation and discuss its dependence on helium abundance. This work was followed by more empirical calibrations by Walker (1992), Carney et al. (1992) and Sandage (1993). Complete summaries on the calibration of the MV -[Fe/H] relation can be found in the works of Chaboyer (1999), Cacciari & Clementini (2003) and Sandage & Tammann (2006). While the relation is believed to be linear in empirical work, a non-linear nature is advocated by theoretical work, e.g. Cassisi et al. (1999) and Vanden Berg et al. (2000).
The metallicity dependence of the Horizontal Branch (HB) luminosity can be studied from the mean absolute magnitude MV and [Fe/H] obtained for individual globular clusters using the Fourier decomposition of RRL light curves and the semiempirical calibrations described in § 4.1. Numerous Fourier decompositions of RRL light curves can be found in the literature. However, over the years, each author has used different calibrations and zero points to estimate MV and [Fe/H]. Our own group has also used slightly different equations in the earlier papers and it was not until the work by Arellano Ferro et al. (2010) that the firm zero points in Equations. 6 and 7 were adopted and we have used them subsequently.
To achieve a homogeneous approach, we have taken the light curve Fourier decomposition coefficients given in the original papers wherever they are available, (i.e. always in the case for our own works, and also in a few papers by other authors as indicated in Table 2). We have then carried out the calculations using the equations in § 4.1 for as many RRL’s as available in each cluster. In Table 2, the final mean values of MV and [Fe/H] and the adopted reddening for each case are recorded. The table is organized by Oosterhoff types; Oosterhoff (1939, 1944) realized that the periods of RRab stars in a given cluster group around two values; 0.55d (Oosteroff type I or OoI) and 0.65d (Oosteroff type II or OoII). OoI clusters are systematically more metal rich than OoII clusters. A third Oosterhoff class (OoIII) (Pritzl et al. 2000), which presently contains only two GCs, NGC 6388 and NGC 6441, is represented by very metal-rich systems where the periods of their RRab stars average about 0.75d. In Table 2 we include of 12 OoI, 12 OoII and 2 OoIII clusters. The calculations have been performed independently for RRab and RRc stars. For clusters with differential reddening, i.e. NGC 3201, NGC 6333 and NGC 6401, care has been taken in calculating the individual reddenning for each RRL. The interested reader is referred to the original papers for a detailed discussion on that subject.
It is known that Equation 4 overestimates [Fe/H] for metal poor clusters. This problem has been addressed by Jurcsik & Kovács (1996), Schwarzenberg Czerny & Kaluzny (1998), Kovács (2002), Nemec (2004) and Arellano Ferro et al. (2010). It is difficult to quantify a correction to be applied, and this is likely a function of the metallicity, however, empirical estimations in the above papers point to a value between -0.2 and -0.3 dex on the scale of Equation 4. We have adopted -0.3 dex, which on the ZW scale is equivalent to -0.21 dex. Therefore, the values listed in Table 2 for clusters with
In Fig. 2 we show the distribution of clusters in the M V -[Fe/H] plane obtained from the RRab stars (left panel) and the RRc stars (right panel). In the Figure we have included as reference, in gray colour, two theoretical versions of the M V -[Fe/H] relation of Cassisi et al. (1999) and VandenBerg et al. (2000) and the semi-empirical cluster distribution of Caputo et al. (2000) with their [Fe/H] values converted into the ZW scale.

Fig. 2 Empirical Mv-[Fe/H] relation from the homogeneous Fourier decomposition of RR Lyrae light curves in families of OoI, OoII and OoIII globular clusters. Data points are plotted with 1-σ error bars. The upper panel shows the cluster distribution where MV and [Fe/H] were calculated from the light curve decomposition of RRab stars. The solid black straight line is the least-squares fit to the data (except the OoIII clusters, and NGC 288, NGC 6366 and NGC 7492 which are based only on one star) and corresponds to Equation 8. Dotted, short, and long dashed straight lines are the relations of Clementini et al. (2003), Chaboyer (1999) and that adopted by Harris (1996) respectively. The lower panel refers to RRc stars and corresponds to Equation 9. The red straight line is the reproduction of the calibration for the RRab stars from the upper panel to stress the significantly different slope. Two non-linear theoretical calibrations from Cassisi et al. (1999) (long dash) and VandenBerg et al. (2000) (short-dash) are shown. The cluster distribution of Caputo et al. (2000) (gray triangles) is also included for reference. The color figure can be viewed online.
The solid black lines are the linear fits to the data and correspond to the equations:
for the RRab solutions, and
for the RRc solutions.
In the above fits we have omitted the clusters NGC 6388 and NGC 6441 which have been classified as of the Oo III type (Catelan 2009), also NGC 288 and NGC 7492, where the analysis is based only on one star, and NGC 6366 since it has been argued by Arellano Ferro et al. (2008b) that the sole reported RRab star is not a cluster member.
Equation 8 can be compared with the other well known calibrations, e.g. M V = 0.23(±0.04)[Fe/H] + 0.93(±0.12) of Chaboyer (1998) (short dashed line in Figure 2), M V = 0.22(±0.05)[Fe/H] + 0.89(±0.07) of Graton et al. (2003) or M V = 0.214(±0.047)[Fe/H]+ 0.88(±0.07) of Clementini et al. (2003) (dotted line), to which our relation is consistent within the respective uncertainties. It may also be compared with the relation M V = 0.16[Fe/H] + 0.84 adopted by Harris (1996) (long dashed line in Figure 2) or the one obtained by Kains et al. (2012) MV = 0.16(±0.01)[Fe/H]ZW + 0.85(±0.02) which are considerably flatter. We may comment at this point that the relation of Kains et al. (2012) was calculated taking M V and [Fe/H]ZW from the literature and that, although an attempt was made to set M V and [Fe/H]ZW into homogeneous scales, those parameters may have been calculated from different versions of the Fourier parameters calibrations and zero points. Also this relation was calculated including both RRab and RRc stars.
The most striking feature of Figure 2 is that the cluster distribution for the RRc stars (lower panel) is significantly flatter than the distribution for the RRab stars, and that it has a much smaller scatter. Equations 8 and 9 intersect at [Fe/H]ZW = −1.62 but the differences at [Fe/H]ZW = −2.2 and [Fe/H]ZW = −1.1 are as large as 0.076 dex and 0.068 dex respectively. We note that a visual inspection of Kains et al. (2012) Figure 9 may also suggest different slopes for the RRab and RRc stars.
We conclude that the two distributions are authentically different, and that RRab and RRc stars should be treated separately when considering the M V -[Fe/H] relation.
5.1. Distances to the globular clusters
Given the mean values of M V in Table 2, we have calculated the corresponding distances. Since M V for the RRab and the RRc come from independent calibrations, we have calculated and reported these two values of the distance as they are truly independent. The values are reported in Table 3. In column 7 we list the adopted values of E (B−V) in the calculations. For the clusters with differential reddening the reader is referred to the original papers for detailed discussions on the individual reddening estimations.
Table 3 Distances for a sample of globular clusters estimated homogeneously from the RR Lyrae fourier decompositions. Distances for the SX Phe are calculated from their P-L relation.
| GC NGC(M) | d(kpc) (RRab) | d(kpc) (RRc) | d (kpc) (SX Phe) P-L AF11 | No. of SX Phe | d (kpc) (SX Phe) P-L CS12 | E(B − V) | Ref. |
| 288 | 9.0±0.2 | - | 8.8±0.4 | 6 | 9.4±0.6 | 0.03 | 1 |
| 1851 | 12.6±0.2 | 12.4±0.2 | - | - | - | 0.02 | this work |
| 1904 (M79) | 13.3±0.4 | 12.9 | - | - | - | 0.01 | 2 |
| 3201 | 5.0±0.2 | 5.0±0.1 | 4.9±0.3 | 16 | 5.2±0.4 | dif | 3 |
| 4147 | 19.3 | 18.7±0.5 | - | - | - | 0.02 | 4 |
| 4590 (M68) | 9.9±0.3 | 10.0±0.2 | 9.8±0.5 | 6 | - | 0.05 | 5 |
| 5024 (M53) | 18.7±0.4 | 18.0±0.5 | 18.7±0.6 | 13 | 20.0±0.8 | 0.02 | 6 |
| 5053 | 17.0±0.4 | 16.7±0.4 | 17.1±1.1 | 12 | 17.7±1.2 | 0.02 | 7 |
| 5466 | 16.6±0.2 | 16.0±0.6 | 15.4±1.3 | 5 | 16.4±1.3 | 0.00 | 8 |
| 5904 (M5) | 7.6±0.2 | 7.5±0.3 | 6.7±0.5 | 3 | 7.5±0.2 | 0.03 | 19 |
| 6229 | 30.0±1.5 | 30.0±1.1 | 27.9 | 1 | 28.9 | 0.01 | 20 |
| 6333 (M9) | 8.1±0.2 | 7.9±0.3 | - | - | - | dif | 9 |
| 6341 (M92) | 8.2±0.2 | 8.2±0.4 | - | - | - | 0.02 | 10 |
| 6362 | 7.8±0.1 | 7.7±0.22 | 7.1±0.2 | 6 | 7.6±0.2 | 0.09 | this work |
| 6366 | 3.3 | - | - | - | - | 0.80 | 11 |
| 6388 | 9.5±1.2 | 11.1±1.1 | - | - | - | 0.40 | this work |
| 6401 | 6.35 | - | - | - | - | dif | 21 |
| 6441 | 11.0±1.8 | 11.7±1.0 | - | - | - | 0.51 | this work |
| 6934 | 16.0±0.4 | 15.9±0.4 | 16.1 | 1 | 17.5 | 0.10 | this work |
| 6981 (M72) | 16.7±0.4 | 16.7±0.4 | 16.8±1.6 | 3 | 18.0±1.0 | 0.06 | 14 |
| 7078 (M15) | 9.4±0.4 | 9.3±0.6 | - | - | - | 0.08 | 15 |
| 7089 (M2) | 11.1±0.6 | 11.7±0.02 | - | - | - | 0.06 | 16 |
| 7099 (M30) | 8.32±0.3 | 8.1 | 8.0 | 1 | 8.3 | 0.03 | 17 |
| 7492 | 24.3±0.5 | - | 22.1±3.2 | 2 | 24.1±3.7 | 0.00 | 18 |
Notes: The distance from the P-L relationships of SX Phe and the number of stars included are given, when available, in Columns 4, 5 and 6.
References: As in Table 2.
In the cases of clusters with SX Phe stars, we have employed the P − L relation calculated by Arellano Ferro et al. (2011) (AF11) which is of the form:
The corresponding distances and number of stars used in the calculation are listed in columns 4 and 5 of Table 3 respectively. Note that they are in excellent agreement with the distances from the RRab and RRc stars. The P-L calibration of Cohen and Sarajedini (2012) (CS12); M V = −3.389 logP −1.640 was also considered and the results are listed in column 6 of Table 3. This calibration tends to produce distances between 5 and 15 % larger than eq. 10, although both estimates agree well within the 1-σ errors.
In our opinion the distances reported in Table 3 represent the best set of homogeneous results that have been obtained from photometric methods for the sample of globular clusters studied.
6. Conclusions
The CCD time-series photometric study of globular clusters, in combination with difference image analysis, has proven to be very fruitful in the discovery of new variables and hence in updating the variable star census in each of the studied clusters. In many cases, more accurate periods and new ephemerides have been provided for some known variables. Even in those cases where no new variables have been found, we have generally been able to establish magnitude limits for the existence of hitherto unknown variables.
The adopted semi-empirical calibrations and their zero points for the calculation of physical parameters via the Fourier decomposition of RRL light curves leads to a set of homogeneous mean values of M V and [Fe/H] for a family of GCs with a wide range of metallicities, hence including a good sample of both OoI and OoII types. These results enable a discussion of the variation of the HB luminosity with the metallicity through the well-known M V -[Fe/H] relation, based on a rather unprecedented homogeneous approach. The resulting M V -[Fe/H] relation from the Fourier decomposition of RRab stars in a family of 12 clusters reproduces the mean relation found by Chaboyer (1999) from a number of independent methods. However, the M V -[Fe/H] relation found from the Fourier decomposition of RRc stars has a significantly lower slope and smaller dispersion. Finally we note that the metal-rich OoIII clusters do not follow the above relations.

