


 nueva página del texto (beta)
 Inglés (pdf)
 Artículo en XML
 Referencias del artículo
 Enviar artículo por email
 Citado por SciELO
  Similares en
SciELO
Similares en
SciELO 
 Permalink
1. Introduction
Radio surveys of the region in the vicinity of the supernova of 1006 A.D. revealed a plateau or spur running out from the galactic plane near l = 330° which contains two shell-like objects: the Lupus Loop and SN1006 (Milne 1971). The general diffuse appearance of the Lupus Loop suggested that it is the remnant of a very old supernova (which is consistent with its low surface brightness) and these two remnants are not associated in any way (Milne & Dickel 1974). It was indicated earlier (Spoelstra 1973) that the expanding sphere of supernova remnants (SNRs) leads to a compression of the interstellar magnetic field, which results in an observable radio source, and that the spatial orientation of the loops contains information on the direction of the magnetic field of the undisturbed medium outside the shell. Spoelstra (1973) treated the Lupus Loop as an object similar to the main Galactic loops, and found that it indicates a magnetic field direction parallel to field found from Loop I. Radio continuum observations of this source are given in Milne (1971); Milne & Dickel (1974), radio line observations in Colomb & Dubner (1982), X-ray observations and its spectrum can be found in Toor (1980); Leahy et al. (1991); Ozaki et al. (1994); Kaplan et al. (2006) and references therein, while far UV observations are presented in Shinn et al. (2006).
The analysis of the filamentary structure observed in polarization by WMAP (Wilkinson Microwave Anisotropy Probe) satellite is given in Vidal et al. (2015); Vidal (2016). It is described there that most of the polarized emission (at high latitudes) comes from individual filamentary features, and some of these structures are the well-known continuum radio loops. Using WMAP data at 23, 33 and 41 GHz, these authors studied the diffuse polarized emission over the entire sky, they studied the diffuse polarized emission over the entire sky, and they obtained the (average) polarization spectral indices which were consistent with synchrotron radiation.
A catalogue of Galactic SNRs, with some statistics of their parameters, is presented in Green (2014a), along with a more detailed web-based version (Green 2014b). The current version of the catalogue contains 294 SNRs, and it is based on research in the published literature up to the end of 2013. The Lupus Loop, with catalogue name G330.0+15.0, is listed there, and some of its parameters are given. This low surface brightness loop has been observed in radio and X-ray wavelengths (Green 2014b).
Our aim is to study the properties of this remnant, and to calculate radio spectral index using the method we have previously developed. Our method of calculation is explained in detail in Borka Jovanović (2012) and references therein: we investigated Galactic Loops I-VI in Borka (2006); Borka Jovanović, Milogradov-Turin & Urošević (2006); Borka (2007); Borka, Milogradov-Turin & Urošević (2008); Borka Jovanovic & Urošević (2010); Urošević & Borka Jovanović (2011), and we investigated smaller remnants in Borka Jovanović & Urošević (2008, 2009a,b, 2010, 2011); Borka, Borka Jovanović & Urošević (2012). This method is applicable to extragalactic radio sources as well (Borka Jovanovic et al. 2012). In this paper we also want to investigate the nature of the radiation and to study how the spectral index varies across the face of the remnant. Besides, we want to analyze and study the polarization of this SNR and to investigate its connection with the spectral index.
2. Lupus loop area
2.1. Temperature Brightness Contours
We use the radio continuum surveys of the sky provided by Max Planck Institute for Radio Astronomy (MPIfR), Bonn, Germany, available at the internet site: http://www3.mpifr-bonn.mpg.de/survey.html. The observational data, which we use for our calculations, are obtained from continuum radio emission at 1420 MHz (Reich, Testori & Reich 2001) and 408 MHz (Haslam et al. 1982). At 34.5 MHz (Dwarakanath & Udaya Shankar 1990) the loop could not be resolved. The angular resolutions of the surveys are: 35’ at 1420 MHz and 0°.85 at 408 MHz, which give the corresponding observation rates for both l and b, (1/4)° (1420 MHz) and (1/3)° (408 MHz). The effective sensitivities for the average brightness temperature (Tb) are about 50 mK (1420 MHz) and 1.0 K (408 MHz).
As we showed earlier (Borka Jovanović (2012) and references therein), the method for defining a loop border and for determining the values of the temperature and brightness, which we developed for the main Galactic Loops I-VI, could be applicable to all SNRs. In this way we determined the Lupus Loop area which is shown in Figure 1. There is also influence of some other radio sources in the vicinity of the Lupus Loop, affecting the determination of its radio properties, like brightness and radio spectral index. The 3D plot showing brightness temperatures of this loop and its surrounding, at the frequency of 1420 MHz, is shown in Figure 2. To make this figure more clear, we marked the ridges of Lup and SN1006 with arrows. In Figure 3 we show a few temperature profiles. Note that temperature peak around l = 328° corresponds to another source (SN1006), and that we have to pay attention to the part of the profiles from l = 334° to 329° to see how they change over the Lupus SNR.
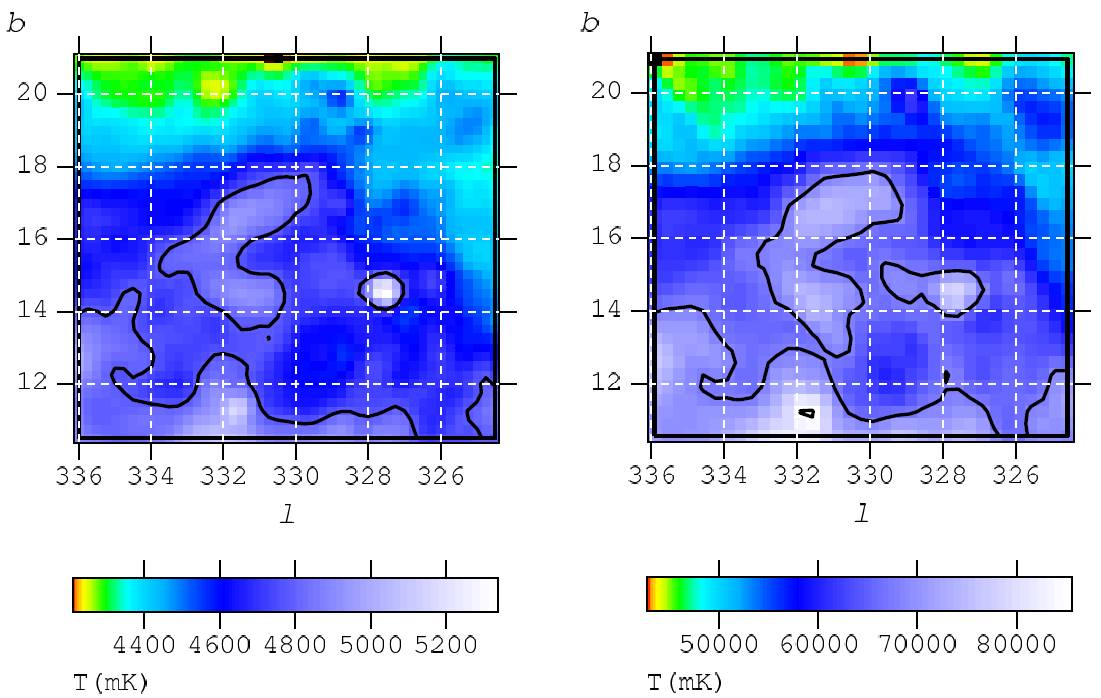
Fig. 1 Lupus Loop area with brightness temperature contours at 1420 MHz (left) and 408 MHz (right). The contours represent Tmin as given in Table 1. Below, the temperature scales are given (in mK).
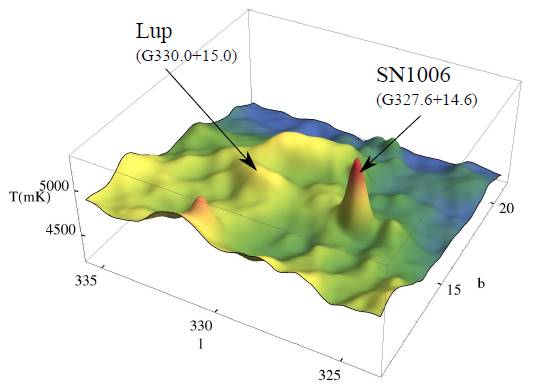
Fig. 2 The 3D map of the Lupus Loop and its surrounding at 1420 MHz. The brightness temperature is given in mK.
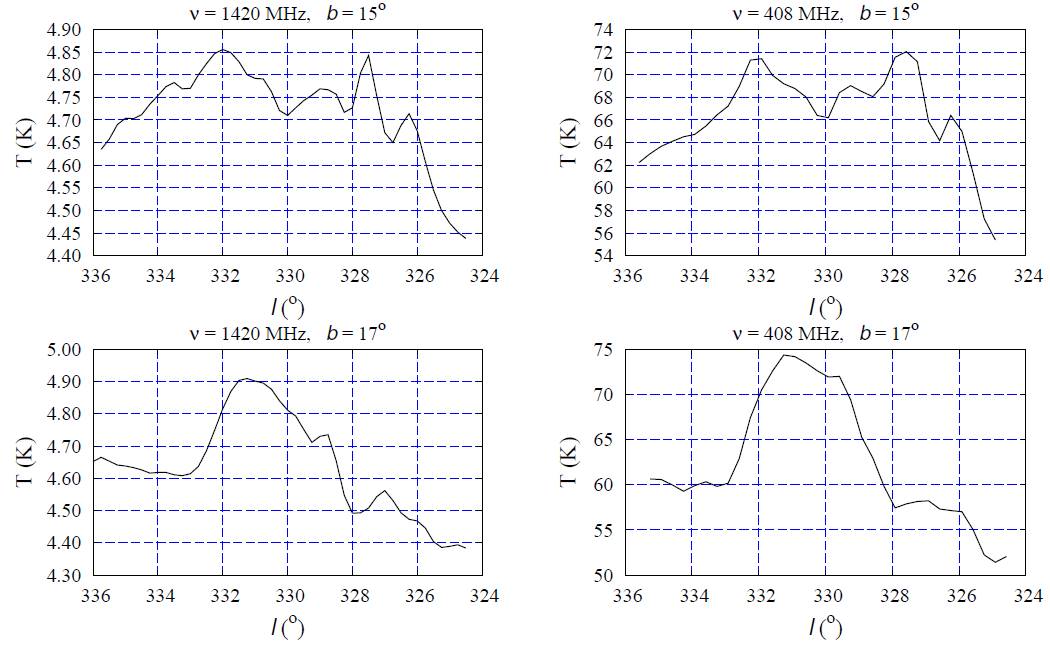
Fig. 3 Left: 1420 MHz temperature profiles for the area containing the Lupus Loop at galactic longitude b = 15° (top) and 17° (bottom). Right: 408 MHz temperature profiles for b = 15° (top) and 17° (bottom).
Table 1 Temperature borders, temperatures and brightnesses of the lupus loop at 1420 and 408 mhz.
| Frequency (MHz) | Tmin (K) | Tmax (K) | Temperature (K) | Brightness (10-23W/(m2 Hz Sr)) | Brightness reduced to 1000 MHz (10-23W/(m2 Hz Sr)) |
| 1420 | 4.78 | 5.4 | 0.10 ± 0.05 | 0.63 ± 0.31 | 8.82 ± 4.36 |
| 408 | 67.8 | 85 | 4.1 ± 1.0 | 2.12 ± 0.51 | 8.82 ± 2.13 |
*The brightnesses are reduced to 1000 MHz with the spectral index we calculated: α = 0.98.
2.2. Brightness Temperatures and Surface Brightnesses
Minimum and maximum brightness temperatures are given in Table 1. We use these values to determine the loop borders, and then, after subtracting the background emission over the Lupus area, we determine its brightness temperature Tb. Assuming the spectra to have a power-law form, i.e. the flux density to be proportional to the frequency, Sν ∝ ν−α (or Tb ∝ ν−β), and using data for at least two frequencies, we can calculate the radio spectral index α (or β = α + 2) by fitting this equation to the data. Knowing two values of the brightnesses (derived in this paper, at 1420 and 408 MHz), we obtain a radio spectral index α = 0.98. Using the relation:
where k is the Boltzmann constant and c the speed of light, we calculate the surface brightness Σν, and with:
we finally obtain the values reduced to 1000 MHz.
The results are listed in Table 1.
3. Radio spectral index
We calculated the mean value of the radio spectral index between 1420 and 408 MHz. With α = 0.98, we confirmed non-thermal emission of radiation for this remnant. Our motivation was also to study how the spectral index varies across the area. The distribution of radio spectral indices over the Lupus Loop area is shown in Figure 4.
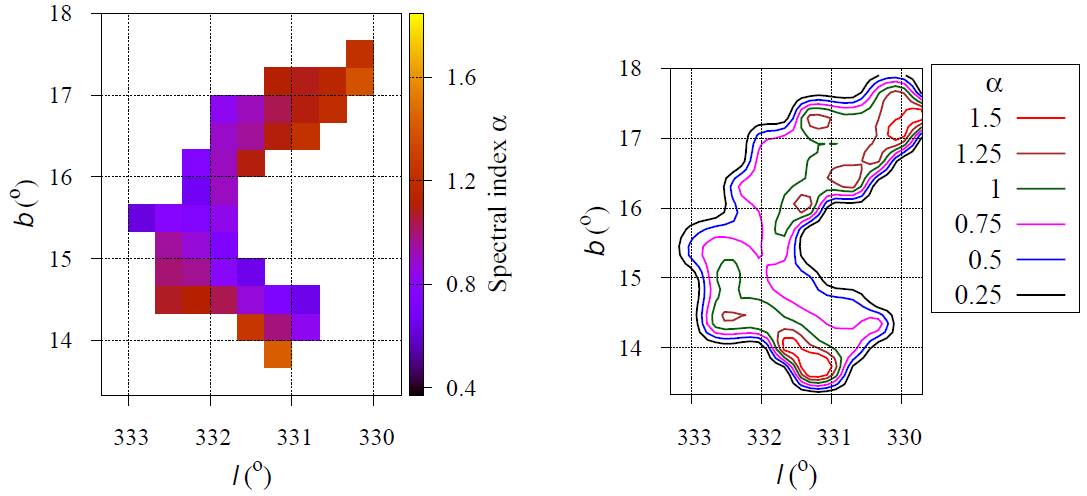
Fig. 4 Radio spectral index distribution across the Lupus Loop between 1420 and 408 MHz, as a color map (left) and interpolated contours (right). The color figure can be viewed online.
If we compare our value for α with earlier results, the new observations yield a greater value. Milne (1971) calculated the spectral index between the following frequencies: 5000, 2700, 1614, 1410, 635, 408 and 160 MHz, and obtained a mean value α = 0.38, while Milne & Dickel (1974) used data at 2700, 1660 and 1410 MHz which resulted in α = 0.5, but we have to stress that they mention that their conclusions about the Lupus Loop were uncertain and that more data were required. Our result is larger than the typical value for Galactic SNRs, but in Green’s catalogue (regarding a spectral index of about 0.5) it is mentioned that it is not precisely determined, and there is also a question mark as a notice that it should be recalculated. Previous authors probably took into account a wider area for the Lupus Loop (i.e. the loop together with part of the background which is outside the border) and in that way they obtained a lower brightness temperature, as well as a lower mean spectral index. Also, there is a noticeable tendency for more recent observations to give higher values of α.
Averaged values for the measured spectral indices of all-sky Galactic radiation vary with the frequency. For example, α = 0.55 between 45 and 408 MHz (Guzman et al. 2011), α = 0.71 between 408 and 3200 MHz (Platania et al. 2003) and α = 1.01 between 2300 and 3300 MHz (Davies et al. 2006). The spectral distribution of the remnant gives information about the distribution of energy of the relativistic electrons that produce the emission observed at a given radio-frequeny. Like in the previously mentioned case of Galaxy radiation, the averaged value of α depends on the frequencies. In that way we can also explain a greater absolute value for α in our paper compared with older results.
The very edge of the Lupus Loop is mixed with strong external sources and it is very hard to resolve the loop from the background in this region. If we take the whole area of the loop we will get α = 0.98, and such a high value of the index is probably due to the influence of these additional strong radio sources, and of the ridges of the loop. The largest part of the Lupus area has spectral indices between 0.4 and 0.8. If we take the area of the loop without the area enclosed by α = 1 line (see green line in Figure 4), i.e. between the contours 0.4 and 1, we get an average spectral index α = 0.77, which is much closer to the typical value for SNRs (α = 0.5). This area of the loop is relatively clean of external sources and it indicates that the mean spectral index is also highly influenced by the loop’s ridges. The spectral index variations must reflect differences in the acceleration process from place to place within the SNR. This indicates that the increased emissivity could be the result of particle acceleration in the SNR shock (see Zhang et al. (1997)). Although the spectral index determinations based on several frequencies should be more accurate than those based on two frequencies, we improved the method for extracting the background, and this is very important when there are confusing sources.
As can be seen from Figure 4, the distribution of the radio spectral index tells us that its variation over the loop area is rather large. So, we think that the distribution of spectral index over the loop is a more adequate description of the loop than the mean spectral index.
From Figure 4 it can also be seen that the largest part of the loop’s area has radio spectral indices between 0.4 and 0.8. Then, the greater values are connected with its ridges, and as a whole the mean value is 0.98.
4. The polarization surveys and maps
If we want to measure the properties of the synchrotron radiation, it is very useful to have polarization data, because the polarization of mechanisms other than synchrotron is much smaller (see the comparison for the polarization of different mechanisms of radiation in Vidal et al. 2015). Polarized electromagnetic radiation can be described using the Stokes parameters. We can use the electric field vector (electromagnetic wave propagation)
with Q, U being the second and third Stokes parameters, which can be expressed by the polarization angle χ in the following form:
The degree of polarization is given as:
where Sp is the flux density of the polarized component, and Su of the unpolarized one.
The Villa Elisa survey data at 1435 MHz (Testori, Reich & Reich 2008) for linear polarization of the southern sky are accessible via the MPIfR Survey Sampler. The linear polarization of Galactic synchrotron emission is given with the angular resolution of the survey of 35’, that is, the observations are given at the rates (1/4)° (for both l and b). The 1435 MHz polarized intensity for the area surrounding Lupus Loop is shown in Figure 5. From the polarization survey in this figure we can see how the intensity is distributed, and we also have appended intensity contours. Besides, in order to make the figure clearer, we present the superimposed contour levels of α, extracted from Figure 4.
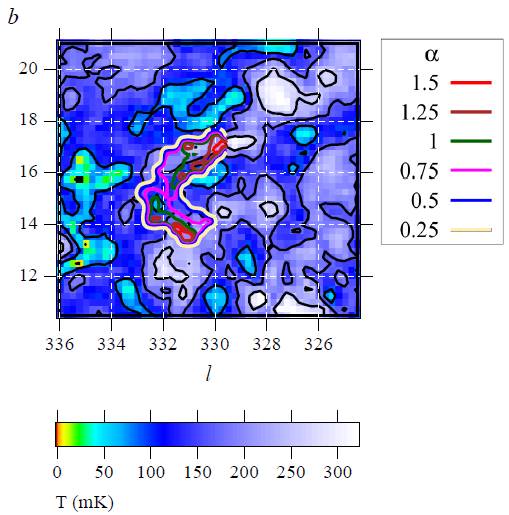
Fig. 5 Polarized intensity at 1435 MHz for the area surrounding the Lupus Loop, shown in Galactic coordinates. Total intensity contours start at 10 mK Tb and run in steps of 80 mK Tb.
For a comparison of the radio continuum survey with the observations of polarized emission it is very useful to present polarized intensities and polarization angles (see Figure 6): the polarized intensities are represented by the length of the vectors, and the polarization angles by their orientation.
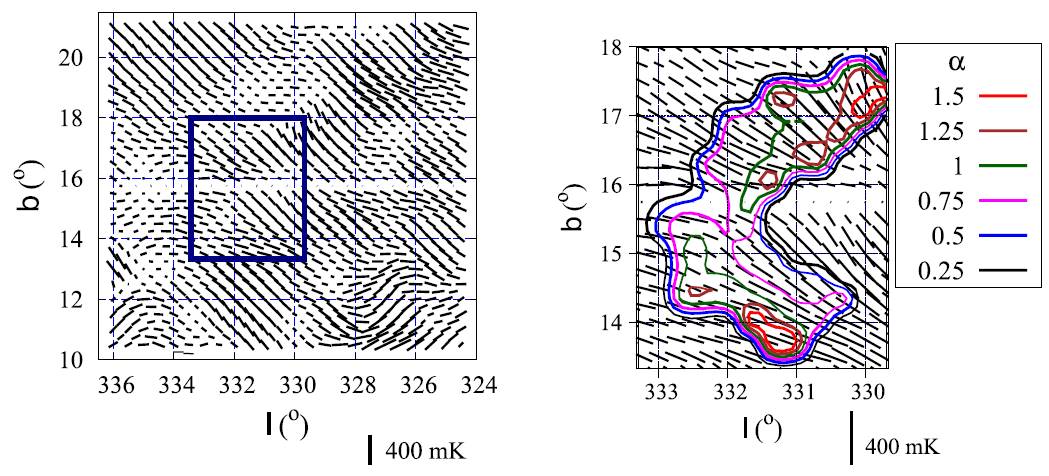
Fig. 6 (Left:) The distribution of the polarization
5. Discussion
Regarding Figures 1 and 6 we can conclude that the polarization intensity is strongly correlated with the brightness temperature, especially in the cases at 1420 MHz for the brightness temperature and at 1435 MHz for the polarized intensity. Polarized emission is dominated by synchrotron radiation and, since the frequencies 1420 and 1435 MHz are very close to each other, this correlation is expected. Polarization maps give us information about the interstellar distribution and this will be one additional way to search for new Galactic loops.
The large-scale polarization pattern is explained using the model proposed by Heiles (1998). In this model, an expanded shell compresses the magnetic field in the local interstellar medium (ISM). Our results indicate that the magnetic field should be compressed by the supernova shock. The magnetic field of the Lupus Loop is related to the magnetic field in the ambient interstellar medium (Heiles 1998; Platania et al. 2003; Davies et al. 2006; Guzman et al. 2011).
The dependence of the polarized intensity P at 1435 MHz with the spectral index α between 1420 and 408 MHz over the area of the Lupus Loop is presented in Figure 7, suggesting a certain linear correlation between these two quantities. In order to estimate the significance of this linear dependence, we calculated the correlation coefficient r and the significance level p0 at which the null hypothesis of zero correlation is disproved. The relatively high value obtained for r (r = 0.39) and small value for p0 (p0 = 0.001) both indicate that there is a significant linear correlation between the polarized intensity P and the spectral index α over the area of Lupus Loop, as can be also noticed in Figure 6. We also tested the linear dependence between these two quantities by fitting their common values with the function P (α) = kα +
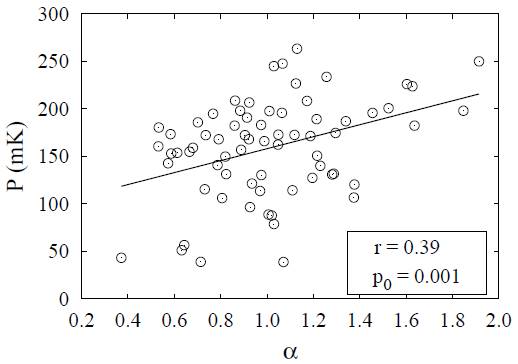
Fig. 7 Polarized intensity P at 1435 MHz versus spectral index α between 1420 and 408 MHz, calculated at the common positions (l,b) over the area of the Lupus Loop, bounded by Tmin and Tmax. Open circles represent (α, P) pairs, and the straight solid line their fit by a linear function: P (α) = kα +
We confirmed the previous theory (Spoelstra 1973) stating that the spatial orientation of the loops contains information on the direction of the magnetic field of the undisturbed medium outside the shell.
6. Conclusions
As we showed earlier (Borka Jovanović (2012) and references therein), the method for defining a loop border and for determining the values of brightness temperature and surface brightness, which we developed for main Galactic Loops I-VI, could be applicable to all SNRs. Here we use this method in order to:
• determine the brightness temperature borders of the Lupus Loop at 1420 and 408 MHz,
• calculate the mean radio spectral index between the specified frequencies, as well as the distribution of indices across the face of this remnant,
• study the correlation between the radio spectral index distribution and the corresponding polarized intensity distribution within the given borders.
In the frequency range under consideration synchrotron radiation dominates the spectrum. We used the radio spectral index to study the radiation mechanism of this radio source. The value obtained for the spectral index (which is > 0.1) confirmed the non-thermal nature of the radiation for this source. The main disagreement in the measured values can probably be caused by differences in the chosen area for the Lupus Loop border. These new observations yielded a value of α greater than that of Milne & Dickel (1974). Besides determining the nature of the radiation, we also showed how the spectral index varies across the face of the remnant.
Taking into account that SNRs radiate nonthermal (synchrotron) radiation due mainly to the magnetic field, which on the other hand is also responsible for the polarization of the radiation, we supposed that there exists a connection between the polarization and radio spectral index α, which we then confirmed.
We conclude that the spectral index significantly varies across the Lupus Loop. Over time, the synchrotron spectral index becomes steeper (reaches greater values, i.e. loops steepen as they age). The boundary of the Lupus Loop is not well defined and the ISM is rather inhomogeneous. That is why there are significant variations of the spectral indices α over the loop area.

