nueva página del texto (beta)
 Inglés (pdf)
 Artículo en XML
 Referencias del artículo
 Enviar artículo por email
 Citado por SciELO
  Similares en
SciELO
Similares en
SciELO 
 Permalink
1. Introduction
In the 1980’s, the Infrared Astronomical Satellite (IRAS) detected emission excesses with respect to the stellar photosphere in well-known nearby main-sequence stars (Aumann et al. 1984; Backman & Paresce 1993). These infrared excesses were associated with dust grains in circumstellar disks. However, the dust cannot be only decaying remnants of the primordial disk. The radiation pressure and the Poynting-Robertson drag (P-R drag), remove dust grains on time-scales several orders of magnitude shorter than the age of the systems (Krivov 2010). For example, in the Solar System, P-R drag removes dust grains with sizes of ≈10 µm in about 105 yr (Fixsen & Dwek 2002). The disks must be replenished of dust by some kind of mechanism.
Taking the Solar System as reference, it was proposed that the collisions between bodies such as those constituting the Asteroid and Kuiper Belts are the main source of the dust in the disks (Harper et al. 1984; Weissman 1984; Zuckerman & Becklin 1993). Since they would be populated by such bodies, these type of disks are known as “debris disks”. An important issue is the origin of the bodies: these objects would be the leftovers or “debris” of a planetary formation process. Collisions can be triggered by embedded planets capable of perturbing the smaller planetesimals, inducing a collisional cascade that slowly grinds them to dust (Kenyon & Bromley 2001, 2004). Kenyon & Bromley (2002) have also shown that interactions with a star passing by are another mechanism capable of triggering collisional cascades that release dust into the disks.
The first debris disks discovered with IRAS were mainly associated with A- and F -type stars. Subsequently, this type of disks was also detected in later spectral type stars and particularly around G -type stars (Decin et al. 2000; Habing et al. 2001). Nevertheless, these disks were confined to the brightest and closest targets (Bryden et al. 2006). Instruments such as MIPS (Multiband Imaging Photometer for Spitzer, Rieke et al. 2004) on board of the Spitzer space telescope made feasible a more detailed analysis of the frequency of these structures around Sun-like stars (see, for example, Trilling et al. 2008). More recent observations with the Herschel infrared telescope (Pilbratt et al. 2010) have revealed that about 20% of solar-type stars have evidence of debris disks (Eiroa et al. 2013). These observations have also provided a higher fraction of thermally resolved disks than previous missions (Booth et al. 2013; Pawellek et al. 2014).
The study of debris disks is of great interest because it can provide clues to the formation and later evolution of extrasolar planetary systems, as well as the Solar System. In addition, debris disks have been detected not only around single stars, but also around main-sequence binary systems (Trilling et al. 2007). Recent studies have reported that ≈10-20% of binary stars have debris disks (Rodriguez & Zuckerman 2012; Eiroa et al. 2013; Rodriguez et al. 2015). However, there may be a dependence of the disk frequency on the spectral type (Thureau et al. 2014; Rodriguez et al. 2015). Debris disks in binary systems are relevant for several reasons: (1) About 45% of Sun-like stars are binaries or higher-order multiple star systems (Duquennoy & Mayor 1991; Raghavan et al. 2010; Duchêne & Kraus 2013; Tokovinin 2014), (2) Most of the stars with known extrasolar planets have G spectral types (The Extrasolar Planets Encyclopaedia1, The Exoplanet Data Explorer2), (3) A significant fraction of planet-host stars (≈ 25%) are, actually, binaries or multiple systems (Raghavan et al. 2006; Desidera & Barbieri 2007) although this percentage is probably a lower limit.
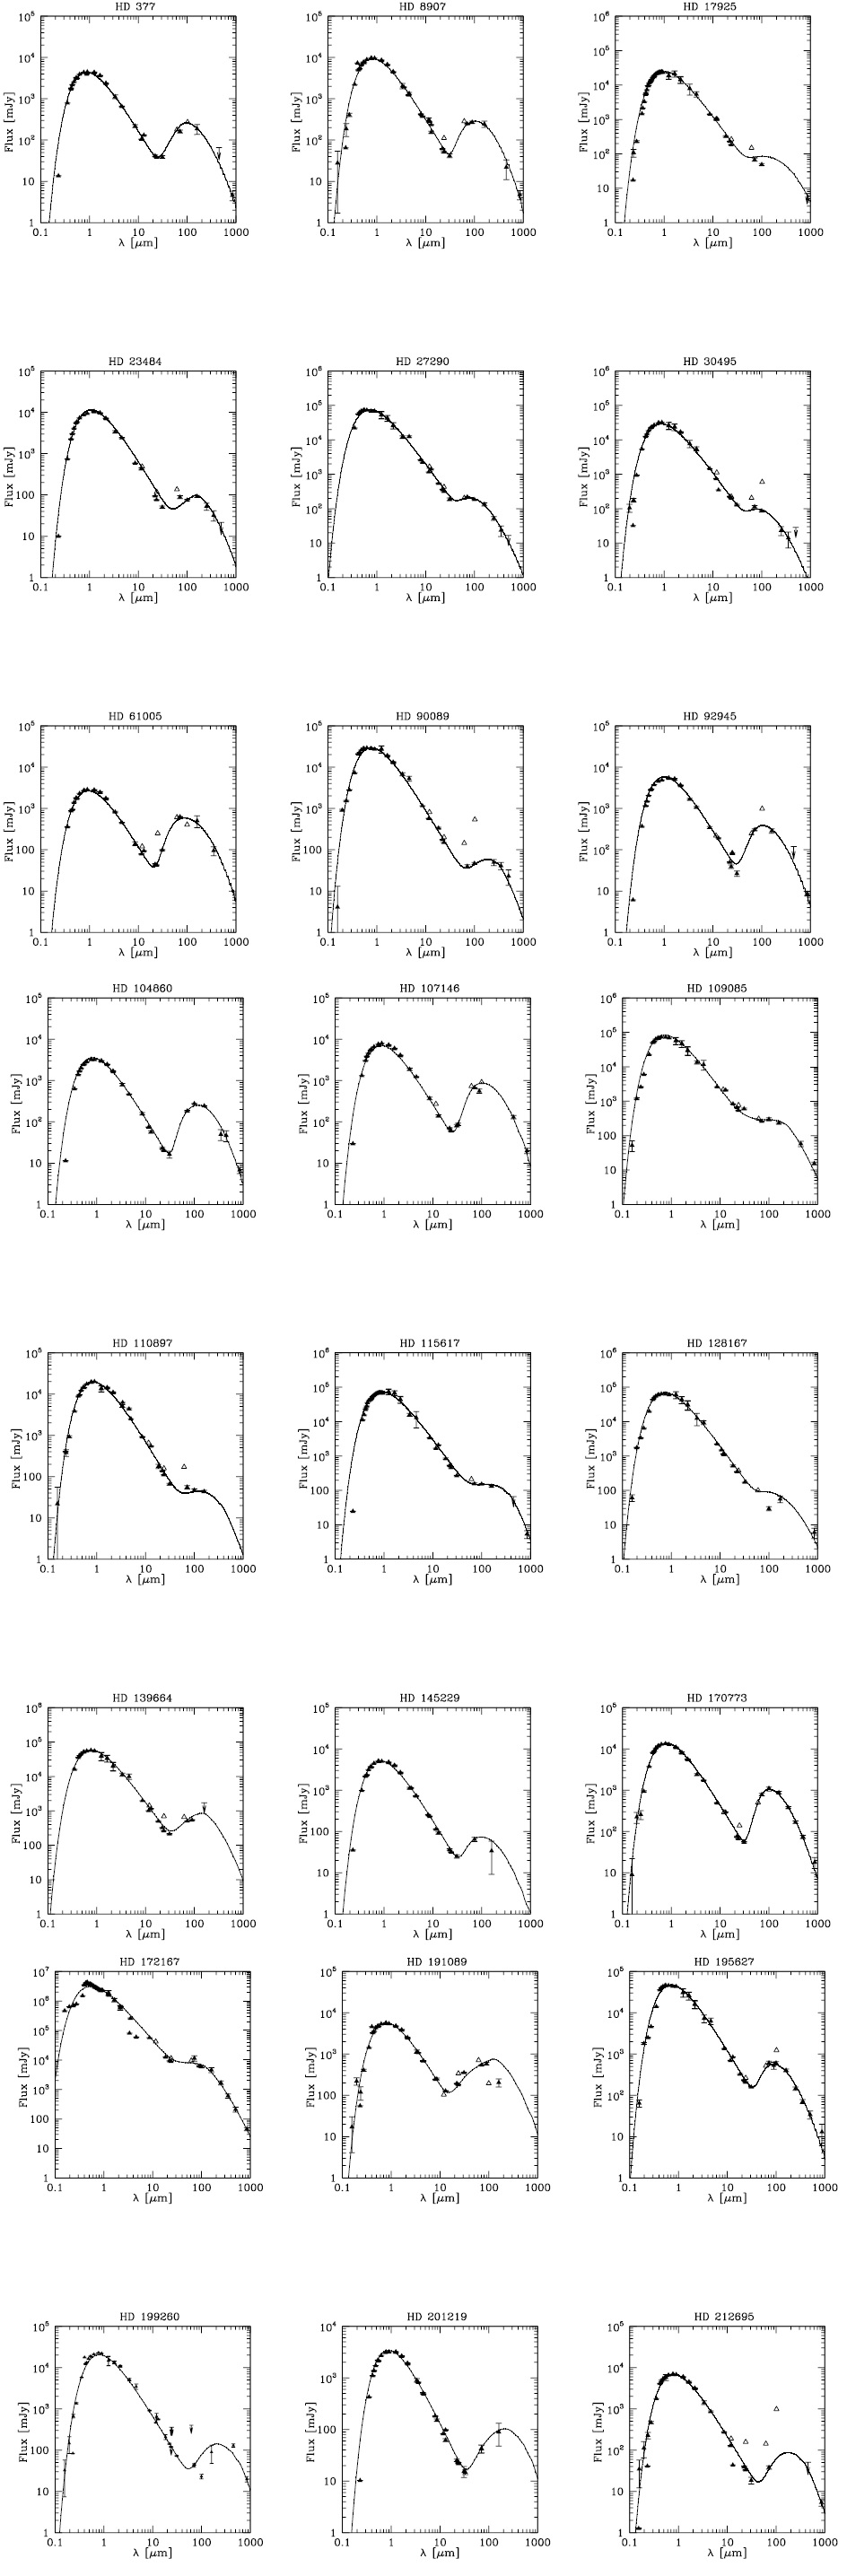
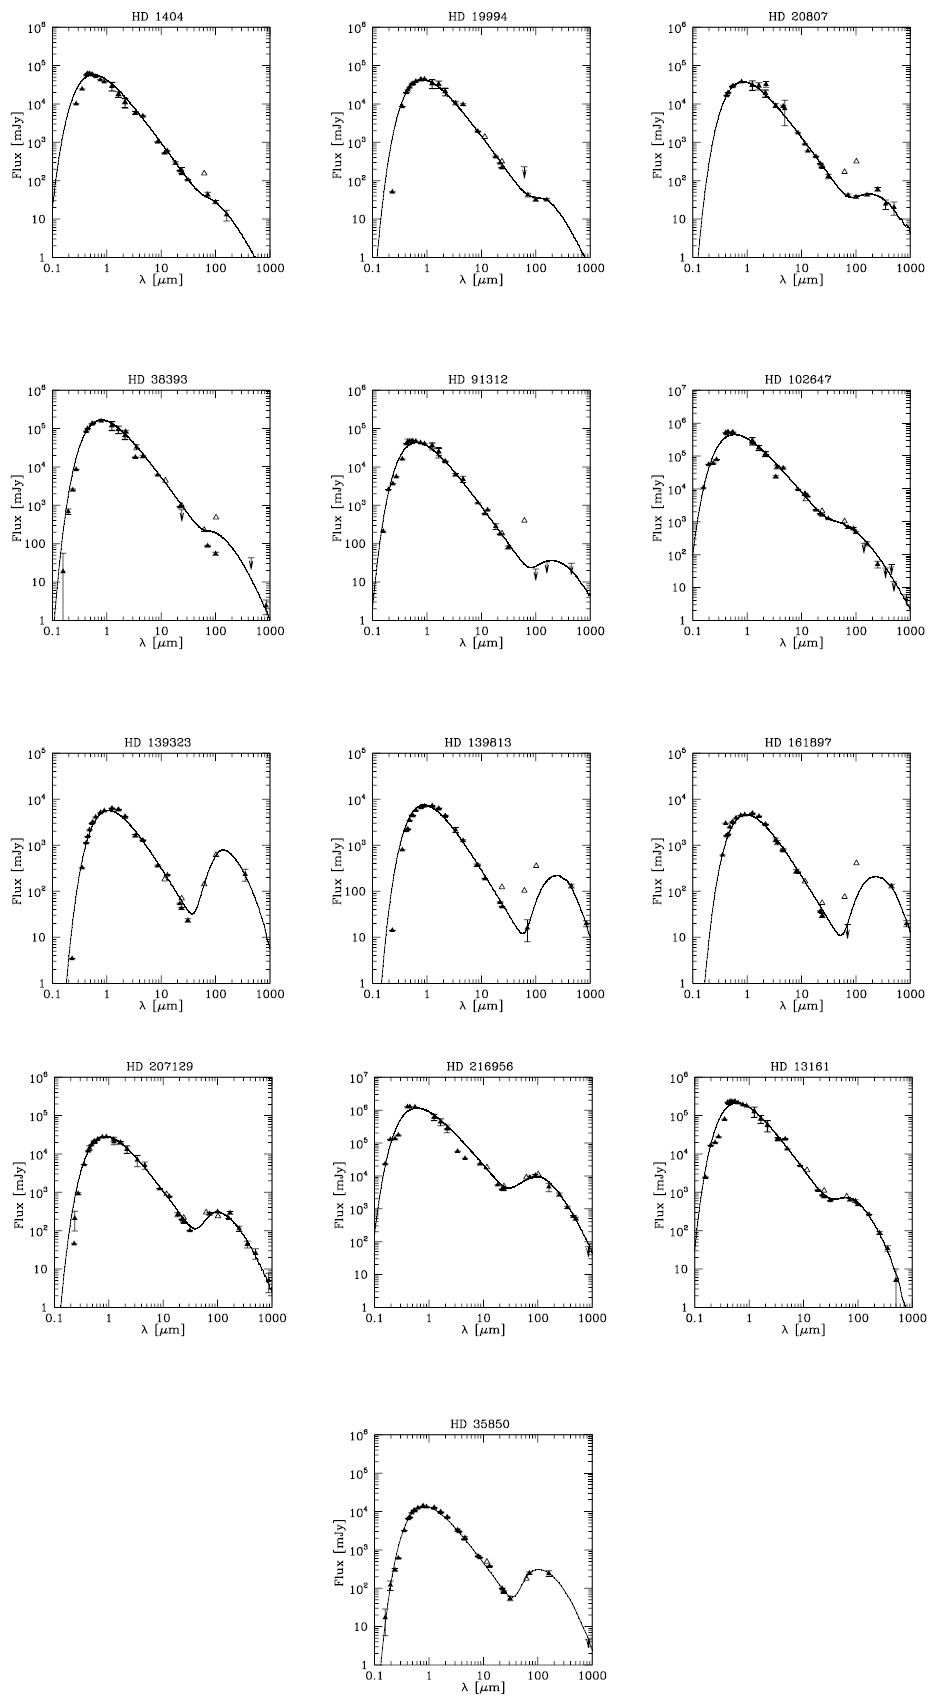
In this contribution, we model the observed spectral energy distributions (SEDs) of 25 single and 14 binary stars with ages > 100 Myr. The objects in both samples have flux measurements at λ > 100 µm and emission excesses at infrared wavelengths attributed to circumstellar disks. The aim of this work is to characterize debris disks previously detected in binary systems and to compare their parameters with those of debris disks around single stars. In § 2 we present the samples, briefly describe the code used and the procedure adopted for the SED modeling. Results are discussed in § 3. Finally, in § 4, we present our conclusions.
2. SED modeling
2.1. The samples
We compiled a sample of 25 single stars and 14 binary systems selected from published data of Spitzer campaigns (such as in: Beichman et al. 2005b, 2006; Bryden et al. 2006; Trilling et al. 2007, 2008; Hillenbrand et al. 2008), some of which were also observed by Herschel afterwards. All these stars have IR excesses likely to be produced by debris disks. We restricted the ages to > 100 Myr to avoid including protoplanetary disks, or disks in a transitional phase (see, for example, Espaillat et al. 2012). The objects in both samples have flux measurements at λ > 100 µm available in the literature. Infrared and submillimeter observations are essential to reveal the presence of cold and large dust grains, not detected at shorter wavelengths. In this sense, measurements at λ > 100 µm have an impact on the estimated mass of dust, and on the modeling of the SEDs in general. The availability of submillimeter fluxes is rather limited and restricts the number of systems that can be included in our samples. This is particularly critical for main sequence binary stars. Although the number of objects that meet these selection criteria is rather small, it is interesting to conduct an initial comparison between single and binary stars to search for differences in the characteristics of the debris disks in these two groups.
Binary systems were selected with separations large enough to ensure that the debris disks are around the primary components and to avoid contamination of the photometry by the companion star (particularly at the longest wavelengths). Basic properties of the objects in the single and binary samples are listed in Tables 1 and 2. For the binary stars, the parameters correspond to the primary component. Table 2 also provides the projected separation between the components (Abin). The binary stars HD 13161 and HD 35850 with small angular separations (<0.01 and 0.0008′′, respectively) are probably associated with circumbinary disks, and they will be treated as single stars in our analysis. The median distances for single and binary systems are 21.4 and 19.1 pc, respectively. Median luminosities are ≈ 1.5 L⊙, for single, and ≈ 1.8 L⊙, for binary stars. The stars in the samples are predominantly late-F and early-G type stars.
Table 1 Single stars properties.
| HD | d | V | Spectral | L | Agea |
|---|---|---|---|---|---|
| (number) | (pc) | Type | (L⊙) | (Gyr) | |
| 377 | 38.8 | 7.6 | G2 V | 1.2 | 4.1 |
| 8907 | 34.2 | 6.7 | F8 V | 2.0 | 4.2 |
| 10647 | 17.3 | 5.5 | F9 V | 1.5 | 1.9 |
| 17925 | 10.4 | 6.0 | K1 V | 0.4 | 6.2 |
| 23484 | 16.0 | 7.8 | K3 V | 0.4 | 0.6 |
| 27290 | 20.5 | 4.2 | F1 V | 6.5 | 0.3 |
| 30495 | 13.3 | 5.5 | G2 V | 0.9 | 1.2 |
| 61005 | 35.3 | 8.2 | G9 V | 0.5 | 4.1 |
| 90089 | 21.5 | 5.3 | F4 V | 2.7 | 0.3 |
| 92945 | 21.4 | 7.7 | K1 V | 0.4 | 6.5 |
| 104860 | 47.9 | 7.9 | F8 V | 1.5 | 5.3 |
| 107146 | 28.5 | 7.1 | G2 V | 1.0 | 2.4 |
| 109085 | 18.2 | 4.3 | F2 V | 5.6 | 1.6 |
| 110897 | 17.4 | 6.0 | G0 V | 1.0 | 6.5 |
| 115617 | 8.5 | 4.7 | G7 V | 0.9 | 5.3 |
| 128167 | 15.5 | 4.5 | F2 V | 3.4 | 1.4 |
| 139664 | 17.5 | 4.6 | F4 V | 3.5 | 1.2 |
| 145229 | 33.0 | 7.4 | G0 V | 1.0 | 1.3 |
| 170773 | 37.0 | 6.2 | F5 V | 3.6 | 1.7 |
| 172167 | 7.8 | 0.03 | A0 V | 53.0 | 0.2 |
| 191089 | 53.5 | 7.2 | F5 V | 3.1 | 2.6 |
| 195627 | 27.8 | 4.7 | F0 V | 7.8 | 0.2 |
| 199260 | 21.0 | 5.7 | F6 V | 1.7 | 2.3 |
| 201219 | 35.9 | 8.0 | G5 V | 0.7 | 6.7 |
| 212695 | 46.5 | 6.9 | F5 V | 2.8 | 1.4 |
aAges are from Holmberg et al. (2009) and Casagrande et al. (2011) except for HD 172167 (Song et al. 2000).
Table 2 Binary stars properties.
| HD | d | V | Spectral | L | Abin a | Abin | Ageb |
|---|---|---|---|---|---|---|---|
| (number) | (pc) | Type | (L⊙ ) | (′′) | (AU) | (Gyr) | |
| 1404 | 41.3 | 4.5 | A2 V | 26.1 | 6.6 | 272 | 0.5 |
| 19994 | 22.6 | 5.1 | F8.5 V | 4.0 | 6.8 | 154 | 5.7 |
| 20807 | 12.0 | 5.2 | G0 V | 1.0 | 309.1 | 3708 | 7.8 |
| 38393 | 8.9 | 4.1 | F6 V | 2.5 | 95.8 | 853 | 1.3 |
| 48682 | 16.5 | 5.2 | G0 V | 1.8 | 36.2 | 598 | 1.3 |
| 91312 | 34.6 | 4.7 | A7 IV | 12.0 | 16.9 | 585 | 0.2 |
| 102647 | 10.9 | 2.1 | A3 V | 14.0 | 39.7 | 433 | 0.3 |
| 139323 | 22.4 | 7.5 | K3 V | 0.4 | 121.8 | 2728 | 5.0 |
| 139813 | 21.7 | 7.3 | G5 V | 0.6 | 31.7 | 688 | 9.5 |
| 161897 | 28.9 | 7.6 | K0 V | 0.6 | 90.0 | 2601 | 2.0 |
| 207129 | 15.6 | 5.5 | G2 V | 1.3 | 55.0 | 858 | 5.2 |
| 216956 | 7.7 | 1.2 | A4 V | 17.0 | 7062.3 | 54401 | 0.4 |
| 13161c | 38.11 | 3.00 | A5 III | 78.0 | <0.01 | 0.4 | 0.7 |
| 35850c | 36.84 | 6.31 | F8 V | 1.8 | 0.0008 | 0.03 | 4.3 |
aSeparations are from the Catalog of Components of Double & Multiple stars (on-line version at: http://vizier.u-strasbg.fr/viz-bin/VizieR-3?-source=I/274/ccdm) except for: HD 13161 (Trilling et al. 2007), HD 38393, HD 102647 (Mason et al. 2001), HD 35850 and HD 216956 (Rodriguez & Zuckerman 2012).
bAges are from Holmberg et al. (2009) and Casagrande et al. (2011) except for: HD 91312, HD 139323 (Rhee et al. 2007), HD 13161 (Vican 2012), HD 102647 (David & Hillenbrand 2015), HD 161897 (Carpenter et al. 2009) and HD 216956 (Mamajek 2012).
cBinary separation < 0.01′′. Likely circumbinary disk.
To construct the observed SEDs we collected data from several catalogs (such as Hipparcos, 2MASS, WISE, etc.) using the tool “Photometry Viewer3” from the Vizier Catalogue service. These data were complemented with observations from Herschel, Spitzer, and surveys at submillimeter wave-lengths published in the literature. The fluxes (at λ> 22 µm) used to construct the observed SEDs are listed in Appendix A.
2.2. Modeling procedure
The SEDs were modeled with the code of Wolf & Hillenbrand (2003)4. This code calculates the stellar radiation that is scattered and re-emitted by dust grains that are assumed to be spherical with a homogeneous chemical composition. Then, the capability of the dust grains to scatter, absorb, and re-emit the stellar radiation is described by the scatter and absorption efficiencies (Qsca(λ), Qabs(λ)), providing a better description of the dust emission than the blackbody model approach. The stellar continuum is represented by the emission of a blackbody. We fixed the effective temperature (Teff), and the stellar luminosity (L) according to the spectral type of the star. The corresponding Teff was derived from the calibration of Kenyon & Hartmann (1995). A black-body for the stellar continuum is a simple but adequate model for the SED modeling proposed, since the fluxes in broad-band filters are fitted.
The disk parameters are: the inner (ain) and outer (aout) radii, the mass (Mdust), the radial distribution (N (a)) and the size distribution (N (D)) of the dust grains, the minimum (Dmin) and maximum (Dmax) sizes of the grains, and the chemical composition.
The radial distribution is described by a power-law of the form:
where N(a) is the density of dust grains at the radial distance a from the central source. The code allows to vary the index q. Several mechanisms affect the distribution of dust grains in the disks, for example: the P-R drag, the radiation pressure, the collisions between bodies, the presence of massive objects embedded in the disk, etc.
Disks images suggest that the radial distribution of dust is not given by a single law of the form of equation (1) (see, for example, Kalas et al. 2005; Schneider et al. 2005). Indeed, when a power-law can be fitted, the observations show that the q index varies from q = 1 to q = 3 (Metchev et al. 2005; Kalas et al. 2006; Schneider et al. 2006; Fitzgerald et al. 2007; Maness et al. 2008). In addition, there are a few examples outside this range (Augereau et al. 1999; Kalas et al. 2006).
In pre-main sequence T-Tauri stars (ages of ≈106 yr), q lies between 1.9 and 2.4 (see, e.g., Kenyon & Hartmann 1987; D’ Alessio et al. 1999; Chiang & Goldreich 1999) and it is expected that q in debris disks will lie in the same range (Wolf & Hillenbrand 2003). In addition, for the Solar System, q varies from q = 1.0 to q = 2.4 (Gor’kavyi et al. 1997; Kelsall et al. 1998), depending on the distance to the Sun. In this work, we adopted q = 1.5 in an attempt to select a value as representative as possible for most of the analyzed systems.
The size distribution of the dust grains is also described by a power-law function:
N (D) is the number of dust grains with size D, within the interval (Dmin, Dmax). We assumed the same size distribution for all the disks in our sample and set a value of the index x = 3.5. This corresponds to the size distribution of an infinite collisional cascade (Dohnanyi 1969).
In debris disks, dust particles are generated through collisions of parent bodies. The collisional life-time is much shorter than the P-R drag time for known debris disks. This means that planetesimals are ground up into dust particles, small enough to be removed by the radiation pressure, before the P-R drag produces any appreciable effect. Thus, the P-R drag can be ignored in known debris disks (Dominik & Decin 2003; Wyatt 2005). In this context, the radiation pressure sets a lower limit to the size of the dust grains, and collisions prevail as the dominating process that governs the size of the dust grains. Estimations of index x from observations show values that are in agreement with a collisional cascade, although several cases are outside the expected range (Mittal et al. 2015).
We adopted a chemical composition of 100% astronomical silicates for all the disks in our samples (Draine & Lee 1984; Weingartner & Draine 2001). While observations show that dust grains in debris disks are not composed exclusively of astronomical silicates (for example, HD 69830, Beichman et al. 2005a; β Pictoris, Chen et al. 2007; or even the Solar System, Greenberg 1998; Reach et al. 2003), and that the composition is not the same from one disk to another, it is likely that the main constituent of the dust are the astronomical silicates (Pollack et al. 1994).
The fitted parameters in our modeling were: the inner and outer radii of the disks (ain, aout), the mass of dust (Mdust), and the minimum and maximum sizes of the dust grains (Dmin, Dmax). For each star, we constructed several models varying these parameters. We chose the one that best reproduced the observed fluxes and minimized the residuals through the chi-squared determination. We adopted fixed values for q, x, and the chemical composition to reduce the number of fitted parameters. For these parameters, we assumed values provided by current theories of debris disks as explained above.
3. Results
The resulting parameters from the SED modeling are listed in Table 3. Figure 1 shows two examples of the modeled SEDs for a single star (HD 10647, left panel) and a binary system (HD 48682, right panel). The complete sets of SEDs models (for both groups, single and binary stars) are presented in Appendix B. In this section, we compare and analyze the characteristics of the debris disks in both samples of stars.
Table 3 Model parameters for the disks in single and binary stars.
| Single star | Binary stars | ||||||||||||
|---|---|---|---|---|---|---|---|---|---|---|---|---|---|
| HD | ain | aout | Mdust | Dmin | Dmax | (F850 /F* ) | HD | ain | aout | Mdust | Dmin | Dmax | (F850 /F*) |
| (number) | (AU) | (AU) | (MMoon ) | (μm) | (μm) | (number) | (AU) | (AU) | (MMoon ) | (μm) | (μm) | ||
| 377 | 10 | 150 | 1.35 | 10 | 450 | 179 | 1404 | 50 | 250 | 0.03 | 10 | 400 | 3a |
| 8907 | 50 | 200 | 1.22 | 5 | 180 | 102 | 19994 | 50 | 200 | 0.05 | 20170 | 250 | 4a |
| 10647 | 25 | 160 | 1.08 | 5 | 500 | 278 | 20807 | 50 | 150 | 0.13 | 10 | 250 | 33a |
| 17925 | 21 | 560 | 0.51 | 4 | 597 | 36 | 38393 | 40 | 90 | 0.01 | 10 | 180 | 2 |
| 23484 | 10 | 150 | 0.21 | 20 | 380 | 32a | 48682 | 10 | 150 | 0.16 | 200 | 390 | 26 |
| 27290 | 65 | 150 | 0.11 | 6 | 300 | 7a | 91312 | 250 | 570 | 1.89 | 5 | 490 | 43a |
| 30495 | 12 | 100 | 0.03 | 8 | 12a | 6 | 102647 | 10 | 150 | 0.03 | 15 | 400 | 5 |
| 61005 | 8 | 200 | 4.06 | 5 | 230 | 538a | 139323 | 25 | 100 | 1.76 | 50 | 160 | 230a |
| 90089 | 45 | 350 | 0.35 | 40 | 350 | 27a | 139813 | 80 | 160 | 2.14 | 60 | 220 | 44 |
| 92945 | 11 | 100 | 0.76 | 9 | 350 | 192 | 161897 | 65 | 155 | 4.06 | 10 | 290 | 539 |
| 104860 | 45 | 290 | 4.33 | 6 | 200 | 365 | 207129 | 20 | 100 | 0.20 | 15 | 400 | 25 |
| 107146 | 16 | 263 | 4.33 | 7 | 608a | 481 | 216956 | 25 | 250 | 0.54 | 8 | 280 | 30 |
| 109085 | 3 | 350 | 0.49 | 30 | 500 | 44 | 13161b | 30 | 350 | 0.18 | 8 | 80 | 1a |
| 110897 | 15 | 120 | 0.09 | 50 | 480 | 22a | 35850b | 37 | 211 | 0.76 | 140 | 70 | |
| 115617 | 8 | 190 | 0.08 | 50 | 200 | 11 | |||||||
| 128167 | 3 | 580 | 0.35 | 73 | 590 | 20 | |||||||
| 139664 | 18 | 300 | 1.03 | 20 | 250 | 63a | |||||||
| 145229 | 17 | 250 | 0.54 | 6 | 300 | 60a | |||||||
| 170773 | 70 | 110 | 2.6 | 9 | 250 | 278 | |||||||
| 172167 | 15 | 239 | 0.16 | 15 | 299 | 6 | |||||||
| 191089 | 5 | 380 | 15.16 | 17 | 600 | 854a | |||||||
| 195627 | 55 | 200 | 0.65 | 7 | 270 | 73 | |||||||
| 199260 | 30 | 250 | 0.02 | 1 | 40 | 2.9a | |||||||
| 201219 | 15 | 330 | 5.95 | 100 | 400 | 1000a | |||||||
| 212695 | 50 | 250 | 0.87 | 50 | 300 | 164 | |||||||
aFor systems with no data at 850 µm, we used values from the SEDs modeling.
bBinary separation <0.01′′. Likely circumbinary disk.
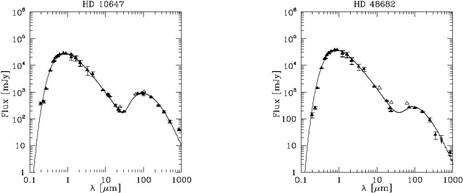
Fig. 1 Left panel: SED model for a single star (HD 10647). Right panel: SED model for a binary system (HD 48682). Triangles indicate actual fluxes and arrows upper limits. Error bars for fluxes at different wavelengths are included. Observations from IRAS are indicated with empty triangles but were not used in the modeling. The complete sets of modeled SEDs for single and binary stars, listed in Table 3, are shown in Figure 4 and 5, respectively.
3.1. Inner and Outer Radii
Histograms of the inner radii distributions for our samples are shown in the left panel of Figure 2. The median values of the inner radii for debris disks in single and binary stars are 17 and 38 AU, respectively. The statistical Kolmogorov-Smirnov test (K-S test, Press et al. 1992) indicated a probability of 0.1 (p-value) that both radii distributions are drawn from the same population. Consequently, no significant difference between the two distributions was found. Debris disks in both types of stars appear to have been cleared of dust in the inner region ≲3−5 AU . None of the systems had emission excesses at λ < 24 µm. This may be an evolutionary effect: gas and dust depletion starts from inside out as the central star evolves (Chen et al. 2005). Considering the ages of the stars in our samples (> 100 Myr), this may explain the relative lack of dust in the inner zone of the disks (Vican & Schneider 2014).
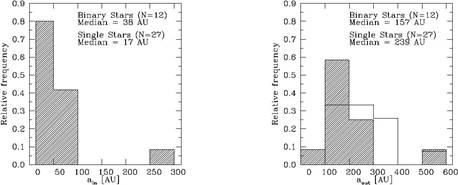
Fig. 2 Left panel: Inner radii distributions for the debris disks in single (empty histogram) and binary systems (dashed histogram). Right panel: Outer radii distributions for our samples of disks in single and binary stars.
Outer radii distributions are shown in the right panel of Figure 2. The medians are 239 and 157 AU for the disks in single and binary systems, respectively. The probability for both distributions to represent the same population of disks is 0.1 and thus there are no clear differences between them.
Twenty stars in our samples had disk radii estimates in the literature: HD 1404 from (Thureau et al. 2014), HD 10647, HD 13161, HD 23484, HD 27290, HD 48682, HD 102647, HD 104860, HD 109085, HD 170773, HD 172167, HD 195627, HD 207129 and HD 216956 from (Pawellek et al. 2014), HD 17925, HD 20807, HD 30495, HD 90089, HD 110897 and HD 199260 from (Eiroa et al. 2013). In general, these radii were smaller than our determinations. It is known that blackbody models for the dust emission tend to underestimate the radius of the disks. Rodriguez & Zuckerman (2012) found that radii measured from thermally resolved disks were larger by a factor 1 to 5 when compared with those derived from blackbody-fits. Booth et al. (2013) constrained this factor from 1 to 2.5. On average, our radii are a factor between 2.5 to 5 larger than those in the literature. This may explain, at least in part, the differences between Eiroa’s and Thureau’s estimations. Radii from Pawellek et al. (2014) were derived from PACS/Herschel images at λ = 70, 100 or 160 µm. In this case, the difference may be due to the fact that our determinations include fluxes in a wider spectral range and thus our values are weighted by contributions at different wavelengths.
It has been argued that the proximity of a companion star may limit the amount of dust located towards the outer portion of the disk. Depending on the orbit eccentricity and on the mass ratio between components, theoretical studies predict that the outer radius of a disk around the primary star is about 0.4-0.5Abin (Artymowicz & Lubow 1994). Nine out of 12 binaries with circumprimary disks have aout < 0.4Abin and therefore, the dust is located in a stable zone. The three stars that do not meet this condition are: HD 1404 (Abin = 272 AU, aout = 250 AU), HD 19994 (Abin = 154 AU, aout = 200 AU) and HD 91312 (Abin = 585 AU, aout = 570 AU). In these cases, dust may be located in an unstable zone.
In Table 4 we list binary stars with thermal emission or scatter light resolved debris disks from the literature. This table provides the measured radii (ares), the separations between the components (Abin), and the stability classification according to the criteria from Artymowicz & Lubow (1994). The first six systems in Table 4 are included in our sample of binary stars. We are not considering HD 13161 as it probably has a circumbinary disk. For HD 19994, the radius measured from resolved images places the dust in the unstable region, in agreement with our estimation from the SED modeling. In addition, Rodriguez et al. (2015) also reported that HD 19994 may have the disk in an unstable region. The remaining five systems have the disk in a stable region.
Table 4 Binary stars with resolved debris disks.
| HD | ares | Abin | Stable? | References |
|---|---|---|---|---|
| (AU) | (AU) | |||
| 19994a | 95 | 154 | No | Eiroa et al.(2013) |
| 20807a | 48 | 3708 | Yes | Eiroa et al.(2013) |
| 48682a | 142 | 598 | Yes | Pawellek et al. (2014) |
| 102647a | 48 | 433 | Yes | Pawellek et al. (2014) |
| 207129a | 148 | 858 | Yes | Pawellek et al. (2014) |
| 216956a | 123 | 54401 | Yes | Pawellek et al. (2014) |
| 13161b | 161 | 0.4 | Yes | Booth et al. (2013) |
| 20320b | 178 | 0.2c | Yes | Booth et al. (2013) |
| 109573 | 70 | 502d | Yes | Schneider et al. (1999) |
| 139006b | 77 | 0.2c | Yes | Booth et al. (2013) |
| 181296 | 24 | 199c | Yes | Smith et al. (2009) |
| 211415 | 100 | 69e | No | Eiroa et al. (2010) |
aIn our sample of binary stars.
bLikely, circumbinary disks.
cRodriguez & Zuckerman (2012).
dCatalog of Components of Double & Multiple stars (on-line version at: http://vizier.u-strasbg.fr/viz-bin/VizieR-3?-source=I/274/ccdm).
For HD 1404 and HD 91312 we found no previous reported radii from resolved images. The availability of these images would help to confirm if the dust is located in an unstable zone.
HD 13161, HD 20320 and HD 139006 probably have circumbinary disks because of the small separation between the components. These stars as well as HD 109573 and HD 181296, with likely circumstellar disks, have dust in a stable region. On the other hand, HD 211415 may have dust in an unstable zone according to the radius determined from resolved images.
3.2. Dust Mass and Grain Sizes
Histograms of the dust masses are shown in the left panel of Figure 3. Median values of dust masses for the disks in single and binary stars are ≈ 0.6 and ≈ 0.2 MMoon, respectively. According to the K-S test, the mass distributions do not differ significantly (p-value ≈ 0.3).
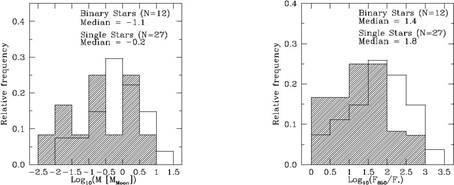
Fig. 3 Left panel: Mass distributions for the disks in single (empty histogram) and binary systems (dashed histogram). Right panel: Flux ratios distributions for single and binary stars at λ = 850 µm.
Eight stars in our sample have previous determinations of mass published in the literature including fluxes at λ > 100 µm. Panić et al. (2013) estimated masses for the disks of HD 377 (≈ 3.6 MMoon), HD 92945 (≈ 2.1 MMoon), and HD 115617 (≈ 0.2 MMoon). Thureau et al. (2014) obtained lower limits for the masses of the disks of HD 1404 (≈ 0.1 MMoon), HD 13161 (≈ 0.6 MMoon), HD 102647 (≈ 0.01 MMoon), HD 172167 (≈ 0.7 MMoon) and HD 216956 (≈ 0.2 MMoon). A direct comparison is difficult because of the variety of models applied. The masses from Panić et al. (2013) are, in general, larger than the masses presented here. The difference may arise because the authors used minimum temperatures in their calculations. The masses derived by Thureau et al. (2014) are consistent with our estimations, considering the uncertainties.
The fractional infrared luminosity f = LIR /Lbol (LIR is the bolometric luminosity of a blackbody disk model, and Lbol is the bolometric luminosity of the stellar model), has been used in the literature to investigate whether debris disks around single stars are more massive than the disks in binary stars. Thureau et al. (2014) compared f for 12 single and 9 multiple systems, and though the median value was almost twice as high for single stars, the difference was not significant. A similar trend was presented by Rodriguez & Zuckerman (2012). Rodriguez et al. (2015) also compared fractional luminosities for 55 single stars and 21 binary systems and no difference was reported between the two samples.
Observations of the near-IR and submillimeter emissions for pre-main sequence binary systems suggest smaller emission excesses in comparison with single stars (Jensen et al. 1996; Mathieu et al. 2000; Andrews & Williams 2005; Cieza et al. 2009; Harris et al. 2012). Rieke et al. (2005) analyzed the emission excesses at λ = 24 µm of a sample of 266 main-sequence stars, including about a dozen binary stars. They noticed that emission excess in binaries was smaller than in single stars.
In light of previous results, we inspected the flux ratios of the observed (F850) and the stellar (F∗) fluxes, as a way to investigate the influence that the cold dust (T < 20 K) may have in the total mass of the disks. These ratios are listed in Table 3. For systems with no data at λ = 850 µm, we adopted the values predicted by the SEDs models. Figure 3 shows the histograms of the flux ratios. The medians are 72 and 29 for the single and binary samples. The p-value from K-S test is 0.07 and no significant difference can be claimed, although a marginal trend may be present (see Figure 3, right panel). If confirmed, this marginal trend may indicate a larger amount of cold dust contained in debris disks around single stars. This would be consistent with the notion that the presence of cold dust away from the central star may be restricted by the companion in binary stars. This analysis highlights the need for data on binaries with fluxes at λ > 100 µm.
For Dmin, medians were 9 and 12 µm for single and binary stars with a probability 0.06 of both distributions being drawn from the same sample. For Dmax, medians were 300 and 265 µm, respectively. The K-S test probability is 0.9. No significant difference in grain sizes for the disks in single and binary stars was found from our SEDs modeling. A more detailed and specific mid-IR spectroscopic study could shed some light on this aspect. The shape and features present in the spectra are reliable tracers of the size, structure and chemical composition of the dust grains (for example, the case of β Pictoris, Li et al. 2012).
Several authors have compared the characteristics of disks in single stars with those in binary systems that can be classified as tight (Abin < 1 AU) and wide (Abin > 100 AU) (see, for example, Rodriguez & Zuckerman 2012; Eiroa et al. 2013; Thureau et al. 2014; Rodriguez et al. 2015). These studies suggest that there are no significant differences in the major characteristics of the debris disks around single stars when compared to the disks in tight and wide binary systems. The results presented in this work also show similar trends. However, all works analyzing samples of debris disks in binary stars lack systems with intermediate separation (Abin ≈ 100 AU). In our case, this is clearly due to our selection criteria, but this is not the case in the works cited above. Interestingly, Trilling et al. (2007) suggest that the lack of binaries with intermediate separations among those with debris disks is due to the fact that the dust detected in the Spitzer bands (at 24 and 70 µm, with T ≈ 50-150 K), probably lies in an unstable zone.
4. Summary and conclusions
We compiled from the literature a sample of 25 single and 14 binary stars with debris disks. The selected objects were restricted to those with flux measurements available at λ > 100 µm, and ages > 100 Myr. Previous studies focused on the frequency of disks in single and binary stars (see, for example, Thureau et al. 2014; Rodriguez et al. 2015), although they were not restricted by the availability of sub-mm fluxes. In this contribution, we analyzed smaller samples, but included fluxes in this spectral range to derive individual disk parameters in a comprehensive manner. We constructed and modeled the observed SEDs using a continuum radiative transfer code from Wolf & Hillenbrand (2003). As a result of the SED modeling we obtained the radii (ain , aout), the mass of dust (Mdust) and particle size (Dmin, Dmax) of the disks in our samples.
We compared the characteristics of the disks in both samples. Our analysis showed no significant differences in the inner and outer radii and therefore, in the extension of the disks of the single and binary stars studied in this paper. Both samples of disks were depleted of dust inside 3 - 5 AU and the disks seemed to extend beyond 100 AU, though the median value of outer disk radii in single stars was higher than that of disks in binary systems. The dust masses and emission excesses at λ = 850 µm were comparable for the debris disks in single and binary stars. Our comparison showed that the size of the dust that populates the debris disks in single and binary systems is similar. However, a more careful and detailed spectroscopy study would be needed to better address this issue.
Although the analyzed samples of single and binary stars are modest, our modeling provides radii, masses, and dust size estimates for 39 debris disks around FGK type stars using very well sampled SEDs, particularly at long wavelengths. To further improve the analysis of this paper and to confirm the trends found here it is essential to increase the number of observations of stars with debris disk, particularly in the submillimeter range, and for binary stars. In that sense, instruments such as ALMA will allow a great progress in the coming years.