


 nueva página del texto (beta)
 Inglés (pdf)
 Artículo en XML
 Referencias del artículo
 Enviar artículo por email
 Citado por SciELO
  Similares en
SciELO
Similares en
SciELO 
 Permalink
1. Introduction
The study of planetary nebulae morphology is the key to understand their formation process; using specific information for a given object, it is possible to apply a morpho-kinematical model, taking into account projecting effects and obtain physical properties such as kinematical age, that can be derived from the velocity field and the observed geometry. Morphological classification schemes for PNe started very early; the first one was developed using a sample of 78 PNe by Curtis (1918). The first schemes were based only on nebular shapes, later on other schemes were proposed, based on the central star position in the HR diagram, such as that by Stanghellini et al. (1993). Present works consider also projection effects to better describe the morphological features of the objects.
Aiming to improve the understanding of projec-tion effects on morphological classification, Zhang & Kwok (1998) have developed a modeling method that produces automatically, based on a set of parameters, possible scenarios for elliptical PNe. Similarly, Chong et al. (2012) have shown that multi-polar PNe are more common than previously sup-posed. They based their results on a set of simulations, varying the angles between three identical bipolar components. A diversity of morphologies were generated by projection effects and relative position of each bipolar component, so their conclusion was that the quantity of multi-polar PNe had been underestimated.
The origin of multi-polar structures in planetary nebulae is, in general, associated to binarity of the central star, as described by Soker & Livio (1994). In this scenario the object is constituted by a close binary system whose members share a common envelope, and the mass ejections occur preferentially in the orbital plane. In view of this effect, densities in the orbital plane and at the poles are different, and when the hot core is exposed, a fast and diluted wind interacting with the medium shapes the nebula.
The multi-polar structure can be explained by multiple ejection episodes, with different axes of symmetry; in planetary nebulae this kind of ejection is described by a mechanism known as bipolar rotating episodic jets (BRET) that consist of a collimated flow that could produce shock-excited regions (Guerrero et al. 2013). These regions are associated to the front of the outflow, which in turn is episodic; observations of these phenomena suggest that there exists precession or rotation in the jet (Lopez et al. 1995).
There is, however, an alternative to explain a multi-polar structure without the BRET mechanism. Steffen et al. (2013) performed a numerical simulation aiming to create a multi-polar structure in a PN without BRET; their work showed the possibility of forming this kind of structure by the interaction of expanding shells, each one with a different density, with the outer shell containing a filamentary distribution of mass. Bipolar and starfish PNe are well reproduced using this technique, but it is important to point out that these two scenarios can coexist. The latter is more suitable to explain not well collimated structures, complementing the BRET hypothesis.
NGC 2440, a multi-polar object with at least two bipolar components, is a well known planetary nebula. López et al. (1998) described in great detail its main structure and some of the substructures. There are clearly two bipolar structures; the largest one has a position angle (PA) of 85 degrees, and the smallest a position angle of 35 degrees, so that they are tilted 50 degrees apart. A third bipolar component was also suggested but, due the lack of observational evidence, its existence remains speculative; this younger bipolar component would have a PA of 60 degrees, an inclination based on the position of two central knots, and would be tilted with respect to the other bipolar components.
An important feature of NGC 2440 is the molecular emission, in particular, that of the bipolar component with PA of 35 degrees. This emission, measured in CO J=3-2, coincides with the optical component, and the maximum line fluxes are associated to the knots at the extremity of the bipolar component, as described by Wang et al. (2008), who measured molecular outflows with different velocities. In the core region, the presence of fast CO components points to the destruction of a neutral and dense torus by the outflow at the moment of the formation of the lobes.
The central region is complex and rich in microstructures. An image analysis displays the core sur-rounded by a toroidal configuration, associated to many radial filaments (López et al. 1998), a description that agrees well with the results of Richer et al. (1991), that suggest the presence of dense and small clumps surrounded by an optically thinner medium.
The SHAPE modeling tool (Steffen et al. 2011) allows the reconstruction of the 3D structure of a planetary nebula in great detail, taking into account projection effects, and using high angular resolution images such as those from the Hubble Space Telescope (HST), and high resolution spectra. This kind of modeling has shown results in good agreement with observational data, revealing important morpho-kinematic features for many objects such as those described by García-Díaz et al. (2012), Steffen et al. (2014) and Rubio et al. (2015), among others.
The goal of the present work is to present the first model based on SHAPE for NGC 2440. This model attempts to reproduce the overall 3D structure of the nebula, improving current models for this object. In § 2 the observational data used in this work are de-scribed; in § 3 the setup of the modeling tool for the simulations is discussed; in § 4 and 5 the simulation results are compared to the observational data and the morphology of the nebula is discussed, and finally, in § 6 our conclusions are drawn.
2. Observational data
The San Pedro Mártir (SPM) Kinematic Catalogue of Planetary Nebulae is a large and specialized survey of PNe, consisting of a database of high resolution long slit spectra of galactic and extragalactic PNe. The instruments used to get the data were the Anglo-Australian 3.9m and San Pedro Mártir 2.1m telescopes. Details of the survey are described by López et al. (2012) and the data are available on-line1. This database is an excellent source in view of the high uniformity of the data, as well as its high instrumental sensibility.
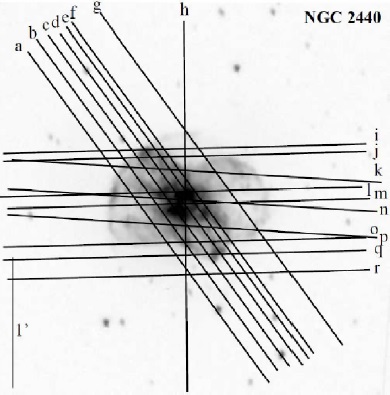
To construct the P-V diagrams for NGC 2440, each frame was corrected by the systemic velocity, adopting the value of 65 km/s from López et al. (1998). Figure 1 shows the slit positions for NGC 2440 available in the SPM catalogue.
3. Modeling the 3d structure
The aim of the 3D morpho-kinematic model is to describe the structure of NGC 2440, taking into account the projection effects, and therefore improving previous results such as those by López et al. (1998), verifying the orientation angles, as well as describing in more detail the central region.
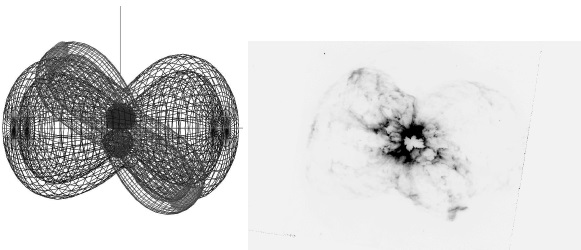
The SHAPE modeling tool allows to build a model, based on a mesh model inside a 3D environment, in order to analyse the morphology and kinematics of PNe taking into account projection effects. The structure is build manually, an approach similar to that used in graphical computation softwares, as described by Steffen et al. (2011). The construction of the structure is based on the interpretation of observational data: high resolution long slit spectra, and high angular resolution images. Note that SHAPE does not calculate the radiative transfer equation for the problem. The geometry of NGC 2440 was established based on [NII] HST images. Figure 2 displays the HST image and the mesh model used in this work for comparison purposes.
The model is evaluated by comparing the observational data directly with the SHAPE output, which consists of two rendered images, one simulating the photometric image of nebula and the other simulating the P-V diagram derived from a long slit spectrum. The aim of our work was to reproduce the P-V diagrams from [NII] lines, the spectral range for which we have the best sampling. SHAPE also provides tasks that simulate the observational conditions, such as seeing and instrumental setup.
SHAPE modeling requires a mesh model and a set of physical parameters such as velocity fields and densities distributions, derived from the observational data. In general, the larger the database, the better the model, bacause of the increase of the number of independent constraints.
An important aspect of the present model is that it considers the nebula as formed by symmetrical structures. The reproduction of small asymmetries like cavities, filaments and small knots that can be seen in the optical images is out of the scope of this paper. The high angular resolution images required for the modeling of NGC 2440 were selected from the HST Wide Field Planetary Camera (WFPC2) archive, available in different filters2. It is important to emphasize that the HST images, in particular those acquired using filter F658N, were used only as reference for the construction of the mesh model. The reproduction of the photometric images in all their details, including the complex filamentary structures existing in this nebula, is not the goal of the present work, since our model mainly aims to describe the P-V diagrams.
The two bipolar components were considered to be symmetric and each position angle was adjusted in order to reproduce the reference image. Besides these two main components, five other features were also reproduced: two knots, clearly visible at the edges of the smaller bipolar component at PA 35 degrees, as already shown by López et al. (1998), and the central region subdivided in three, non aligned, torus pieces.
The choice of the velocity field was an important step of the modeling process since the shape of the P-V diagram will be affected by this parameter, and it should reproduce the observed data, in combination with the geometry, taking also into account the projection effect.
The adopted velocity fields were linear, increasing with the distance to the core. Table 1 shows the list of parameters of each velocity field used for the different components, and the expression for the velocity field is shown in xequation 1, where R is the distance to the center, Ro is the scale factor (in general, the size of structure) and K is a constant. It should be emphasized that for the knots Ro is the distance to the center, not the size of the structure.
Table 1 Model velocity field parameters.
| Component | k(km · s−1 ) | ro (arcsec) |
|---|---|---|
| lobe 85 | 184 | 34.0 |
| lobe 35 | 160 | 30.1 |
| knot N | 80 | 29.4 |
| knot S | 84 | 30.8 |
| torus piece I | 53 | 10.5 |
| torus piece II | 44 | 7.8 |
| torus piece III | 52 | 9.1 |
We chose a linear field, which implies a ballistic outflow assumption, based not only in its simplicity but also on previous work (Akras & Steffen 2012, Huckvale et al. 2013, Clyne et al. 2015 and Akras et al. 2016), that uses the same approach. Steffen et al. (2014) use a non-linear velocity field to describe part of their target object (the Homunculus nebula in Eta Carinae), but in this case the field is almost linear and the aim is to describe in great detail the deviations from linear fields. Schönberner et al. (2014) conclude that the velocity fields are almost never linear, but in their specific case the expansion law is a consequence of hydrodynamical codes, which consider the time dependence of velocities. Therefore the present work adopts, as a first approximation, a linear velocity field, in agreement with those observed for the expansion law in bipolar PNe, as described by Corradi (2004) and Szyszka et al. (2011).
Different density distributions were selected for each component in order to reproduce line contrasts in the P-V diagrams. As mentioned before, equation 1 below represents the expansion law.
4. Results
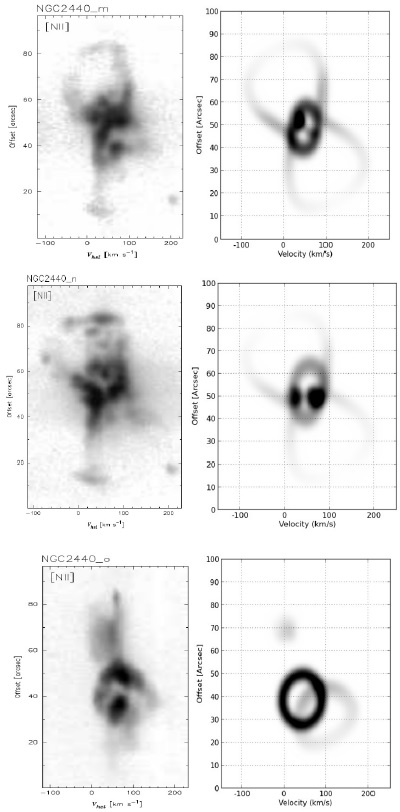
Figures 3 to 8 show the kinematical profiles for different slit positions for the [NII] line displayed in Figure 1. In each figure the observed P-V diagram (left) is compared to the simulated one (right); the horizontal axis represents the heliocentric velocity. Since SHAPE produces a model in the reference frame of the PN, the horizontal axis represents the expansion velocity corrected by the proper motion, such that both observational and simulated data are on the same reference frame.
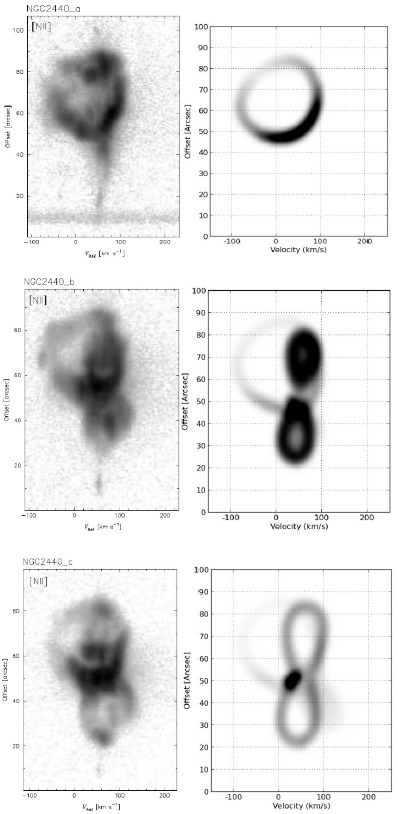
Fig. 3 P-V diagrams for slit positions a, b, c for NGC 2440. Left panel: observed profiles (from the SPM survey): Right panel: model outputs. For the observed diagrams, values on the horizontal axis represent the heliocentric velocity.

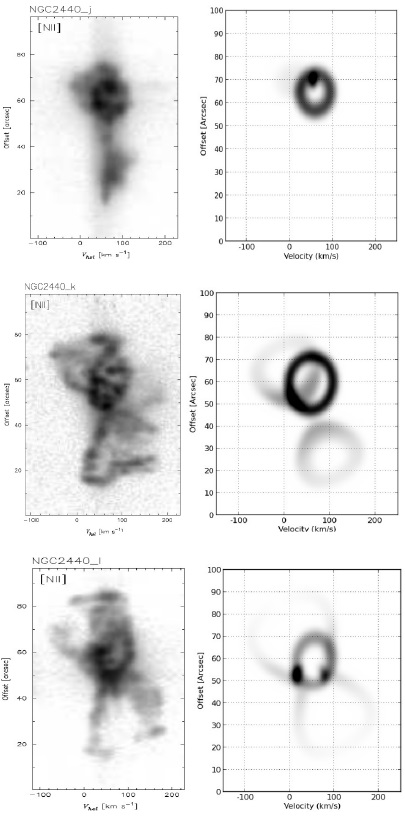

Comparing the results of the simulations and the observed kinematical line profiles, it can be seen that the main structures of NGC 2440 were reproduced, in a good agreement with the observational data. Optimization and choice of the best model were made by comparing the results and the observational data.
We found inclinations of the symmetry axes of the bipolar lobes with respect to the plane of the sky, respectively of 27 ± 5 and −5 ± 3 degrees for the lobes at PA 85 and PA 35 degrees.
The observational data, in particular for slit positions “d” and “e”, suggest the presence of a toroidal structure surrounding the core of the planetary nebula. This torus is inside the inner bipolar structure at PA 35 degrees. However, it is very hard to distinguish such a feature in the high angular resolution images from HST, as shown by López et al. (1998), as well in Figure 2, due to filaments and “secondary” morphological structures. Based on the observational data and on our model, we conclude that a toroidal structure is indeed there, and that it is strongly interacting with the environment or the radiation field. The torus is subdivided in at least three parts, as can be seen in Figure 4, the P-V diagram of slit position “d”. This scenario is suggested by the diagram since the three observed substructures cannot be explained by a simple torus, in agreement with the results derived by Wang et al. (2008).
Other small structures, such as filaments and small knots, mainly those close to the core, were disregarded in the model due the lack of a clear spectral signature in the kinematic profile and very complex and undefined borders in the HST images.
5. Discussion
5.1. Nebular Structure
The orientation angles of the bipolar components were extracted directly from the 3D model and measured with respect to the plane of sky. We found inclinations of 27 ± 5 and −5 ± 3 degrees, for bipolar components with PA of 85 and 35 degrees respectively. The presented model confirms that the bipolar lobe with PA 35 is practically in the plane of the sky. These values are different from the previous values of 40 and 0 degrees derived by López et al. (1998). This difference is probably due to the fact that previous results were derived directly from the images, and may be strongly affected by projection effects.
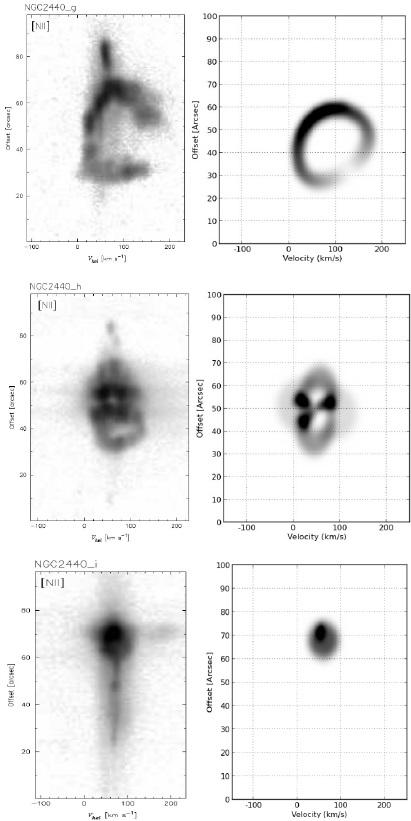
Looking at the big picture, excluding substructures like small knots and filaments, the model is able to reproduce the P-V diagrams for all the slit positions available in the SPM catalogue, as can be seen in Figures 3 to 8. All the spectral signatures of the main components are well reproduced in the simulated P-V diagrams. Slit position “h” shows, in the P-V diagram, some substructures that are not present in our results, which is probably due to the strong segmentation in the core region, rich in filaments and other structures; these could have formed by the same processes responsible for the segmentation of the toroidal structure.
Comparing simulated and observed P-V diagrams, it is possible to see that the hypothesis of the segmented torus is in agreement with the data. However, it is not possible to speculate about small segments of this torus, due to the lack of observational evidence. Therefore, substructures of the core, in this scenario, could not be linked with the torus.
The observational data show some irregularities in the structure of the bipolar components, in particular that at PA 85 degrees, as can be seen in Figure 5 for the P-V diagram at slit position “g”. In several P-V diagrams filamentary structures can be seen. However the modeled diagrams show smooth profiles, since these smaller substructures were not considered in the model.
Using the proper motion of 4.4 mas/y derived for NGC 2440 by Hajian & Terzian (1996), and already used by López et al. (1998), as well as our derived velocity field for the inner structure of the nebula, a distance of 1.8±0.5 kpc to the nebula was estimated, based on equation 1 from Akras & Steffen (2012). This value agrees with the result from Gathier et al. (1986) who derived a distance of 2.19 ± 0.39 kpc for this nebula.
5.2. The Origin of the NGC2440 Morphology
As discussed in the Introduction, there are two theoretical scenarios to explain the origin of multi-polar planetary nebulae, presented by Lopez et al. (1995) and Steffen et al. (2013). NGC 2440 shows at least two well defined bipolar components, and has other structures compatible with a BRET: (i) the torus and the relative position of the bipolar component at PA 35 to it; (ii) the possible presence of shock ionizated structures, such as two knots. Moreover, according to Soker (1997) the central star is classified as binary, and all conditions for the formation of the nebular structure by BRET exist. Concerning the knots, low ionization lines such as [OI], [NII] and [SII] are strong indicators of shocks interaction (Cuesta & Phillips 2000). The high expansion velocities of these structures support this hypothesis.
Based on previous results, mainly those of López et al. (1998), and on the observational data combined with our models, it can be said that the BRET mechanism is still the best scenario to explain the origin of multipolar nebulae such as NGC 2440. The alter-native scenario proposed by Steffen et al. (2013) is excellent to explain the formation of secondary lobes, reproducing structures such as the starfish nebulae or the bipolars with many secondary lobes. However, multipolar nebulae with some, or a high degree of symmetry, are beyond the scope of their work. Therefore, no other acceptable alternative has been proposed to explain the morphology of objects such as NGC 2440.
6. Conclusions
This work presents the first 3D model generated in a 3D environment for NGC 2440. According to our model, the orientation angles of the bipolar lobes of the nebula with respect to the line of sight are 27 ± 5 and −5 ±3 degrees, respectively for the bipolar components with PA of 85 and 35 degrees. A distance of 1.8 ± 0.5 kpc to the nebula is derived.
From our models and the observational data we conclude that a segmented toroidal structure is a good description for the inner part of NGC 2440. The model based upon this hypothesis provides a good reproduction of the observed P-V diagrams; therefore, it can be said that a torus, segmented at least in three parts, is in good agreement with the observational data. This result agrees with that of Wang et al. (2008), who detected a molecular out-flow in NGC 2440, aligned with the optical bipolar lobes.
The existence of a third bipolar lobe at a PA of 65 degrees, as suggested by López et al (1998) was not confirmed by our model, which was able to reproduce the global structure of the nebulae in a 3D simulation without invoking this additional component in order to reproduce the kinematical profile. However, we reinforce their suggestion that the BRET mechanism is the best alternative to explain the morphological origin of NGC 2440, because of its symmetry.

