


 nueva página del texto (beta)
 Inglés (pdf)
 Artículo en XML
 Referencias del artículo
 Enviar artículo por email
 Citado por SciELO
  Similares en
SciELO
Similares en
SciELO 
 Permalink
1. Introduction
The globular clusters in our Galaxy are very rich stellar clusters which present spherical symmetry and may be found in regions closer to the Galactic centre as well as in remote regions of the Galactic halo. They contain hundreds of thousands of stars within a radius 20 - 50 pc, having typical central densities between 102 and 104 stars/pc3. Globular clusters live for a long time and are dynamically very stable; they are remnants of a primordial star formation epoch and are present in all galaxies that are relatively large. They may be considered proper galactic subsystems (Ruelas-Mayorga et al. 2010).
A large number of Milky Way globular clusters have been known for a long time (see the Messier 1771 catalogue). At present we estimate their number to be approximately 150, although this figure does not include very low surface brightness objects or those close to the plane of the Galaxy, (Monella 1985, Harris 1996).
One of the reasons why globular clusters are fundamental in the study of galactic structure is the fact that they are very luminous systems and, therefore, may be observed at very large distances. In general the light that comes from these objects originates in stars slightly cooler than our Sun.
Some characteristics of globular clusters are:
Morphology. In general they are slightly elliptical in shape. The average ratio between the minor and major axes of the apparent ellipse that they project on the sky is b/a = 0.93, with only 5% of them more elongated than b/a = 0.8. Besides, they appear to be exclusively composed of stars, with no presence of gas or dust, (Binney & Merrifield 1998).
The value of their integrated absolute magnitude (MV)0 is usually found in the interval
Their intrinsic colour takes values in the interval
It is common to find clusters with metallic abundances in the interval
The study of globular clusters is important because they may be used for a variety of astronomical purposes, such as: determination of the Galactic centre position, studies of the evolution of low mass and low metallicity stars, chemical evolution of galactic systems and also as indicators of the galactic gravitational potential.
The globular cluster which we study in this paper is NGC 6093, also known as M80, and is located on the Scorpius constellation [AR(2000) : 16h 7m02.41s, DEC(2000) : -22°58'33.9"]. It contains several hundred thousands stars and it is one of the densest globular clusters in the Galaxy (Brocato et al. 1998) (see Figure 1). Its most important properties are listed in Table 1 (Harris 1996).

Fig. 1 The globular cluster NGC 6093 (M80). The image is 3' vertically (Taken from: http://hubblesite.org/news center/).
Table 1 Data for the globular cluster NGC 6093 (M80).
| Right Ascension (2000) | 16fe17m02.41s | |
| Declination (2000) | -22°58'33.9" | |
| Galactic Longitude | 352.67 | |
| Galactic Latitude | 19.46 | |
| Distance to the Sun(kpc) | 10.0 | |
| Distance to the Galactic Centre (kpc) | 3.8 | |
| Reddening E(B-V) | 0.18 | |
| Horizontal Branch Magnitude (in V) | 16.1 | |
| Distance Modulus (m - M) (in V) | 15.56 | |
| Integrated V Magnitude | 7.33 | |
| Absolute Visual Magnitude | -8.23 | |
| Integrated Colour Indices (no reddening correction) | U-B | 0.21 |
| B - V | 0.84 | |
| V - R | 0.56 | |
| V - I | 1.11 | |
| Metallicity [Fe/H] | -1.75 | |
| Integrated Spectral Type | F6 | |
| Heliocentric Radial Velocity (km/s) | 8.1 | |
| Central Concentration | 0.79 | |
| Ellipticity | 0.00 | |
| Core Radius (arcmin) | 0.15 | |
| Mean Mass Radius (arcmin) | 2.11 | |
| Tidal Radius (arcmin) | 13.28 | |
| Central Surface Brightness (in V) (magnitudes / arcsec2) | 15.11 | |
| Logarithm of the luminous density at the centre (Lʘ/pc3) | 4.79 |
This object is of interest because there are few ground-based photometric studies of its stars in the Johnson-Cousins system. Up to now the only available photometric studies have been published by: Harris & Racine (1974), Brocato et al. (1998), Alcaino et al. (1998). Rosenberg et al. (2000) have obtained V and I photometry for 52 nearby globular clusters including NGC 6093, and there are also Hubble Space Telescope (HST) observations of this cluster (see Ferraro et al. 1999a, and Piotto et al. 2002).
In addition, it has a large number of blue stragglers in its nucleus (see Ferraro et al. 1999b). As is well known, these stars are bright and blue stars that appear close to the main sequence of the HR diagram and seem to be younger and more massive than the rest of the cluster stars. The presence of these objects has been interpreted as an indication of a rather large rate of collisions in the nucleus of this globular cluster.
It presents a horizontal branch of very hot stars (blue tail), which extends over a large interval of effective temperature. It has been conjectured that there exists a correlation between stellar populations of this sort and the high density of some globular clusters (Buonanno et al. 1985).
In this paper we intend to determine, from our photometric data, the metallicity [Fe/H], the reddening E(B - V), E(V - I) and the distance to NGC 6093.
In § 2 we present the observations and the reduction process; § 3 presents the colour-magnitude diagrams which were derived for several combinations of filters; § 4 presents the analysis used to calculate the metallicity, the reddening and the distance modulus of this cluster; finally § 5 presents our conclusions.
2. The observations
We obtained the observations at the Observatorio Astronómico Nacional in San Pedro Mártir (OAN-SPM), Baja California during 2006, March 20-23 and 2007, March 14.
We utilised two different CCD cameras attached to the 1.5 m telescope. The characteristics of these detectors are presented in Table 2.
Table 2 Characteristics of the detectors used in the observations.
| Characteristic | Thomson | Sitel |
|---|---|---|
| Size (pixels) | 2048 × 2048 | 2014 × 1024 |
| Pixel Size (μm) | 14 × 14 | 24 × 24 |
| Quantum Efficiency | Maximum 65% at 5000 Å | |
| Reading noise (e-) (gain mode 4 binning 2x2) | 5.3 | 5.5 (Direct Imaging) |
| Dark Current (e- /ix/h) | 1.0 a - 95.2C | 7.2 approximately at -80C |
| Well Depth (e-) | 1.23 × 10⁵ (MPP Mode) | |
| Bias Level (gain mode 4 binning 2x2) | 384 | 547 (Direct Imaging) |
| Gain (e-) (Mode 4) | 0.51 | 1.27 |
| A/D Converter | 16 bits | |
| Linearity | 99% | 99.5% |
| Plate Scale ("/pixel) | 0.147 | 0.252 |
As stated above, the observations were collected in two observing runs, during which we observed in a standard way, obtaining bias and flat field frames in each filter; we also obtained multiple observations of four standard stars regions; namely Rubin 149, 152, and PG 1323 and 1525, and 10 frames per filter (B, V, R, I) of the central region of NGC 6093. We present in Table 3 an example of a log for the night March 20-21, 2006 to show the sequence followed during the observations.
Table 3 Log of observations for March 20-21, 2006.
| NUMBER OF FRAMES | UNIVERSAL TIME | OBJECT | TYPE | AIR MASS | EXPOSURE TIME PER FRAME (S) | FILTER |
|---|---|---|---|---|---|---|
| 10 | 11:24:52-11:28:46 | PG1528 | Standard Star | 1.10 | 10 | B |
| 10 | 11:34:35-11:41:30 | PG1528 | Standard Star | 1.11 | 30 | R |
| 10 | 11:44:20-11:51:15 | PG1528 | Standard Star | 1.11 | 30 | I |
| 10 | 11:55:18-12:02:12 | PG1528 | Standard Star | 1.12 | 30 | V |
| 10 | 12:21:01-12:25:41 | NGC 6093 | Globular Cluster | 1.71 | 15 | I |
| 10 | 12:31:40-12:36:20 | NGC 6093 | Globular Cluster | 1.72 | 15 | R |
| 10 | 12:50:45-13:02:10 | NGC 6093 | Globular Cluster | 1.75 | 60 | V |
| 10 | 13:16:15-13:28:45 | NGC 6093 | Globular Cluster | 1.78 | 60 | B |
The observed frames for the standard stars in the 2006 observing season were not reliable because the filter wheel suffered an unspecified slippage during the observations, and it became impossible for us to identify the observed standard frames with a definite filter; moreover, in some occasions the filter wheel may have been stuck half way, so the observations of the standard stars may have suffered from severe vignetting. This problem was corrected before we obtained the observations for the globular cluster.
The reduction of the data was done in a standard way, that is, removing dead and hot pixels produced by cosmic rays, performing bias subtraction, and flat field correction. This reduction process was achieved using the general purpose software: Image Reduction and Analysis Facility (IRAF). Once the fields had been bias and flat-field corrected we proceeded to utilise the routine DAOPHOT to obtain the photometry of the many starts present in the field using the Point Spread Function (PSF) technique (Stetson, 1992). As an example of an image on which we applied the DAOPHOT technique see Figure 2.
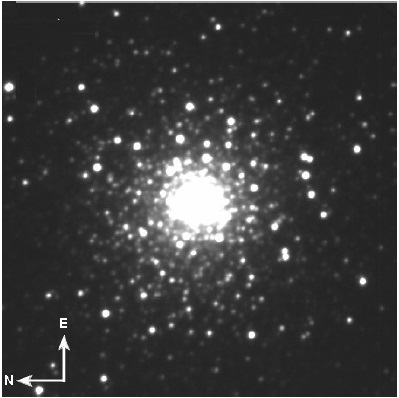
Fig. 2 Image of the central zone of the globular cluster NGC 6093 in the V filter after the process of preparation.
2.1. Reduction to the Standard System
In order to express the magnitude of the stars in the globular cluster in a standard system, we performed aperture photometry of stars in four Landolt standard regions (Landolt, 1992), namely; Rubin 149, 152, and PG 1323 and 1525. This photometry was carried out using the IDL data reduction programme: ATV.pro, and measuring the brightness of each star in 10 or fewer apertures of different size. The number of counts measured in each ring was corrected for background brightness, which was measured in an empty sky-region near the standard star. During the measuring process, ATV.pro defines two regions, a central circular region and an external annular region which is used to measure the background intensity. One has to be careful that in this external annulus there are no stars at all, otherwise this sky measurement is useless. These corrected measurements were fitted to a curve of growth expressed by:
in which y represents the number of counts at a distance x from the centre of the star, and D is a characteristic separation from the centre. A is the asymptotic value which y obtains when x tends to infinity, and which is the value adopted for the number of counts for the measured star in question.
The reduction of the standard stars in the Landolt Regions permitted us to establish that the process of atmospheric extinction not only depends on the value of the airmass (X) but it also presents a slight variation with the intrinsic colour of the different stars used in the process. We, therefore, proposed a set of transformation equations from the observed to the intrinsic values of the magnitudes in the standard system of the following form:
The values of the constants A, K and C for each filter are found by a least-squares process, which consists in using the observed magnitude for the standard stars and their intrinsic values from the Landolt catalogue in the transformation equations. A least squares fit produces the values for constants A, K and C for each filter.
The values of the intrinsic magnitudes for the stars in the globular cluster are calculated from the equations that result when solving simultaneously for Bint and Vint from equations (2) and (3) and for Rint and Iint from equations (4) and (5). The easiest way to solve equations (2) and (3), and (4) and (5) simultaneously is to find the values of (B - V)int and (R - I)int by subtracting from equation (2) equation (3) and subtracting from equation (4) equation (5).
The resulting solutions for the intrinsic colours look as follows:
By substitution of the values of the intrinsic colours in equations (2), (3), (4) and (5), the values of the intrinsic magnitudes are then easily found.
The values for the constants A, K, and C for all the filters, and their errors, are shown in Table 4.
Table 4 Fit coefficients for each filter.
| Filter | A | K | C |
|---|---|---|---|
| B | -0.22 ± 0.01 | 0.14 ± 0.01 | 24.40 ± 0.05 |
| V | -0.09 ± 0.01 | 0.02 ± 0.01 | 24.60 ± 0.05 |
| R | -0.03 ± 0.02 | 0.12 ± 0.02 | 24.63 ± 0.05 |
| I | -0.14 ± 0.02 | 0.27 ± 0.02 | 24.35 ± 0.10 |
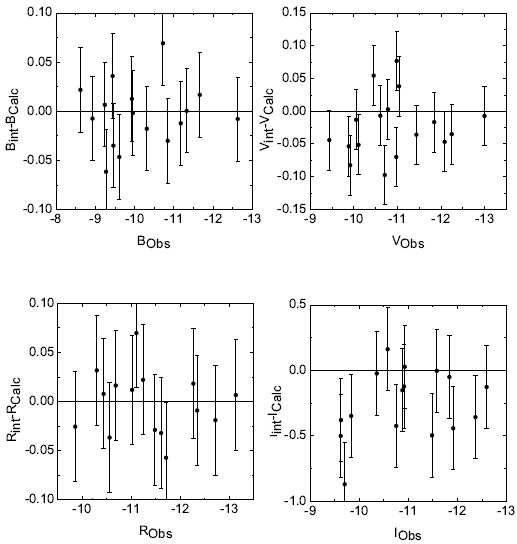
In Figure 3 we present the typical residuals obtained for standard stars to equations (2), (3), (4) and (5) using the coefficients in Table 4. The standards used were PG1323 stars 0, A to C, Rubin 149 stars 0, A to F and Rubin 152 stars 0, A to C and E and F. Region PC 1525 was not used, because it had very large residuals.
2.2. Photometry of the Cluster Stars
The calculation of the different observed magnitudes of the stars in the cluster NGC 6093 was obtained by a standard application of the DAOPHOT subroutine present in IRAF to all the observed frames in each filter, after having the frames bias-subtracted and flat-fielded.
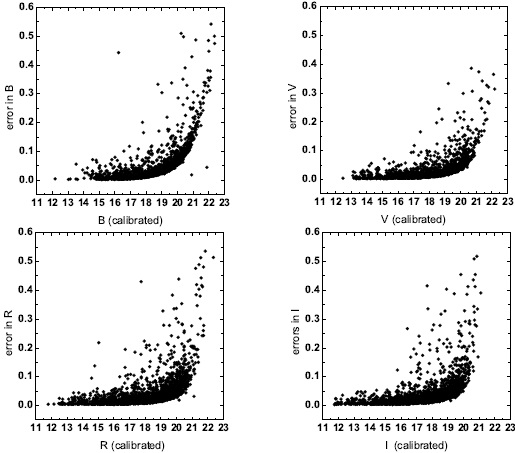
The magnitude catalogues produced by the subroutine ALLSTAR for the 2007 observations were combined to obtain the observed (B - V)obs and (R-I)obs colours for the stars in the globular cluster, so that the application of equations (2), (3), (4) and (5) could proceed in a straightforward manner. In Figure 4 we present the errors of the measured magnitudes as functions of the calibrated magnitudes. As expected, the errors increase as the magnitudes become fainter.
As mentioned before (see § 2) the observations of the standard stars in the 2006 observing run were not reliable, so, in order to calibrate these observations we identified stars common to the 2006 and 2007 observing runs in each filter. Then we took the value of the observed magnitude in the 2006 run, mobs, and the intrinsic value of the magnitude from the 2007 run, mint, and we constructed a relation of the following form:
Calculation of the constants A and b allows the calculation of the intrinsic magnitudes of the stars present in the 2006 frames for all the filters.
The values of the transformation coefficients for each filter are given in Table 5 and the fits to the common stars in each filter are shown in Figure 5.
Table 5 Transformation coefficients.*
| A | b | |
|---|---|---|
| B | 1.015 ±0.014 | -3.265 ±0.258 |
| V | 1.040 ±0.019 | -3.073 ±0.316 |
| R | 0.967 ±0.013 | -4.107 ±0.232 |
| I | 0.975 ±0.006 | -3.702 ±0.111 |
*Between observing runs in 2006 and 2007.

3. Colour-magnitude diagram
Once the stars in all the images are translated to a common reference frame, their calculated intrinsic magnitudes may be used to obtain their intrinsic B - V, R - I and V - I colours. A number of colour-magnitude diagrams are thus produced and are shown in Figure 6.
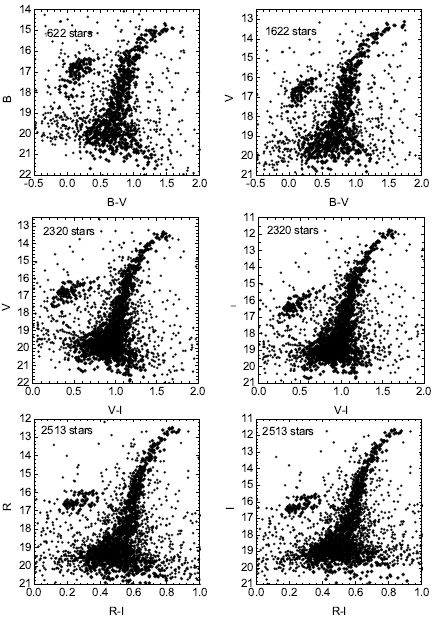
In all the CMDs it is clear that the magnitude limit of the present observations is around 20 mag, where the photometric errors begin to be very large and the measures are spread. This prevents us to see a clear sub-giant branch and, of course, the turn-off (TO) point. An estimation from the CMD by Brocato et al. (1998) and Rosenberg et al. (2000) leads to a TO magnitude level around 19.6 mag. The TO U-magnitude estimated in Alcaino et al. (1998) is brighter (19.16 ± 0.05 mag). It is also clear that the presence of the giant branch (GB) and the horizontal branch (HB), and the top of the main sequence may be guessed at the fainter magnitudes presented (≈ +20 for all magnitudes).
4. Analysis
In this section we derive values for the metallicity ([Fe/H]), the reddening (E(B-V), E(V-I) and the distance modulus ((m - M)0) of the globular cluster NGC 6093.
4.1. Fiducial Line
The first step in this analysis is to distinguish between those stars that belong to the cluster and those that are field stars, which found their way into the colour-magnitude diagrams just because they overlap the cluster's field in the sky. In order to achieve this, we obtain the colour distribution of the stars in a given colour-magnitude diagram at a fixed magnitude level (Mfid), and find the value of the colour (CIfid) at which the number of objects in that bin is maximum. This procedure produces the coordinates of a point on the colour-magnitude diagram (CIfid, Mfid) and the value of the standard deviation (a) of the colour distribution at that magnitude level. Repeating this process over the entire range of magnitudes covered by the colour-magnitude diagram produces a set of points which, when joined, give a smooth curve which is known in the literature as the fiducial line. The fiducial line defines the geometric locus where the main sequence and the giant branch of a cluster are located on the colour-magnitude diagram. In this paper we shall assume that a star that is farther than l.ba from the fiducial line at its corresponding magnitude level does not belong to the cluster. In Figure 7 we see the fiducial line obtained in this work (full circles) compared with that obtained by Brocato et al. (1998) (crosses).

Fig. 7 Fiducial lines obtained in this work (full circles) and that of Brocato et al. (1998) (crosses). The level of the HB and its colour extent is shown in this figure.
The subsequent analyses that we shall present in subsections 4.2, and 4.3 are carried out using only those stars that belong to the cluster according to the criterion established above. For the analysis presented in Subsection 4.2, we used the V vs B - V and the V vsV - I colour-magnitude diagrams. The stars that appear in red in Figure 8 are those that have a large probability of not being cluster member according to the criterion presented above.

4.2. Metallicity and Reddening
Metallicity and reddening for a globular cluster may be determined simultaneously by direct application of the method of Sarajedini (1994) and Sarajedini & Layden (1997), which takes into consideration the shape of the red giant branch (RGB), the observed magnitude (VHB) of the horizontal branch (HB), the intrinsic (B - V) colour of the RGB at the level of the HB (this value will be denoted herein as (B - V)0,g) and the difference in observed V magnitude between the HB and the RGB at (B - V)int = 1.2 denoted by ΔV1.2 = VHB obs - Vrgb Obs at 1.2 int, whereVrgb Obs at 1.2 int means the observed V magnitude of the RGB at an intrinsic (B - V) colour equal to 1.2. ΔV1.2 results in an essentially positive quantity.
The Sarajedini relations in the B vs B - V plane
are:
And
If (B - V)g is the observed colour of the RGB at the level of the HB, then E(B - V) = (B - V)g - (B - V)0,g. We can, therefore, rewrite (9) as:
Now, we fit a second degree polynomial to the points of the RGB on the observed V vs (B - V) plane. The equation chosen for the second degree polynomial is as follows:
Equation (12) is a general fit to the observed points of the RGB. We shall now apply this equation to a particular point, that for which the intrinsic (B - V) colour is equal to 1.2. At this point we may write the following two equations (13 and 14):
where B - V represents the observed colour of the RGB which, when dereddened, will take an intrinsic value of 1.2, V is the intrinsic value of the average magnitude of the HB and VHB is the observed average magnitude value of the HB.
Then, substituting (13) and (14) in (12) we get:
Where
Substituting expression (15) in (11), we finally obtain that
Being
Therefore, knowing the values VHB,(B - V)g and the coefficients ai from the fit to the RGB, it is possible to solve equations (19) for the metallicity [Fe/H]. The value of ΔV1.2 may be calculated from equation (10) and then the colour excess E(B - V) from equation (15).
For the HR diagram in the V vs. (B - V) plane, the nominal values and the fit coefficients are:
Sarajedini also produced a calibration in the V vs. (V - I) space, which is:
and
and
being
defining the bi coefficients as before, but considering the new RGB. In this case:
In order to calculate E(B - V) from E(V - I) we use the relation given by Dean et al. (1978) with (B - V)0 = 1.2 :
For the globular cluster studied in this paper, the metallicity and the reddening (colour excess) obtained using this method and with both techniques are shown in Table 6. The colour excess values marked with an asterisk were obtained using Dean's relation (equation 39).
Table 6 Results.
| HR Diagram | [Fe/H] | E(B - V) | E(V - I) |
|---|---|---|---|
| V vs B - V | -1.84 ± 0.20 | 0.14 ± 0.03 | 0.19 ± 0.02* |
| V vs V - I | -1.95 ± 0.26 | 0.16 ± 0.03* | 0.22 ± 0.03 |
*Using Dean's relation equation (39).
We adopt as final values: [Fe/H] = -1.84 ±0.20. which has the smallest error, and E(B - V) = 0.15 ± 0.03, that corresponds to the mean value of the values obtained, given that the associated uncertainty is the same. Using Dean's formula we get E(V - I) = 0.20 ± 0.04. Note that these values are consistent with those found in the literature2 (See Table 7).
Table 7 Metallicity and reddening values for NGC 6093.
| Reference | [Fe/H] | E(B - V) |
|---|---|---|
| Racine (1973) | 0.17 | |
| Harris & Racine (1974) | 0.16 | |
| Bica & Pastoriza (1983) | -1.55 | |
| Zinn (1985) | -1.68 | |
| Brodie & Hanes (1986) | -1.57 | |
| Reed et al. (1988) | 0.18 | |
| Suntzeff et al. (1991) | -1.64 | |
| Brocato (1998) | -1.71 | |
| Alcaino et al (1998) | -1.7 | |
| This work (2012) | -1.84 ±0.20 | 0.15 ±0.003 |
4.3. Distance Modulus
In order to calculate the distance modulus to the globular cluster we study in this paper, we shall use the following assumption: the average absolute magnitude of its HB is equal to that of the RR-Lyrae stars. For a justification of this statement see, for example, Christy (1966), Demarque & McClure (1977) and Saio (1977).
The number of variable stars found in NGC 6093 is, according to Clement et al. (2001), equal to 8, out of which 6 are of the RR-Lyrae type, one is a Cepheid or an RV Taurus star and the other has not had its period determined, so it has not been assigned to any specific type of variable star. Four of the RR-Lyraes in this cluster pulsate in the fundamental mode, and two in the first overtone, with average periods of 0.651 and 0.366 days, respectively. The horizontal branch ratio (HBR) for this cluster is equal to 0.93 indicating that its HB is, for the most part, composed of blue stars.
It has become customary in the astronomical literature to assume, for the RR-Lyrae stars, a linear relation between absolute magnitude and metallicity of the form M = a + b[Fe/H]; the problem is then reduced to finding the value of the constants a and b. The most popular methods utilised for calibrating the values of the a and b constants are: (i) through statistical parallaxes; (ii) the BBW moving atmosphere method; and (iii) main sequence fitting (Sandage & Tammann, 2006).
In the following paragraphs we shall use different absolute magnitude-metallicity relations from the literature for RR-Lyraes which, combined with the metallicity and the apparent magnitude for the HB of NGC 6093 given in this paper, will permit us to determine the value of its distance modulus.
Tsujimoto, Miyamoto, & Yoshii (1998) have analysed data for 125 Hipparcos RR Lyraes in the metallicity range -2.49 < [Fe/H] < 0.07 using the maximum likelihood technique proposed by Smith (1988). This technique allows simultaneous correction of the Malmquist and Lutz-Keller biases, allowing a full use of negative and low-accuracy parallaxes. They derive the following relation:
Given that [Fe/H]NGC 6093 = -1.84 ± 0.20 is contained within the studied metallicity interval, applying this relation to the cluster studied in this paper produces
A compilation of statistical parallaxes of field RR-Lyrae stars has been presented by Wan, Mao, & Ji (1980) in a Catalogue of
the Shanghai Observatory. This compilation is summarised in Table 3 of Reid (1999). There is a value for
Even though the error for this determination is relatively small, the extrapolation process makes this determination less reliable than the previous one.
Using a combination of the infrared flux and the Baade-Wesselink analysis methods Fernley et al. (1989, 1990a, 1990b), and Skillen et al. (1989, 1993) studied 21 RR-Lyrae variable stars and obtained a mean relation for their absolute magnitude expressed as follows:
which for the metallicity value of our globular cluster produces a result of
McNamara (1997) has reanalysed these same 29 stars making use of more recent Kurucz model atmospheres and derives a steeper, more luminous calibration given as follows:
The RR-Lyraes studied in the McNamara paper belong to a metallicity interval from approximately -2.2 to 0.0. The metallicity value for our globular cluster (- 1.84) lies within this interval, making it reasonable to apply this relation to this cluster. The value we obtain from this relation is:
Fernley (1993) uses his near-IR Sandage Period-shift Effect (SPSE) and a theoretical pulsation relation to derive the following relation:
which applied to our cluster gives
Arellano-Ferro et al. (2008a, b) using the technique of Fourier decomposition for the light curves of RR-Lyraes in several globular clusters derive the following relation:
This relation was obtained for a set of globular clusters contained within the metallicity interval -2.2 < [Fe/H] < -1.2 making it appropriate for the metallicity value (-1.84) we find for NGC 6093 in this paper.
Applying this relation to our cluster we find
There are many different empirical and theoretical determinations of the
From the data presented in this paper we determine an apparent V magnitude for the HB of NGC 6093 of 16.64 ±0.32, which combined with the values for the absolute magnitudes of the RR-Lyrae stars and the assumption that the HB and the RR-Lyraes have the same absolute magnitude yields the distance modulus values presented in Table 8.
Table 8 Distance modulus for NGC 6093.
| Calibration |
|
|
|---|---|---|
|
| ||
| Tsujimoto, Miyamoto & Yoshii (1998) | 0.54 ± 0.52 | 15.64 ± 0.84 |
| Wan, Mao & Ji (1980) | 0.86 ± 0.10 | 15.32 ± 0.42 |
| Skillen et al. (1993) | 0.65 ±0.19 | 15.53 ± 0.51 |
| McNamara (1997) | 0.45 ±0.14 | 15.73 ± 0.46 |
| Fernley (1993) | 0.49 ±0.04 | 15.69 ± 0.36 |
| Arellano-Ferro et al. (2008a, b) | 0.52 ± 0.11 | 15.66 ± 0.43 |
A weighted average (by the inverse square of the errors) of these values results in an average distance modulus for NGC 6093 of
Benedict et al. (2002), using the HST parallax for the prototype RR-Lyrae star, determine an absolute magnitude for this star of Mv = 0.61 ± 0.10. If we assume that the HB of NGC 6093 has this value for its absolute magnitude then we obtain a distance modulus of:
which agrees, within the errors, with previous determinations. This value of the distance modulus produces a distance of
We adopt as our best determination for the NGC 6093 distance modulus the value obtained with the Fernley(1993) calibration (15.69 ± 0.36), due to the fact that this calibration presents the smallest errors.
5. Conclusions
In this paper we have presented CCD photometry of the globular cluster NGC 6093 in the filters B, V, R and I, which permitted us to produce six colour-magnitude diagrams (see § 3) containing on the average ≈ 2000 stars each. The observations were collected during two observing seasons in 2006 and 2007 as explained in § 2.
In order to eliminate fore- and background stars we produced for each colour-magnitude diagram a fiducial line and only kept those stars that lied close to this line (see § 4). Further analysis was performed only on the stars that, according to the criterion established in § 4, were truly cluster members.
Using the Sarajedini method (Sarajedini 1994: Sarajedini & Layden 1997) we calculated simultaneously the values of the metallicity and the reddening of this globular cluster. The values of the colour excess in (B - V) and in (V - I) given here correspond to the average values given in Table 6 resulting in the following figures:
These values are consistent with those found in the literature as shown in Table 7.
We determined the distance modulus to NGC 6093 assuming that the average absolute magnitude of the stars in the HB of the cluster is the same as that found for the RR-Lyrae stars. Using several metallicity-absolute magnitude relations for RR-Lyraes (see Subsection 4.3), we found, for each, a distance modulus for NGC 6093, but decided to adopt the value with the smallest error. The distance modulus value given in this paper is 15.69 ± 0.36, and corresponds to the relation given in Fernley (1993).
In a forthcoming paper we shall use these data to determine this cluster's helium abundance and age by making use of several sets of theoretical isochrones.

