


 nueva página del texto (beta)
 Inglés (pdf)
 Artículo en XML
 Referencias del artículo
 Enviar artículo por email
 Citado por SciELO
  Similares en
SciELO
Similares en
SciELO 
 Permalink
1. Introduction
It has been known for a long time that galaxy in-teractions lead to enhanced star formation (Toomre & Toomre 1972; Kennicutt et al. 1987; Barton et al. 2000; Struck 1999; Lambas et al. 2003; Alonso et al. 2004a, 2006; Nikolic et al. 2004; Woods & Geller 2007; Ellison et al. 2008; Li et al. 2008a37b; Hwang et al. 2010,2011; Scudder et at. 2012). Kennicutt et al. (1987) observed a trend for enhanced star for-mation in close pairs. Lambas et al. (2003) reported that the star formation of paired galaxies is significantly higher than that of isolated galaxies. Li et al. (2008a) demonstrated that mergers or interactions trigger enhanced star formation in galaxies. Such a conclusion is consistent with the result obtained by N-body simulations (Negroponte & White 1983; Barnes & Hernquist 1992; Mihos & Hernquist 1996; Springel 2000; Tissera et al. 2002; Meza et al. 2003; Kapferer et al. 2005; Cox et al. 2006). This work aims to explore the influence of galaxy interactions on galaxy parameters, such as age, stellar velocity dispersion and the K-band luminosity of galaxies.
Some authors used paired galaxies to explore the effect of galaxy interactions (e.g., Lambas et al. 2003; Alonso et al. 2004a) because these galaxies are defined as interacting and merging galaxies in many studies. In contrast, isolated galaxies are a group of galaxies that have experienced no major interactions in billions of years. By comparing the star formation of galaxies in pairs and in isolation, Deng et al. (2014) investigated the influence of galaxy interactions on star formation. Similarly to Deng et al. (2014), we used this method to unveil the effects of interactions on age, stellar velocity dispersion and the K-band luminosity.
This paper is organized as follows. In § 2, we describe the data used. In § 3, we investigate the influence of galaxy interactions on age, stellar velocity dispersion and the K-band luminosity. Our main results and conclusions are summarized in § 4.
In calculating the distance, we used a cosmological model with a matter density of Ω0 = 0.3, a cosmological constant of ΩΛ = 0.7, and a Hubble constant of H0=70 km·s-1· Mpc-1.
2. Data
2.1. Summary of the data
In this work, we use two volume-limited main galaxy samples (Strauss et al. 2002) from SDSS Data Release 10 (Ahn et al. 2014) constructed by Deng (2015). The luminous volume-limited main galaxy sample contains 129515 galaxies at 0.05 ≤ z ≤0.102 with −22.5 ≤ Mr ≤ −20.5. The faint volume-limited sample includes 34573 galaxies at 0.02 ≤ z ≤ 0.0436 with −20.5 ≤ Mr ≤ −18.5. The data set for the age, K-band luminosity and stellar velocity dispersion measurements was downloaded from the Stellar-MassStarformingPort table obtained with the star-forming template and the Kroupa initial mass function (IMF) (Maraston et al. 2013), and the EmissionLinesPort table, respectively.
In this work, we use the best-fit age of galaxies (in Gyr). According to the paper of Maraston et al. (2013), the age of the best-fits is the age at the onset of star formation, which corresponds to the formation age. Fitted ages are constrained to be younger than the age of the Universe in the adopted cosmology. Maraston et al. (2013) applied age cutoffs to the templates. The minimum allowed fitting age for the passive LRG model is 3 Gyr. This corresponds to the assumption that the descendants of these galaxies are 10 Gyr old at redshift zero. The age cutoff to the star forming model is 0.1 Gyr, which is typically assumed in the SED-fit of star-forming galaxies (e.g. Bolzonella et al. 2010; Maraston et al. 2010). An age cutoff of this size helps minimising the extent of fitting for too low ages.
Maraston et al. (2013) used two template fittings (passive and star-forming) and adopted two initial mass functions (IMFs) (Salpeter and Kroupa). The passive model does not include the possibility of a non-zero star formation rate (SFR). The selection of the star-forming template and the Kroupa IMF leads to the largest number of non-zero SFR galaxies. Considering that further investigation would shed light on the SFR of galaxies, we use the best-fit age of the galaxy (in Gyr) obtained with the star-forming template and the Kroupa IMF (Maraston et al. 2013). The data set of the age measurement is from the StellarMassStarFormingPort table. The K band is a standard near-infrared photometric filter. The data set of the K-band luminosity measurements stems also from this table.
To calculate the stellar velocity dispersions, Thomas et al. (2013) used the publicly available codes pPXF (Cappellari & Emsellem 2004) and GANDALF v1.5 (Sarzi et al. 2006) and adopted the new stellar population models from Maraston & Strömbäck (2011) based on the MILES stellar library (Sánchez-Blázquez et al. 2006). To calibrate the procedure, they applied the same technique to derive the stellar velocity dispersions for a subset of SDSS galaxies from Data Release 7 (Abazajian et al. 2009) and found good agreement with the values obtained in DR7. The velocity dispersions are in good agreement, with a small median offset in σ of 2 km s-1 at a dispersion of 30 km s-1. Thomas et al. (2013) demonstrated that the typical signal-to-noise ratio of the BOSS spectra is sufficient to measure the stellar velocity dispersion and verified the reliability of the velocity dispersion measurements on individual BOSS spectra through comparison with high signal-to-noise spectra from repeat-plate observations in BOSS. The data set of the velocity dispersion measurements stems from the EmissionLinesPort table.
2.2. Galaxy pairs
There are several criteria to identify galaxy pairs (e.g., Karachentsev 1972; Barton et al. 2000; Lambas et al. 2003; Patton et al. 2005; Focardi et al. 2006; Kewley et al. 2006; Deng et al. 2008). Lambas et al. (2003) selected galaxy pairs in the field by radial velocity (ΔV ≤ 350 km/s) and projected separation (rp ≤ 100 kpc) criteria. Some studies demonstrated that rp ≤ 100 kpc and ΔV ≤ 350 km/s can be defined as reliable upper limits for the relative radial velocity and projected distance criteria to select galaxy pairs with stronger specific star formation than the average galaxies (Lambas et al. 2003; Alonso et al. 2004b, 2006, 2007). By applying these selection criteria, we identify 1862 pairs in the luminous volume-limited sample and 1146 pairs in the faint volume-limited sample.
2.3. Isolated galaxies
Isolated galaxies have long been an important subject (e.g., Karachentseva 1973; Adams et al.
1980; Haynes et al. 1984;
Koopmann & Kenney 1998; Colbert et al. 2001; Pisano & Wilcots 2003; Reda et al. 2004; Stocke et al.
2004; Verdes-Montenegro et al.
2005; Sulentic et al. 2006;
Karachentsev et al. 2006; Lisenfeld et al. 2007; Verley et al. 2007a, 2007b;
Deng et al. 2006, 2009). Deng
et al.(2006) used three-dimensional cluster analysis (Einasto et al. 1984) for the identification
of isolated galaxies and demonstrated that isolated galaxies identified at a
dimensionless radius of r ≥ 1.2 ( dimensionless radii
r = R/R1, R is
three-dimensional radius;
3. Results
Figures 1 and 2 show the age, stellar velocity dispersion and K-band luminosity distributions of paired and isolated galaxies for the faint and luminous volume-limited main galaxy samples, respectively. We also performed the Kolmogorov-Smirnov (KS) test. The probability of the two distributions coming from the same parent distribution is listed in the right upper corner of each figure, which is in good agreement with results obtained by the step figures.
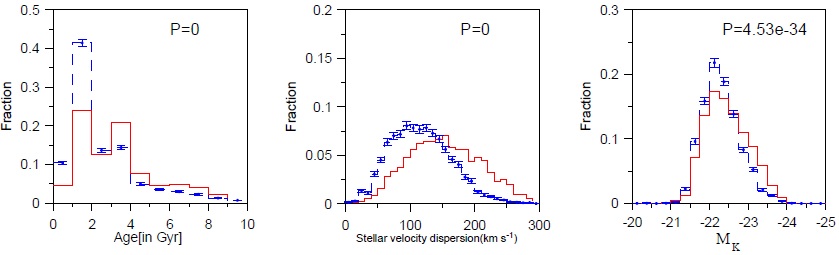
Fig. 1 Age (left panel), stellar velocity dispersion (middle panel) and K-band luminosity (right panel) distributions of paired galaxies and isolated galaxies for the luminous volume-limited main galaxy sample: red solid line for paired galaxies, blue dashed line for isolated galaxies. The error bars of the blue lines are 1 σ Poissonian errors. The error-bars of the red lines are omitted for clarity. The color figure can be viewed online.
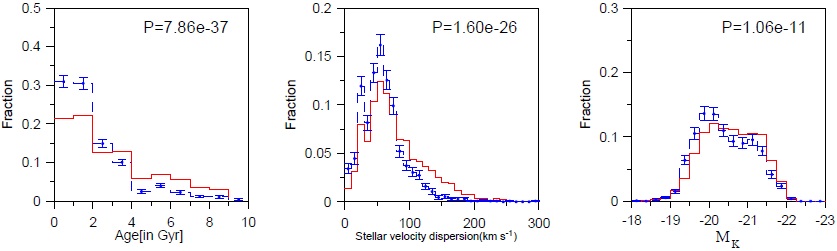
Fig. 2 Same as Figure 1, but for the faint volume-limited main galaxy sample. The color figure can be viewed online.
There have been several studies that focus on the influence of galaxy interactions on galaxy parameters. Karachentseva et al. (1974) demonstrated that “early” Hubble types (E, S0, Sa) occur more often in galaxy pairs; “late” types (Sc, Sd) occur more often among isolated galaxies. Deng et al. (2008) also found that the early-type fraction of paired galaxies is far higher than that of isolated galaxies, which supports the hypothesis that interactions are the major morphological driver. Patton et al. (2005) reported that although paired and isolated galaxies have identical distributions of bulge fractions, paired galaxies are much more likely to be asymmetric than isolated galaxies. Similarly, Hernández-Toledo et al. (2006) found significant differences of the asymmetry index between isolated and interacting E/S0s. Moreover, galaxy interactions also lead to enhanced star formation (Toomre & Toomre 1972; Negroponte & White 1983; Barnes & Hernquist 1992; Mihos & Hernquist 1996; Struck 1999; Springel 2000; Tissera et al. 2002; Lambas et al. 2003; Meza et al. 2003; Nikolic et al. 2004; Kapferer et al. 2005; Cox et al. 2006; Woods & Geller 2007; Li et al. 2008a-b). These studies showed that the interactions may also play a role in determining the galaxy properties. Here, as shown by Figures 1 and 2, paired galaxies have preferentially larger stellar velocity dispersions and are preferentially older than isolated galaxies. We also note apparent differences in the K-band luminosity distribution between paired galaxies and isolated galaxies in the luminous volume-limited main galaxy sample: paired galaxies are preferentially more luminous than isolated galaxies, whereas this difference in the faint volume-limited main galaxy sample is very small.
In two volume-limited main galaxy samples, Wu & Deng (2016) compared the age, stellar velocity dispersion and K-band luminosity distributions of grouped galaxies with those of isolated galaxies and found the same statistical difference between grouped galaxies and isolated galaxies as between paired galaxies and isolated galaxies(see Figures 1-2 of Wu & Deng 2016). Wu & Deng (2016) applied the FoF algorithm developed by Berlind et al. (2006) and extracted groups with richness N ≥ 4 (N is the number of member galaxies in each system). Pairs can also serve as galaxy systems with richness N = 2. The above-mentioned results show that galaxy systems with various richness exhibit similar statistical differences compared with isolated galaxies.
4. Summary
From two volume-limited main galaxy samples of the SDSS Data Release 10 (Ahn et al. 2014) constructed by Deng (2015), we extracted paired galaxies and isolated galaxies and performed comparative studies between them to explore the influence of galaxy interactions on the age, stellar velocity dispersion and K-band luminosity. Paired galaxies have preferentially larger stellar velocity dispersions and are preferentially older than isolated galaxies. We also note apparent differences in the K-band luminosity distribution between paired galaxies and isolated galaxies in the luminous volume-limited main galaxy sample: paired galaxies are preferentially more luminous than isolated galaxies, whereas this difference in the faint volume-limited main galaxy sample is very small.

