


 nueva página del texto (beta)
 Inglés (pdf)
 Artículo en XML
 Referencias del artículo
 Enviar artículo por email
 Citado por SciELO
  Similares en
SciELO
Similares en
SciELO 
 Permalink
1. INTRODUCTION
A hot Jupiter is any of the numerous extrasolar planets that is as big and gaseous as Jupiter, but much hotter due to its close orbit around its parent star (Seager 2010). Hot Jupiter planets experi ence strong irradiation from their parent stars and are expected to be tidally locked due to their very close proximity (< 0.05 AU) to their host star, resulting in permanent day-and night-sides (Knutson et al. 2007). The consequences of such small orbital separations are atmospheric structures and spectra that are very different from those of the giant planets in the Solar system (Barman et al. 2005).
In the literature, there are several models of the spectra and light curves of hot Jupiters. The ma jority of these models stem from one-dimensional (1D) codes. Burrows et al. (2006), for instance, investigated the spectra and light curves of planets with various day-night effective temperature differences, assuming 1D profiles for each hemisphere. Iro et al. (2005) extended 1D models by adding heat transport due to a simple parameterization of winds to generate longitude-dependent temperature maps, but they did not compute disk-averaged spectra for these models. Barman et al.(2005) investigated two-dimensional (2D) models with axial symmetry around the planet's substellar-antistellar axis and computed infrared spectra as a. function of orbital phase. These 1D and 2D radiative-convective equilibrium models have had some success in matching Spitzer observations; however, Seager et al. (2005) and Deming et al. (2006) showed that ground-based data for HD209458b do not indicate prominent flux peaks at 2.3 and 3.8 μm. which the 1D and 2D solar composition models predicted. Dobbs-Dixon & Agol (2013) presented 3D radiative-hydrodynamical models for the hot Jupiter HD189733b. To address the radiative transfer, they developed a frequency-dependent, two-stream approximation (Mihalas 1978) for the radial radiative flux. Their transit spectrum agrees well with the data from the infrared to the UV, though it slightly under-predicts the observations at wavelengths shorter than ≈0.6 μ,m. Their emission spectrum agrees well at 5.8 and 8 μm, but over-predicts the emission at 3.6 and 4.5 μ,m. Their phase curves agree fairly well with the amplitudes of variations and the shape, as well as with the phases of minimum and maximum flux. However, they over-predict the peak amplitude at 3.6 μ,m and 4.5 μ,m. Rauscher & Menou (2010) presented a 3D hot Jupiter model, extending from 200 bar to 1 mbar, using an intermediate general circulation model and adopting a physical setup nearly identical to the model of HD 209458b by Cooper & Showman (2006). The discrepancies may be due to the different methods of solution used and/or to the fact that the equations lack information about some of the physics at work in the hot Jupiter context. In this modeling context, Rauscher & Menou cannot be certain of the accuracy and validity of their models until they can produce consistent results. By using a 3D general circulation model with Newtonian cooling and day-side and night-side equilibrium temperature profiles. Burrows et al. (2010) created models for the planet HD209458b. They obtained transit radius spectra during the primary transit. Using a ID spectral atmosphere code, they integrated over the face of the planet seen by an observer at various orbital phases and calculated light curves as a function of wavelength. However, since their circulation model uses Newtonian cooling (and not radiative transfer using opacities that correspond to those used in the post-processing), their calculations could be slightly inconsistent. Fortney et al. (2010) computed the spectra of the planets HD2094458b and HD189733b for both the 1D and 3D model atmospheres and examined the differences between them.
In this paper, the 3D version of the radiative transfer PHOENIX code was used to compute light curves as well as reflection spectra for a 3D temperature-pressure structure on a latitude and longitude grid. A suitable treatment of atmospheric dynamics, non-equilibrium chemistry, and 3D radiative transfer is a noteworthy achievement of this work. Given the 3D temperataure-pressure grid and the corresponding chemical mixing ratios, the PHOENIX radiative transfer model solves for the upward and downward fluxes in each layer. These fluxes are wavelength dependent and differ from layer to layer. The modeling of atmospheres with the PHOENIX code could be important for at least two reasons. First, since the emergent spectra of hot Jupiters are determined by the chemistry and physics of their outer atmospheres, when direct detection of hot Jupiters is achieved and the spectra are obtained, PHOENIX models could be essential in the interpretation of the data and in the extraction of essential physical information such as radius, gravity temperature, and composition. Second, theoretical spectral models are important in guiding current and future direct searches for hot Jupiters.
This work is organized in three sections: the first provides a brief introduction to hot Jupiters and to the relevance of the PHOENIX code to model planetary atmospheres. The second section contains a description of the PHOENIX code used to simulate the irradiation of hot Jupiters, explains the mathematical framework used to solve the radiative transfer equation by numerical methods, and gives a description of the physics and microphysics of irradiated atmospheres. The global circulation model (GCM) that generated the temperature-pressure structures used to feed the 3D radiative transfer PHOENIX code is also described in § 2. § 3 provides results; it shows radiative fluxes at interesting locations on the planet; cloud-free and dusty atmosphere models of the hot Jupiter HD 179949b are presented in order to see the differences between them. PHOENIX cloud-free and dusty planet light curves were calculated for different wavelength bands and compared to actual data points. Finally, cloud-free and dusty spectra are presented for the planet HD179949b. The cloud-free PHOENIX spectrum was confronted with observational data from the hot jupiter HD209242b; it was found that the theoretical model was able to fit some planet-star flux ratio data points.
2. METHODS
For calculations in this paper, the 3D radiative transfer equation was solved along rays or charac teristics (see Hauschildt & Baron 2006; Olson & Ku-nasz 1987). The iterative method for the solution of the radiative transfer equation, based on the philosophy of operator perturbation, was the method used to solve the scattering problem (Cannon 1973; Scharmer 1984). Its numerical approach is based on finding consistent solutions for the source function and the mean intensity by iterative methods. The mean intensities in this study were calculated as established in Hauschildt & Baron (2006), that is, the mean intensity J was obtained from the source function S by a formal solution of the radiative transfer equation. The equation of state (EOS) calculations were performed according to the method discussed in Smith & Missen (1982), while the EOS and opac ity data were identical to those used by Husser et al. (2013).
2.1. The PHOENIX code
The latest version of the PHOENIX code (10.6) was used to calculate the mean intensities, reflection spectra and light curves of hot Jupiters. The original version of PHOENIX comprised detailed radiative transfer (Hauschildt 1992) that allows for spherical symmetry. The modeling of the effects of extremely irradiated atmospheres considered full 3D modeling of radiation transport, including deviations from the local thermodynamics equilibrium (NLTE). The treatment included scattering, which is an important effect in the day-side of a planet due to the high temperature caused by the irradiation, as well as near the planet's terminator due to the scattering by dust particles that can survive there thanks to the lower termperatures. The numerical modeling of the atmosphere with PHOENIX involves the combination of a radiative transfer technique with atmospheric structure and boundary constraints. The PHOENIX code incorporates a 3D radiation transport framework (Hauschildt & Baron 2006; Baron & Hauschildt 2007; Hauschildt et al. 2008; Baron et al. 2009) into the PHOENIX package, creating the 3D PHOENIX mode in addition to the ID PHOENIX mode of the PHOENIX program package (Hauschildt & Baron 2010).
In this work, planetary atmospheres were modeled in spherical coordinates; their volume was di vided into discrete elements of space. These finite elements of space are called volume elements or voxels. A single characteristic hits the voxels of the grid, at different angles; thus, they provide different contributions to the angular resolution of the mean intensity at different layers. To each voxel physical data such as temperature, pressure, opacity, emissivity, intensity, source function etc., are assigned and then the radiative transfer is solved inside each voxel by a numerical quadrature (Barman et al. 2005).
2.2. The global circulation model
The effect of horizontal motions on hot Jupiter atmospheres has been modeled by several research groups (e.g. Showman & Guillot 2002; Cho et al. 2003; Burkert et al. 2005; Cooper & Showman 2005). Despite the differences in methods and results, the general consensus from these hydrodynamic simulations is that circulations can redistribute a fraction of the incident energy over large portions of a strongly irradiated planetary atmosphere.
In this work, external models are used for the 3D approach to the atmospheric circulation of hot Jupiters (T. Barman, 2012, private communication). In other words, the global circulation models used in this work were generated from the model data by Showman et al. (2009). They approximated day-side heating and night-side cooling using a Newtonian cooling/heating scheme that parameterizes the radiative heating rate (in K s-1) as (T eq - T)Trad. where T eq is the specified radiative equilibrium temperature profile, T is the actual temperature, and τ rad is the radiative-equilibrium timescale. These atmospheric circulation models are based on six fundamental conservation equations: conservation of mass, conservation of momentum (one equation for each dimension), conservation of energy, and the ideal gas law as the equation of state. Within the context of Newtonian cooling, Showman et al. (2009) calculated longitude, latitude, and height-dependent radiative-equilibrium temperatures.
The radiative-equilibrium temperature structures described above were used as input structure files to feed the 3D radiative transfer PHOENIX code in order to generate models of hot Jupiters. Figure 1 illustrates the simulated behavior of the global circulation model of Showman et al. (2009) using solar opacities. It shows the temperature (color scale) over the globe at three different pressure levels. A temperature range of 346 K to 896 K is observed on the external layer, with a pressure equal to ≈ 10-6 bar, indicating that the absorbed energy from the parent star is distributed through the planet's atmosphere, that is, the energy from the irradiated day-side is efficiently redistributed throughout the atmosphere. Day-night temperature differences reached nearly 40 K at 170 bar and 600 K at 20 mbar. Although the detailed structure varies between levels, the hottest regions lie east of the substellar point. The atmospheric dynamics distorts the temperature pattern in a complex manner, involving the eastward displacement of the hottest regions from the substellar point.
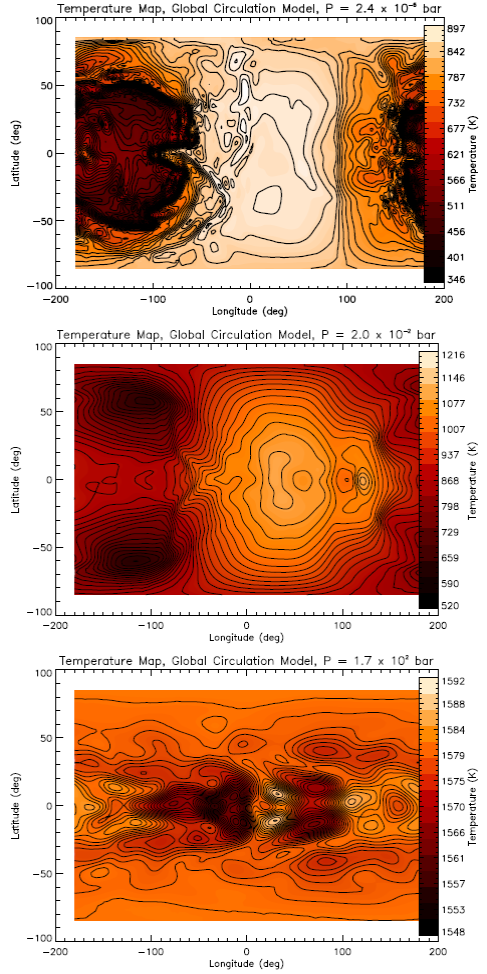
Fig. 1 Simulated temperature maps of the global circulation model. The maps use a linear scale, with the hottest points shown in white and the coldest points in black. From top to bottom there are three isobars: 0.0024, 20 and 170 000 mbar. The substellar point is at (0,0) in longitude and latitude. The atmostpheric dynamics distorts the temperature pattern in a complex manner; this generally involves an eastward displacement of the hottest regions from the substellar point. The color figure can be viewed online.
Figure 2 shows a diversity of vertical temperature profiles that can occur. It displays in two panels the temperature-pressure structure profile as function of longitude. The left panel corresponds to a latitude of 0 degrees and the right one to 30 degrees. The solid lines correspond to different locations on the planet; the magenta line corresponds to long = -120 deg; the black lines to long = -90 deg; the red lines to long = -45 deg, the blue to long = 0 deg, the green to long = 45 deg, the cyan to long = 60 deg and the yellow to long = 90 deg. Slight bumps (on the night-side) and depressions (on the day-side) can be seen between ≈ 101 and ≈ 102 bars in the temperature-pressure profiles; this region is close to where the heat redistribution is expected to occur.
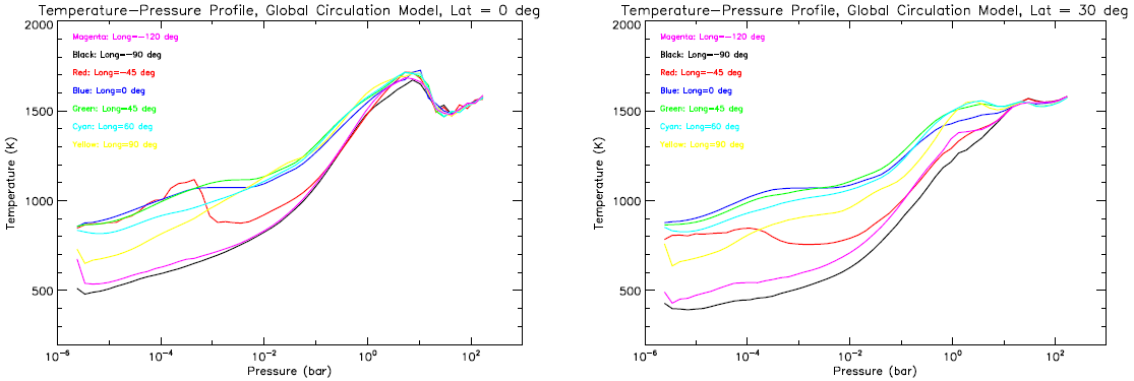
Fig. 2 A selection of temperature-pressure profiles for the solar-abundance global circulation model. The equatorial region is on average warmer than the 30 deg latitude region at pressures of less than a few bars. Note the formation of a stratosphere at pressures less than 0.1 bars. The color figure can be viewed online.
As expected, the equatorial region is on average warmer than the region at 30 deg latitude at pressures of less than a few bars. At low pressures, the longitudinal variation is comparable to the latitudinal variation. The temperature declines smoothly with altitude varying from ≈ 10° bar to ≈ 10 mbar. This has important implications for the spectra and light curves, which originate within this layer. Atmospheric dynamics modify the deep stable radiative layer starting from 10-100 bars, leading to significant latitude variation of both temperature and static stability (Showman et al. 2009). Following the analysis by Seager (2010), the temperature-pressure profiles shown in Figure 2 could be divided into three representative layers. Above layer 1, at pressures below P ≈ 10-2, the optical depth becomes small enough at all wavelengths, so that the layers of the atmosphere are transparent to the incoming and outgoing radiation, and are not relevant in terms of spectral features. This uppermost layer shows no thermal inversions. Layer 2, from ≈ 10-2 bar to ≈ 10° bar, is where most spectral features are formed. In this layer, the temperature structure is governed by radiative process and possibly by atmospheric dynamics. These optically thin layers are located at altitudes where thermal inversions can be formed. Layer 3, from ≈ 10° bar to ≈ 102 bar, is the regime where a large optical depth leads to radiative diffusion and the associated isothermal temperature structure. Below this layer, in the deepest layers of the planet atmosphere, convection is the dominant energy transport mechanism.
3. RESULTS
In this section, we present theoretical radiative fluxes, light curves and reflection spectra used to simulate irradiated global circulation models (hot Jupiters). To calculate the mean intensities, we used the temperature-pressure profiles described in Subsection 2.2 as an input for the 3D radiative transfer PHOENIX code so that it could generate the radiation fields. Afterwards, this grid with S (source function) and J (mean intensities) was used to create 3D visualizations (spectro-images), spectra and light curves. In this study, the global circulation model passing in front of its parent star was simulated with PHOENIX on a 3.5M voxels grid with n r = 53, n θ = 257 and n ϕ = 257 voxels. This number of voxels was selected to be large enough to minimize the effects of pixel-lation, but small enough to obtain reasonable computation times. The irradiated models presented in this section were computed using the PHOENIX atmosphere code (Hauschildt & Baron 1999; Allard et al. 2001) adapted to include extrinsic radiation as described in Barman et al. (2001; 2002).
3.1. Test radiative fluxes
The experiments in this subsection correspond to radiative fluxes of the hot Jupiter HD 179949b, for which there is data available from the Spitzer and Hubble Space Telescopes (e.g., Burrows et al. 2008; Cowan et al. 2007). The physical and orbital parameters shown in Table 1 were employed to simulate the hot Jupiter. The parent star HD 179949 is a F8V star, orbited by HD179949b at 0.0443 ± 0.0026 AU, making it one of the closest orbiting planets in a low-eccentricity orbit (e = 0.022 ± 0.015). The scattering parameter in the PHOENIX models was set to ϵ = 10-4, which is a reasonable value to simulate a strong scattering environment. To calculate the radiative fluxes, we assumed that, for irradiated atmospheres, the parent star is located at the zenith over the substellar point, that is, θ = π/2 and ϕ = π. where θ corresponds to the polar angle and ϕ to the azimuth angle. In this case, the day-night boundary is at θ = 0, meaning that the parent star is above the substellar point, ('above' meaning in the vertical direction assuming no axial tilts). The PHOENIX models assume circular orbits, which is a good approximation for most exoplanets in tight orbits.

The first experiment in this subsection corresponds to 3D cloud-free radiative fluxes of the hot Jupiter HD179949b. The irradiated planets in this study have been modeled for two extreme cases: one where dust clouds form and remain suspended in the atmosphere (dusty models), and another where dust clouds form but then settle completely out of the atmosphere (cloud-free models). In cloud-free situations, dust grains form in the atmosphere at locations determined by the chemical equilibrium equations, but their opacity contribution is ignored, mimicking a complete removal of the grains by efficient gravitational settling. Thus, these models represent cloud-free atmospheres. Cloud-free models may be thought of as representing clear skies, while the dusty models represent cloudy skies.
The green curves in Figure 3 correspond to the global circulation model, here also called the 1DRT two-stream model; the black curves correspond to the irradiated planet HD 179949b, modeled with PHOENIX, also called the 3DRT PHOENIX model. The plots show the radial and angular components of the flux vector (F r, F θ and F ϕ) versus wavelength. Figure 3 shows radiative fluxes at the substellar and anti-substellar points. It does not show flux vectors across all the outermost voxels (outermost radius, all (θ, ϕ) points). In the outermost voxels the pressure is equal to 0.002 mbar, while the temperature is equal to 880 K at the substellar point and to 300 K at the anti-substellar point. Figure 3 shows cloud-free fluxes in the 5000 - 150000 Ǻ wavelength range: the frames on the left correspond to the substellar point and those on the right to the anti-substellar point. These cloud-free models do include TiO and VO opacities. The 3D radiative fluxes are medium resolution calculations, covering a broad wavelength range and providing context for the overall features: however, high-resolution models are needed to identify specific absorption features.
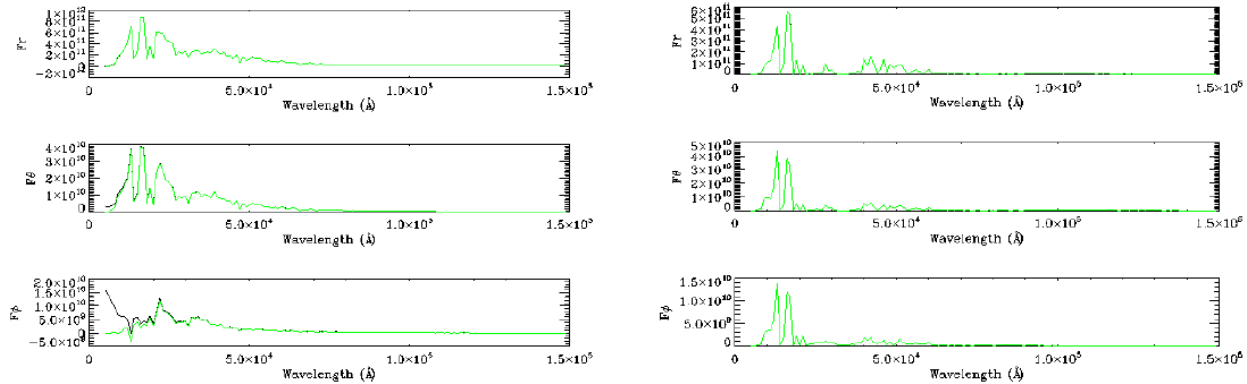
Fig. 3 Global circulation model. 3D cloud-free radiative fluxes of the hot Jupiter HD179949b in the 5000 - 150000 A wavelength range. Left panel: relative flux at the substellar point. Right panel: relative flux at the anti-substellar point. The green curves correspond to the 1DRT two-stream model and the black curve to the 3DRT PHOENIX model. Irradiated atmospheres on the day-side remain very transparent and allow large amounts of flux to emerge from the deep hotter layers. Nightside spectra at the antisubstellar point show deep absorption bands of H2O, CO, and/or CH4: the 1DRT two-stream model dominates the nightside regime. The color figure can be viewed online.
As can be seen in Figure 3, day-side models show that, in the 5000 - 15000 Ǻ wavelength range, the irradiated flux is larger than the emission flux estimated by the 1DRT two-stream model; this is evident in the F θ and F ϕ flux components. The significant modulations present in the near-IR spectrum are best explained by the presence of water vapor and carbon-bearing molecules. The 3DRT PHOENIX model shows a considerable amount of radiation in the optical bands compared to the 1DRT two-stream model. In night-side models, molecules predominate in the fluxes. At the anti-substellar point absorption features are created by molecules that can survive lower temperatures. The PHOENIX radiative fluxes in the near-IR contain significant modulations, which can be attributed to the presence of molecular bands seen in absorption. These are water (H2O), carbon monoxide (CO), and carbon dioxide (CO2) bands.
H2O and CH4 molecules have already been inferred for some hot Jupiters via transmission photometry and spectroscopy (e.g. Desert et al. 2009, Deming et al. 2013, Gibson et al. 2012, Sing et al. 2009, Birkbyetal. 2013). Recently Madhusudhan et al. (2014) reported conclusive measurements of H2O in the hot jupiter HD209458b; indeed, they report the most precise H2O measurement in an exoplanet to date, indicating a ≈20-135 x sub-solar H2O abundance. CO, the most thermochemically stable carbon molecule on the hot day-side, has been inferred from photometry (Barmam 2008; Charbonneau et al. 2008). The light reflected in the optical regime could be due to Rayleigh scattering by the two most abundant species, H2 and He (Lecavelier des Etangs et al. 2008).
By modeling radiative fluxes at different positions on the planet, it is possible to see that the night-side is in most cases equal to the corresponding voxels in the 1DRT two-stream model, with the exception of the places where the light from the star shines through. Identical voxels (same fluxes) are not directly affected by the light from the star, while others are directly affected (and carry information about the atmosphere to the observers when the planet is transiting the stellar disk). Figure 3 shows how molecular opacities dominate the spectral range through which the planet radiates the bulk of its emergent flux (≈ 15000 Ǻ), leaving practically no window of true continuum. The models show molecular absorption features in the 10 000 -30000 Ǻ wavelength range. Irradiated atmospheres on the day-side remain very transparent and allow large amounts of flux to emerge from the deep hotter layers. Night-side fluxes at the anti-substellar point show deep absorption bands of H2O, CO, and/or CH4. In chemical equilibrium, CO would dominate over CH4 across much of the dayside, but CH4 dominates on the nightside. Molecular absorptions, mainly water and methane, are visible for > 10000 Ǻ. This means that methane absorption takes place in the deeper layers, while the water bands are located in the upper layers and are sensitive to the irradiation.
The second test experiment in this subsection shows the effect of the presence of dust in the atmosphere of HD 179949b. These cloudy models correspond to cases when dust forms in the atmosphere at locations determined by chemical equilibrium equations. It is known that dust clouds generate enormous opacity, and that the condensation of solid particles as clouds or haze layers can generate strong opacity (e.g. Jones & Tsuji 1997). Because of this, it was expected that the spectral appearance of the object would be considerably changed, as clouds effectively reflect impinging radiation. The dusty models made with PHOENIX show a complex mixture of cloud species throughout the atmosphere. According to Barman et al. (2001), Fe, Mg2SiO4 and MgSiO3 are the most prominent species, except for the deeper layers, where CaMgSi2O6 begins to dominate. Specifically, they argue that in the dusty models, Fe, Mg2SiO4, MgSiO3, CaMgSi2O6 and MgAl2O4 are dominant dust species, forming a cloudy region extending from roughly τ std = 1.0 to the top of the atmosphere; below this region (τ std > 1.0) there is a mixture of various other condensates. To include dust grains, we assumed an interstellar size distribution with diameters ranging from 0.00625 to 0.24 microns, and the chemical equilibrium equations incorporated over 1000 liquids and crystals; details are given in Barman et al. (2001) and Allard et al. (2001). Within the dusty calculations, the number densities for each grain species were calculated using the method of Grossman (1972) and the Gibbs free energies of formation from the JANAF database (Chase et al., 1985). In this work, the grains are represented by spherical shapes for the sake of simplicity. The effects of grain sizes and dust porosity on the models are not explored in this study. Figure 4 shows dusty models at two locations on the planet; the left frames correspond to fluxes at the substellar point, while the right frames correspond to fluxes at the anti-substellar point.
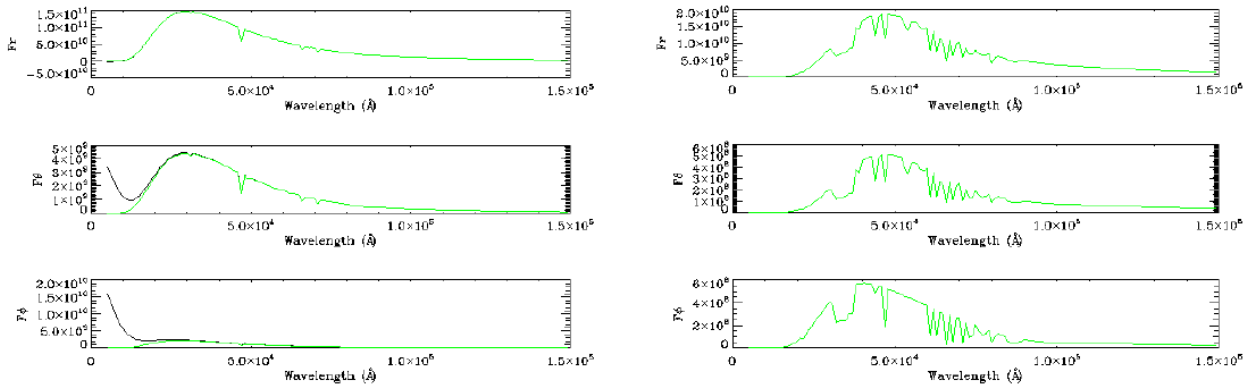
Fig. 4 Same as Figure 3 but for models with dust opacity. Dust opacity generally produces a hotter atmosphere at all depths with a smoother spectral energy distribution. The absorption features are more prominent on the night-side than on the day-side. On the day-side, the strong heating effects of dust opacities prevent the formation of methane bands; H2O is dissociated producing a hotter water vapor opacity profile, which is much weaker and more transparent to radiation. The color figure can be viewed online.
On the day-side, the strong heating effects of dust opacities prevent the formation of methane bands; H2O is dissociated while producing a hotter water vapor opacity profile, which is much weaker and more transparent to radiation. The dusty absorption features are more prominent at the anti-substellar point than at the stellar point. The dusty model generates a very smooth flux in the optical regime, as expected, for an atmosphere dominated by grain opacity. In general, cloud-free models are much brighter than dusty ones because dust opacity blocks most of the thermal radiation. In day-side models, the reflected light of the dusty model matches closely the setllar light for wavelengths shorter than ≈ 2000 Ǻ. The reflected light of the dusty models could be due almost entirely to Mie scattering, which is a fairly grey process.
The radiative fluxes plotted in Figures 3 and 4 show flux vectors at a specific outermost voxel; they do not show the flux vectors of all outermost voxels (outermost radius, all (θ, ϕ) points). Figure 5 shows radiative fluxes across the outermost voxels for the 1DRT two-stream (left) and 3DRT PHOENIX (right) models with clear skies. The models are presented in spherical coordinates. The radial component of the flux vector F r is the only non-zero component, since both F θ and F ϕ are zero in spherical symmetry. The error in the angular components at short wave lengths of the 3DRT PHOENIX calculations could be due to the number of solid angle points. Hauschildt & Baron (2006, 2010) claim that if the number of solid angle points is too small in PHOENIX, then F θ and F ϕ could have errors. They found that a higher solid angle resolution considerably reduces the errors in F θ and F ϕ and that a higher internal accuracy, which is due to a higher number of solid angle points, also increases the internal accuracy of F r.
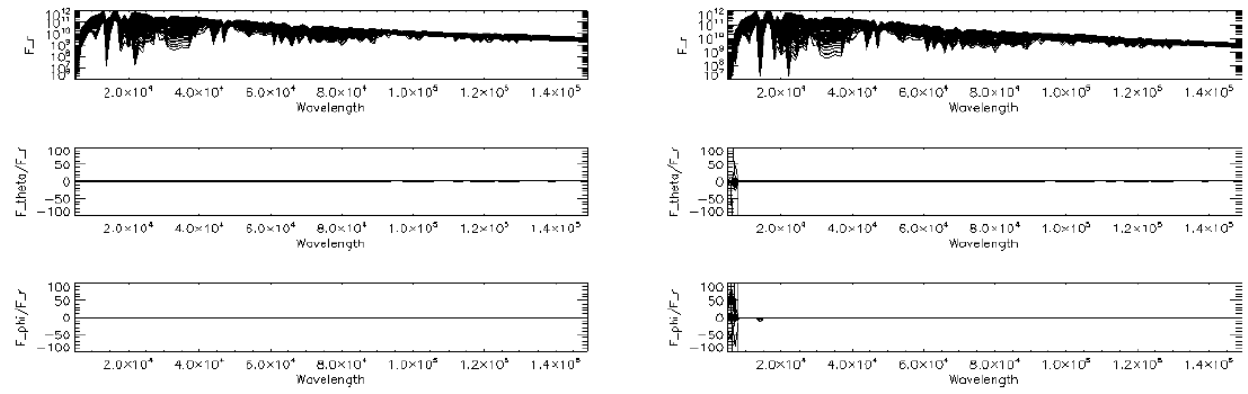
Fig. 5 Radiative flux vectors across the outermost voxels for the 1DRT two-stream (left) and 3DRT PHOENIX (right) models with clear skies. Models are shown in spherical coordinates. The calculations use a 3D spherical coordinate system with n r = 53, n θ = 257 and n ϕ = 257 voxels for a total of about 3.5M voxels. The F r panels show the radial component of all outer voxels in logarithmic scale. The bottom panels show the corresponding runs of F θ/Fr and F ϕ/Fr. respectively. They should be identically zero and the deviations measure the internal accuracy. The wavelengths are given in angstroms and the fluxes in cgs units.
The third experiment in this subsection shows a 3D visualization of the irradiated global circulation model used to generate spectro-images of the mean emitted intensities. The visualization reads the results of the 3D radiative transfer, performs a formal solution for a specific (θ, ϕ) and displays the results as images of the intensities. The 3D visualizations draw on the global circulation model described in Subsection 2.2 and show the influence of atmospheric dynamics on infrared radiative fluxes. Figure 6 shows wavelength resolved images of HD 179949b for eight 45-degree phase increments. The frames show the mean intensities in the 0.51-0.99 μm wavelength range (near infrared band). These kinds of visualizations could be a good step forward for the computational imaging of extrasolar planets. The slight pixellation and asymmetries are due to spatial and angular resolution.
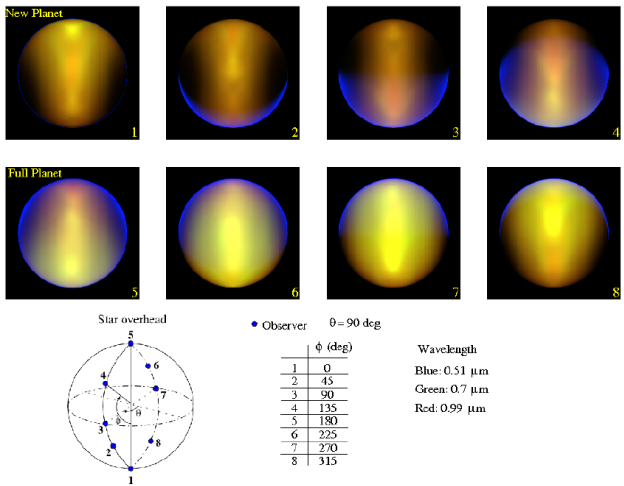
Fig. 6 Visualizations of the results for multi-wavelength 3D radiation transfer of a global circulation planetary atmosphere model for eight 45-degree phase increments in the planet HD179949b. The red channel corresponds to 0.99 μm, the green channel to 0.7 μm and the blue channel to 0.51 μm. The irradiated 1DRT two-stream model predicts a day-side that is very similar to a blackbody, leading to a whitish appearance. On the night-side, which is fairly cool, strong methane absorption suppresses the blue and green, leaving only red. The spectro-images directly map the patchy global patterns inferred to exist from models of multiwavelength variability. The color figure can be viewed online.
In Figure 6, a bright near sub-stellar region can clearly be seen in the upper panels (New Planet), lighter and darker regions correspond to brightness variations. A natural explanation for the features seen in Figure 6 is that spectro-images are directly mapping the patchy global patterns inferred to exist from observations and models of multiwavelength variability. The spectra of hot Jupiters vary strongly over their surface, as the effects of irradiation also vary extremely over the surface; such effects are in principle observable through high-precision photometric and spectroscopic studies.
3.2. Light curves
In this subsection theoretical light curves were calculated as a. function of wavelength for HD 179949b and compared with actual measurements by the Spitzer Space Telescope. The obser vational data for the 8 μm light curve of HD 179949b were taken from Burrows et. al (2008). Figure 7 shows a comparison between their theoretical models (with various combinations of parameters) and the eight observational data points of Cowan et al. (2007). The PHOENIX models simulate planetary transits for each time step, 360 in total; a summation over all voxels on the planetary sphere gives the full intensity integration. The intensity integration is used to generate the PHOENIX light curves. The global circulation model (hot Jupiter) passing in front of its parent star is simulated with PHOENIX on a 257x257 pixel grid. The PHOENIX models assume circular orbits, which is a good approximation for most exoplanets in tight orbits. Figure 7 presents theoretical light curves in the infrared regime, and planet-star flux ratios; the left and right panels correspond to models for the cloud-free and dusty atmospheres, respectively. Within each panel, moving from top to bottom, light curves correspond to wavelengths from 13 μm to 2 μm.
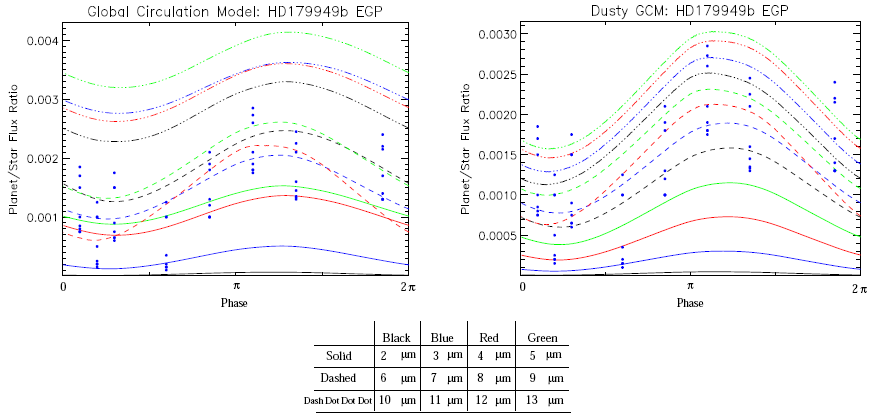
Fig. 7 Theoretical light curves in the 2.0-13.0 μm wavelength range for HD179949b. Left and right panels show cloud-free and dusty light curves, respectively. Within each panel, moving from top to bottom, the light curves correspond to wavelengths from 13 μm to 2 μm. The blue dots correspond to the 8 μm data points by Burrows et al. (2008). The light curves reach their peak flux after the secondary eclipse. These phase offsets result directly from the atmospheric dynamics of the 1DRT two-stream model. The color figure can be viewed online.
The light curves in Figure 7 reach their peak flux after the secondary eclipse, a feature shared by all light curves. These phase offsets result directly from the atmospheric dynamics in the 1DRT two-stream model. According to Burrows et al. (2008), this may be a feature of a hot Jupiter with a stratosphere and/or a hot upper atmospheres. The shape and magnitude of the PHOENIX light curves strongly depend on Rayleigh scattering of light from the host star, on the presence of dust, on the refraction of the stellar surface brightness distribution, and on the optical depth through the planet's atmosphere, as determined by molecular opacity and clouds.
The 8 μm cloud-free and dusty PHOENIX light curves were compared to the published 8 μm data points by Burrows et al. (2008). The theoretical and observational data are shown in Table 2; the first column shows to the orbital phase; the second and third columns the PHOENIX planet-star flux ratios for the cloud-free (R cf) and dusty (R d) light curves, respectively. The fourth column (R obs±σ) lists the observational data and uncertainties of Burrows et al. (2008).
Table 2 Planet-star flux ratios and observational data for HD179949B*
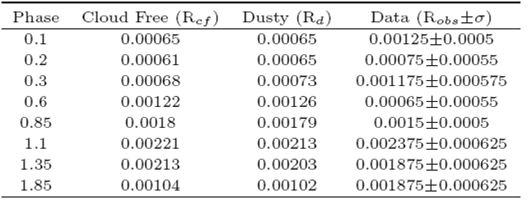
*Robs are the observational data. The theoretical predictions correspond to cloud-free (R cf) and dusty (R d) models.
The chi-square statistics is defined by
 (1)
(1)
where σi is the uncertainty of each data point and N is the number of independent variables. Ideally given the values of R cf (or R d) about their mean values R obs, each term in the sum would be of or der unity. The degrees of freedom v are equal to 7, because there are N=8 data points and one ad justable parameter. The reduced X2 is equal to 1.24 for the cloud-free model and to 1.27 for the dusty model, respectively. Only a X2 of around 1.0 would have justified doubting the consistency of the measurements. The discrepancies are discussed in § 4.
3.3. Reflection spectra
The basic tenet of the PHOENIX reflection spectra method is that the absorption features of the planet's atmosphere are calculated as the stellar flux passes through the planet's atmosphere above the limb. According to the PHOENIX reflection simulations, the orbital phase is referred to the time occurs when the planet is fully projected on the visible hemisphere of the star so that the planet's projected transparent atmosphere takes out the greatest and limb darkening from the star is at its minimum. By integrating the emergent intensities along an observer's line of sight towards the observer-limb-star orientation, the flux is calculated when it passes through a section of a sphere encompassing the limb, when rays entering at different latitudes pass through different amounts of the planet's atmosphere. The theoretical reflection spectra for the hot Jupiter HD 179949b are shown in Figure 8; the upper panels show the stellar radiation passing through the planet's atmosphere, while the bottom panels show the planet-star flux ratios. The left panels correspond to cloud-free atmospheres and the right panels to dusty atmospheres.
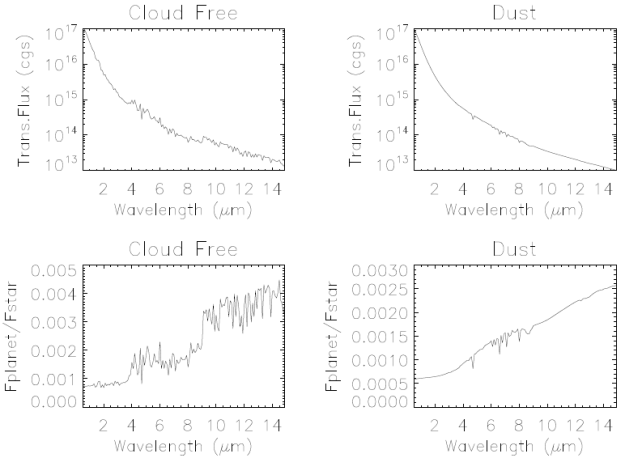
Fig. 8 3D PHOENIX reflection spectra of the Planet HD179949b. The left frames correspond to cloud-free atmospheres and the right frames to dusty atmospheres. The upper frames correspond to the stellar radiation passing through the planet's atmosphere, picking up some spectral features from it. The lower frames correspond to the planet-star flux ratios. The cloud-free spectrum shows prominent H2O molecular absorption features. The absorption features due to dust opacities are smaller than the molecular absorption feautures.
The PHOENIX atmospheres impose features on the spectra of the parent star during transit; these features contain information about the physical conditions and chemical composition of the atmospheres. In the cloud-free spectrum, the most prominent molecular absorption features are seen from ≈ 4 μm to 14 μm. This spectrum shows prominent H2O molecular absorption features. In dusty models, the most prominent absorption features are seen in the 4.5-9 μm wavelength range, while the 0.5-4.5 μm and 9-14 μm wavelength ranges are featureless. The absorption features produced by dust are smaller than the molecular absorption features. Many important optical/near-IR molecular opacity sources (TiO and VO) have been completely removed by the dust formation. It has also been found that the apparent radius of the planet in the optical regime is equal to 0.12 R star, which is in agreement with predictions found in the literature (i.e. Wang & Ford 2011); the apparent radius was calculated following the analysis of Seager (2010).
The 3D PHOENIX reflection spectrum for HD 179949b was compared with the Spitzer secondary-eclipse photometry of Knutson et al. (2008, 2009). The planet HD209458b was chosen for comparison with the PHOENIX model because it has similar orbital parameters to the hot Jupiter HD179949b. The planet HD209458b is also interesting in terms of reflection spectroscopy due to the presence of molecules such as CH4, CO and H2O (Barman 2008; Swain et al. 2008). Table 3 contains the observational planet-star flux ratios for HD209458b and the PHOENIX predictions for HD179949b; Figure 9 shows the 3D PHOENIX cloud-free reflection spectrum of HD179949b and, represented by red error bars, the observational data of Showman et al. (2009) for the hot Jupiter HD209458b.

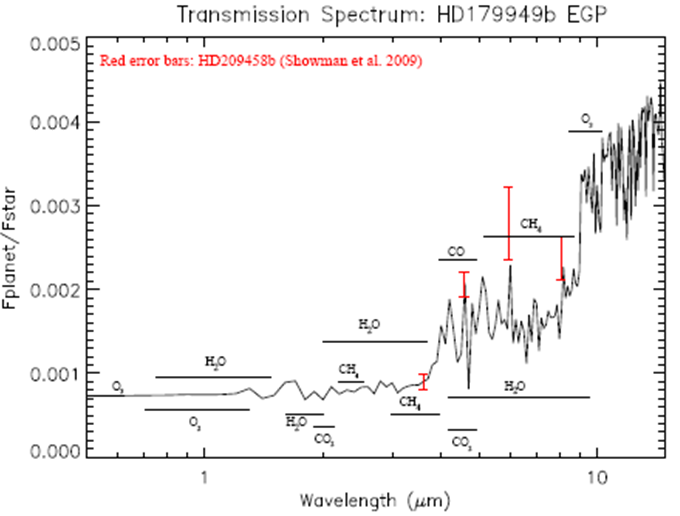
Fig. 9 Cloud-free reflection spectrum for the planet HD179949b. The absorption of visible and near IR radiation in the gaseous atmosphere is primarily due to H2O, O3, and CO2. The main atmospheric gases absorbing/emitting in the 1R are: CO2 H2O, O3, CH4, N2O. The red error bars represent observational data for the hot Jupiter HD209458b. The PHOENIX model matches the secondary-eclipse depths at 3.6 μm. However, it un-derpredicts the eclipse depths at 4.5, 5.8 and 8.0 μm. The color figure can be viewed online.
Figure 9 shows important absorption features. The most useful diagnostic is likely to be the near-infrared bands of molecules, and the visible/near-IR resonance lines of the alkali metals (Barman et al. 2005; Burrows et al. 2008). In general, the cloud-free reflection spectrum in the mid infrared is sensitive to molecular abundances. The relative strengths of molecular lines provide diagnostics for the temperature and for the vertical temperature structure. Moreover, the X 2 is equal to 37.12 and the reduced X 2 to 12.37 with 3 degrees of freedom. The PHOENIX spectrum shown in Figure 9 matches the secondary-eclipse depth at 3.6 μm; however, it underpredicts the eclipse depths at 4.5, 5.8 and 8.0 μm. When a spectrum exhibits greatly differing brightness tem peratures at different wavelengths (as in the case of HD209458b), a common explanation is that the different wavelengths indicate different pressure levels (because of the wavelength-dependent opacities, e.g. Cubillos et al. 2013). In this context, the fundamental stumbling block to simultaneously explain the four Spitzer secondary-eclipse depths is that the range of pressures that the photons contribute to the 3.6, 4.5, 5.6, 8.0 μm wavelengths are all very similar, at least for the radiative-transfer PHOENIX model and for the chemical composition, and opacities adopted for the model. Thus, it is difficult to obtain a high brightness temperature in some bands (such as at 4.5 μm, 5.8 μm and 8 μm) while maintaining low brightness temperatures in other bands (such as at 3.6 μm ), as the data apparently require. The temperature discrepancy problem is not confined to the present study.
4. DISCUSSIONS AND CONCLUSIONS
In this work we presented the spectra and light curves of a detailed global circulation model (GCM) in the presence of a strong impinging radiation from its parent star, and compared them to actual observations in the infrared regime. The GCM uses radiative-equilibrium temperatures as a. function of longitude, latitude, and pressure; temperature-pressure structures were used as input structure files to feed the 3D planetary atmosphere PHOENIX code. The incorporation of a realistic 3D radiative transfer code for the study of the development of hot Jupiter atmospheres gives relevance to this work.
We calculated radiative fluxes of the hot Jupiter HD 179949b at the substellar and anti-substellar points in order to look for differences. Day-side models show that the flux estimated by the 3DRT PHOENIX code is larger than the emission estimated by the 1DRT two-stream model in the 5000 - 15 000 Ǻ wavelength range. Nightside fluxes at the anti-substellar point show deep absorption bands of H2O, CO, and/or CH4. Dusty day-side models show that the strong heating effects of dust opacities prevent the formation of methane bands, and that H2O is dissociated, producing a hotter water vapor opacity profile which is much weaker and more transparent to radiation. The dusty absorption features are more prominent at the antisubstellar point than at the stellar point. The dusty model generates a very smooth flux in the optical regime, as is expected for an atmosphere dominated by grain opacity.
We calculated theoretical light curves as a function of wavelength for the hot Jupiter HD 179949b and compared them to actual observational data from the Spitzer Space Telescope. The PHOENIX simulations explain the broad features of the observed 8.0 μm light curves (Cowan et al. 2007, Burrows et al. 2008), including the fact that the planet-star flux ratio peaks before the secondary eclipse. PHOENIX radiative fluxes and phase-dependent light curves reveal molecular and atomic compositions, atmospheric temperatures and the degree to which the radiation received on the day.side is redistributed to the night-side.
The PHOENIX cloud-free reflection spectrum was compared with actual data points from the Spitzer Telescope for the Jupiter HD209458b. The theoretical predictions provide reasonable matches to the Spitzer secondary eclipse depth at 3.6 μm; however, they underpredict the eclipse depths at 4.5, 5.8 and 8.0 μm. These discrepancies result from the chemical composition.
The majority of the difficulties in matching the data to the spectrum and light curves are not due to the PHOENIX calculations but rather to the global circulation calculations. We are aware that better global circulation models exist and have indeed been developed because of the limitations of the Newtonian cooling and its inability to fit the observations. The GCM used in this work was created to simulate the hot Jupiter HD209458b, which has been a prototypical exoplanet for atmospheric thermal inversions (e.g. Showman et al. 2009); however the latter assertion does not take into account recently obtained data or newer data reduction techniques. Recently, Diamond-Lowe et al. (2014) revised the value of the Spitzer measurements and found a very good agreement with the theory. They determined that it is unnecessary to invoke a thermal inversion to explain the secondary-eclipse depths and concluded that there is no evidence for a thermal inversion in the atmosphere of HD 209458b. This supports the use of the PHOENIX models to select better circulation models for the hot Jupiter HD 179949b. Another possibility is that the discrepancies are caused by some physics that are still not included in the theoretical models.
Solving these problems requires collaboration with other research groups. According to Diamond-Lowe et al. (2014), their group is working on exploring the effects of a wide range of planetary properties on circulations models, including eccentricity, orbital distance, rotation rate, mass, gravity, composition, metallicity, and stellar flux. It could be beneficial to collaborate with their group to calculate the theoretical radiative fluxes, spectra and light curves for a variety of circulation models using the radiative transfer PHOENIX code. We expect that the high spectral resolution of JWST will allow us to make meaningful inferences about the atmospheric structure and composition of hot Jupiters. The JWST will be a powerful tool for exoplanet transit spec troscopy of a wide range of planets, due to its broad wavelength coverage and high sensitivity (Barstow et al. 2015).
The results presented in this study represent a first approach to a full and detailed analysis of the 3D spectra and light curves of hot Jupiters. The relatively low resolution models presented here, covering a broad wavelength range, provide context for the overall features but models at medium or high-resolution models would be much better suited to identify specific absorption features and probe planetary atmospheres over a large pressure range.

