


 nueva página del texto (beta)
 Inglés (pdf)
 Artículo en XML
 Referencias del artículo
 Enviar artículo por email
 Citado por SciELO
  Similares en
SciELO
Similares en
SciELO 
 Permalink
1. INTRODUCTION
The Puppis region in the southern Milky Way (230° ≤ l ≤ 260°) has some interesting features. One of them is the so-called "Puppis window", located in the Galactic plane at l = 245°, with a low extinction of less than 2 mag and extending up to 8 kpc (FitzGerald 1968); this window is useful for the study of the outer spiral structure, and of other galaxies. Another feature is the presence of two OB associations (Puppis OBI and Puppis OB2) at positive latitudes, whose physical existence has been discussed in many investigations (Moffat & FitzGerald, 1974; Havlen, 1976; Humphreys, 1978; Reed, 1989; etc.); in addition, there are many indications of a warping of the matter plane of the Galaxy in the region (Reed 1996).
A general characteristic of the Puppis region is the great number of young OB stars at negative lat itudes, listed in the Catalogue of Luminous Stars for the Southern Milky Way (Stephenson & Sanduleak 1971; LS). The list includes stars in the magnitude range of 8.0 ≤ B ≤ 12.0. Combined with the search for O-B2 stars performed by Orsatti (1992: henceforth 092) using the thin prism, this list gives a fairly complete sample of young OB stars (up to B = 15.0 mag) in the region.
One of the results of Orsatti's search was the identification of a bunch of OB stars, located far from the Galactic plane (b = -4°) and at l = 249°, close to a region where the actual existence of an association in the surroundings of NGC 2439 has been disputed (Turner, 1977; Humphreys, 1978; Kaltcheva et al., 2001). Another important concentration of faint O-B3 stars was found before by McCarthy & Miller (1974; henceforth MM74) in a nearby region, around the star identified as HD 63077. In recent years, Courau et al. (2008) studied that region and found about 26 OB stars at an approximate distance of 5 ± 0.4 kpc.
These results convinced us of studying the possibility of the existence there of a young OB association; for that, we used the original UBV photometry of both authors, complemented by multicolor UBVRI polarimetry. Polarimetry has proven to be of good help when dealing with possible star memberships, providing information on the characteristics of the interstellar medium.
2. OBSERVATIONAL MATERIAL
Stars from the OB searches were selected in an area of about 17.5 square degrees, 245° ≤ l ≤ 250°. -2° ≤ b ≤ -5.°5, where the main concentrations of OB stars are located (see Figure 15 in 092 and the HD 63077 chart in MM74). UBV photoelectric photometry for O92, and photographic photometry of young stars for MM74 were taken from the original investigations. In general, the stars from MM74 had fainter magnitudes; the large errors were associated with photographic photometry. The details of the OB searches, the observations and the plate measuring processes can be read in the original papers. Table 1 lists the magnitudes and colors of the selected non-emission stars, which were taken from those authors; the galactic coordinates are also included.
Table 1 Photometry and memberships of the observed stars
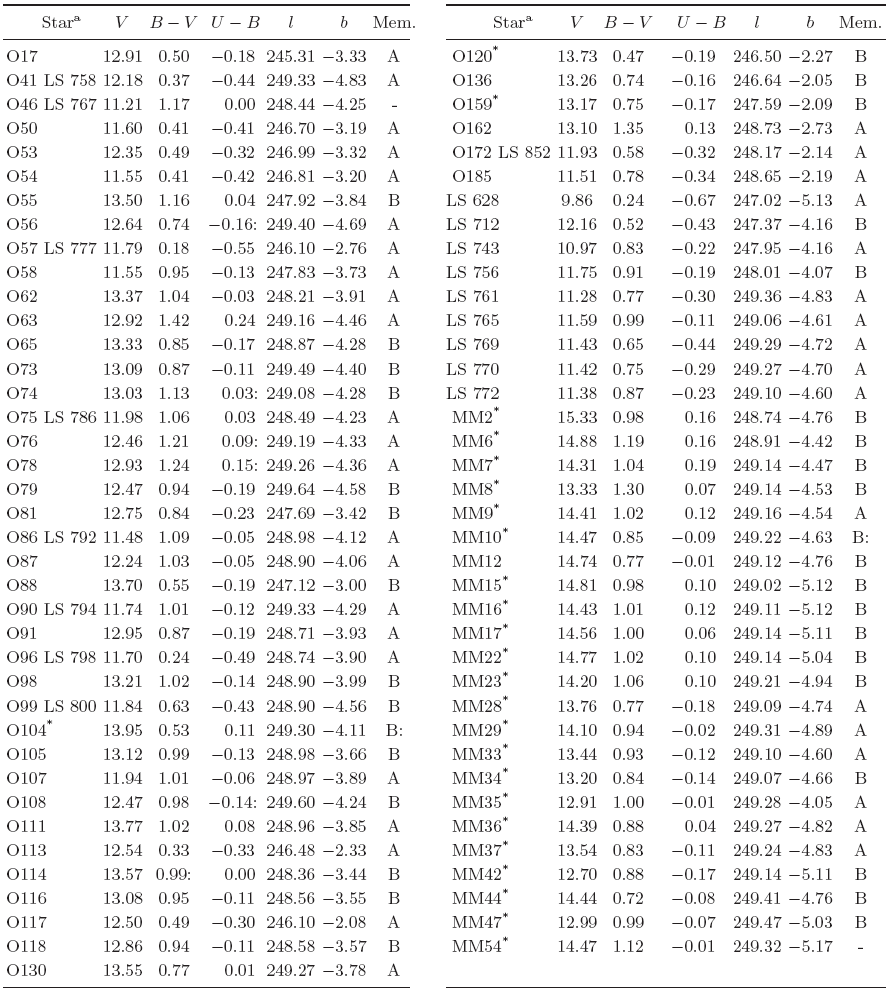
a Luminous Stars Catalogue (LSS), Orsatti (1992; O), or McCarthy & Miller (1974; MM).
* Photographic photometry.
Fifty OB stars from both searches and some Luminous Stars (LSS) in the region were selected for observation using UBVRI multicolor polarimetry in order to analyze the polarimetric characteristics of the interstellar medium for both groups. The observations were carried out from 2005 to 2012, in common with other projects, using CASPROF the rotating-plate polarimeter attached to the 2.15 m telescope at the Complejo Astronomico El Leoncito (San Juan, Argentina). This instrument is an improvement of the original design of the photoelectric polarimeter known as VATPOL (see Magalhães et al. 1984); it has two high throughput photocells (Martinez et al. 1990). The UBV(RI) KC bands (KC: Kron-Cousins) have the following effective wavelengths: λueff = 0.36μm, λ Beff = 0.43μm. λveff = 0.55μm, λReff = 0.63μm, and λIeff = 0.78μm. CASPROF has 6 diaphragms of different apertures for taking polarimetric measurements; this, in combination with the 2.15 m telescope, results in apertures of 5.0, 11.3, 17.0, 22.6, 33.9, and 45.2 arcsecs. Standard stars from Turnshek et al. (1990) and from Hsu & Breger (1982) were observed several times in each run to determine both the instrumental polarization (less than 0.02% for the whole set of filters) and the zero point of the polarization angle system.
These observations are listed in Table 2, which shows, in a self-explanatory format, the stellar identification, the polarization percentage (Pλ), the position angle of the electric vector (θλ) for each filter, and their respective mean errors, which were computed considering the photon shot noise as the dominant source of errors (Maronna et al., 1992). Stellar identifications were taken from the Catalogue of Luminous Stars (LSS), from 092, or from MM74 in the case of stars in the HD 63077 region.
Table 2 Polarimetric observations
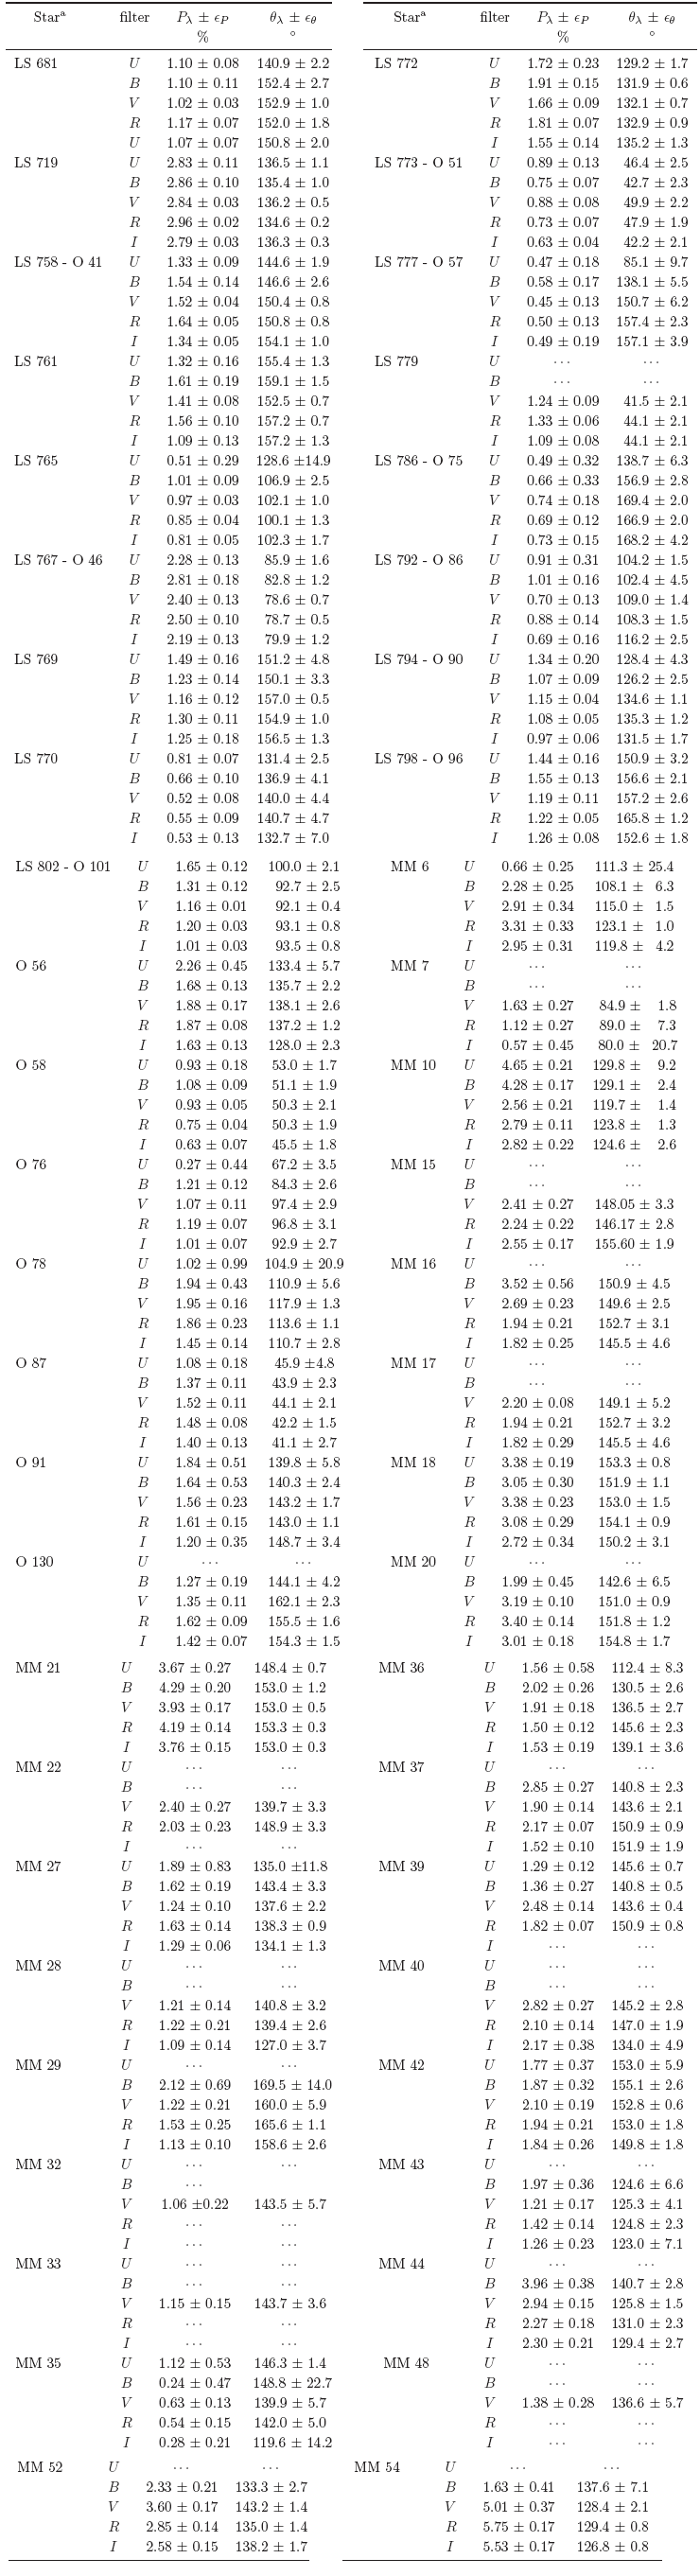
3Luminous Stars Catalogue (LSS), Orsatti (1992; O): or McCarthy & Miller (1974; MM).
3. PHOTOMETRIC AND POLARIMETRIC ANALYSIS
3.1. Photometric analysis
About 120 OB stars in the selected plotted in Figures 1a and 1b. The intrinsic colors and magnitudes were taken from Orsatti's article, or by dereddening photographic observations of MM74, or else by considering the relationships between spectral types and color indexes (Schmidt-Kaler, 1982); we adopted an R = 3.1. Filled circles represent stars with photoelectric magnitudes and colors, while small points represent stars with pho tographic measurements; the crosses represent non-members stars.
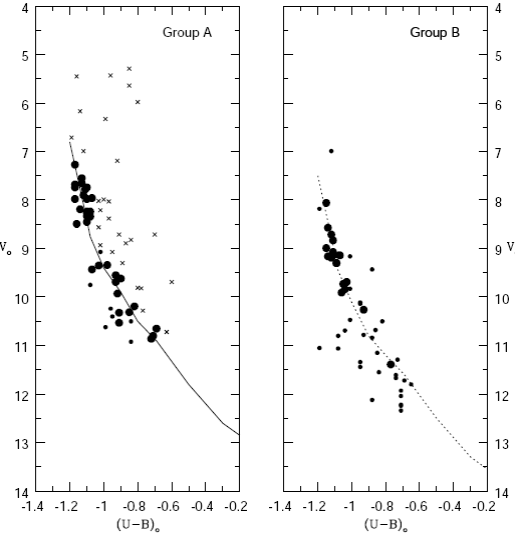
Fig. 1 V 0 vs. (U-B) 0 for members of Group A (Fig. 1a, left plot) and for young stars in Group B (Fig. 1b, right plot). Small points indicate magnitude and colors from photographic photometry, and crosses are used for non-members. The position of the ZAMS for Group A (full line) and a possible ZAMS for stars in Group B (dotted line), are also shown.
Figure la shows the color-magnitude plot V0 vs. (U - B) 0 for a group of 40 young stars, which we identified as Group A. Most of the members come from O92, with the exception of a few stars from MM74. In the figure, the solid line represents the zero age main sequence (ZAMS) for an intrinsic distance modulus V 0 - Mv = 12.1 ± 0.4 mag, i.e., a distance of about 2.6 kpc from the Sun. The youngest star on the ZAMS is 086 (LS 792), with (U - B) 0 = -1.17 and the photoelectric color of an 06 V star; this indicates an age of about a million years. The OB association members are spread over the area, with an important concentration at approximately l = 249.°3, b = -4.°6 (Figure 2, filled circles). It is impossible to provide a value of the mean absorption coefficient, but we can indicate that Av takes values between 2.8 and about 5 mag.
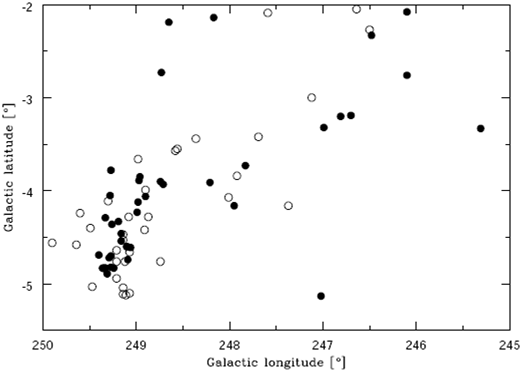
Fig. 2 Distribution of members of Group A (filled circles) and Group B (open circles) in Galactic coordinates.
The rest of the selected stars are located at greater distances. Figure 1b shows the color-magnitude diagram for them; the symbols represent the same as in Figure 1a. Group B includes about 45 OB stars: 17 of them with photoelectric photometry and the rest with photographic photometry. Fitting a ZAMS through these 17 stars would give an intrinsic distance modulus of V 0 - Mv = 13.2 mag, that is, a distance of 4.4 kpc from the Sun, with a similar age than Group A. In Figure 2, the young OB stars are represented by open circles; it can be seen that both groups practically overlaps each other.
The question seems to be: is it another association? We are not sure. Even for the tight OB sequence seen in Figure 1 b, we think the picture is not complete. The OB searches used here have a detection limit defined by the exposure times of the plates, and by the visual crowdings affecting several sectors of the covered by the images. In addition, it is evident that the photographic photometry of MM74 failed to detect the faintest stars. An analysis of the interstellar material using polarimetric observations should shed some light on this issue.
3.2. Polarimetric analysis
Figure 3 shows the plot of the V-band polarization vectors for the observed stars, as well as their orientations; two apparent groupings can be seen at latitudes b ≤ -4.° 65; the polarization angles of the polarization vectors have a similar mean orientation, aligned with the orientation of the Galactic plane in the region θ GP = 150.° 3.
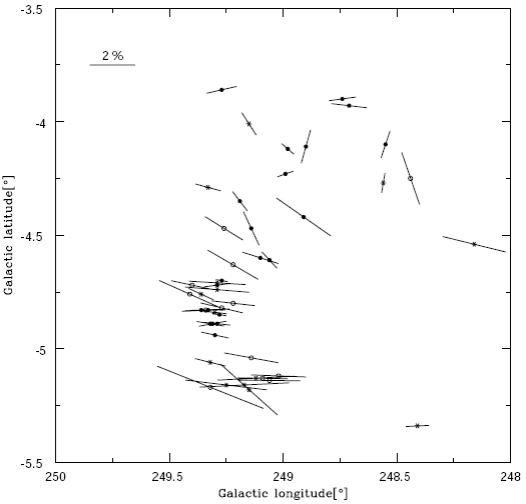
Fig. 3 Polarization vectors (Johnson V-filter) and their orientations for the stars observed in the region. The length of each vector is proportional to the percentage polarization. Filled and open circles are used for members of Groups A and B, respectively; asterisks are used for nonmembers.
However, there is a very irregular distribution of the polarization angles for b ≥ -4.°65. Figure 4 shows a plot of stars, and their polarization vectors, from the catalogue of Heiles (2000) and in the close neighborhood of our region, which is represented by a square. The number of stars from the catalogue is scarce in the interval 244° ≤ l ≤ 254° and -2.°5 ≤ b ≤ -6.° 5, but some of the polarization angles show similar differences in θv. This could be due to the non-uniformity of the magnetic field along the line of view, as found by McMillan & Tapia (1977) in the Cygnus OB2 association. A P u vs. θ u plot (Figure 5) shows considerable position angle rotations of the electric vector in the direction of the main concentrations, with θ u values from 40° to about 135°.
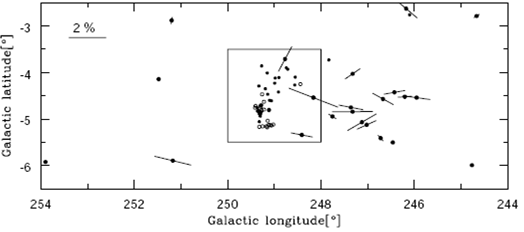
Fig. 4 Polarization vectors and their orientations for stars from the catalogue of Heiles (2000). The length of each vector is proportional to the percentage of polarization. Stars observed in this work are located inside the rectangular area.

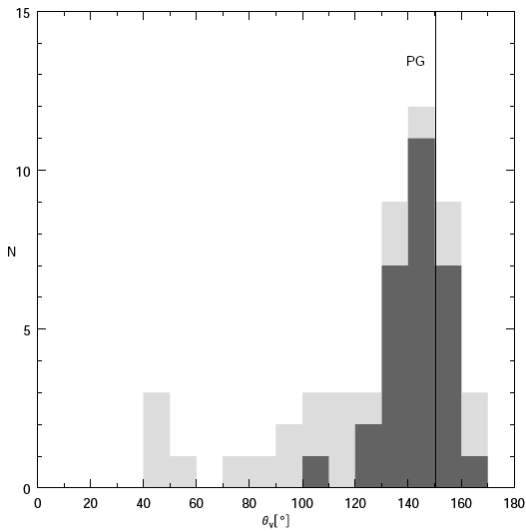
Figure 6 shows in detail the distribution of the polarization angles of the observed stars. The grey bars show that the θv angles vary mainly between 4° and 160°, with a concentration in the range of 100° - 170°. However, if we consider only the stars located south of b = -4.° 65, the new distribution (dark bars) supports the concentration of angles but in the range 120° - 160°, with a peak value around 145°. The vertical line, labelled as GP, is the projection of the Galactic plane in the region θ GP = 150.° 3.
3.3. Fitting with Serkowski's law
If polarization is produced by interstellar dust particles aligned with the Galactic magnetic field, then the observations of interstellar polarization will follow the same curve for all the stars, which is well approximated by an empirical formula (Serkowski 1973). Thus, to analyze the data, the observations performed with the five filters were fit for each star in our sample by using the Serkowski law of interstellar polarization given by
in which star must have a
Table 3 Polarization results and memberships
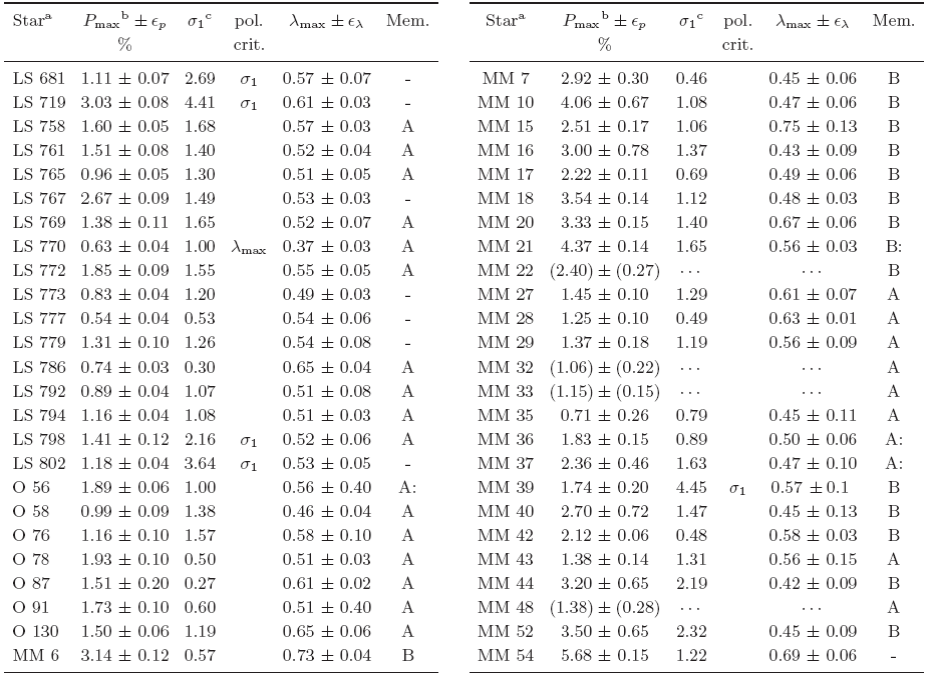
a Luminous Stars Catalogue (LSS), Orsatti (1992; O); or McCarthy & Miller (1994; MM).
bValues between parentheses correspond to the V-filter.
c σ12 = Σ (rλ/ɛ Pλ )2 /(m - 2); where m is the number of colors and rλ = Pλ - Pmax exp(-K ln 2(λmax/λ)).
In addition to interstellar polarization, other mechanisms may cause linear intrinsic polarization. For example, Thomson scattering in a flattened plasma disk around Ae/Be stars (Serkowski, 1968; Coyne & Kruszewski, 1969; etc.), or light scattering by large size grains located in non-spherically distributed dust clouds (e.g., in the light from red giants, red and yellow variables, and other objects; (Coyne & Vrba, 1976; Bergeat et al., 1976; etc.); another possible cause is the combination of both of these mechanisms acting on the light of a single star (e.g. Capps, Coyne & Dick 1973; HD 44179) and of binary stars, especially close binaries.
The σ1 parameter (the unit weight error of the fit; Marraco et al. 1993) contributes to the detection of stars showing indications of non-interstellar polarization. This parameter quantifies the departure of our data from the "theoretical curve" of Serkowski's law. In our schema, when a star exhibits σ1.>1.70, which is an empirical limit, it indicates the presence of intrinsic stellar polarization, that is, a polarization of non-interstellar origin that forms part of the measured polarization. There is a second criterion for identifying intrinsic polarization: individual λmax values. Stars with a much shorter λmax than the average value for the interstellar medium (0.55 μm: Serkowski et al., 1975) are candidates for having an intrinsic component of polarization (Orsatti et al., 1998).
Considering only the stars shown in Table 3 whose Pmax errors are below 15%, we found that six of them have indications of intrinsic polarization. Five were identified using the σ1 criterion; they are: LS 681 (O9 IV) and LS 719 (B7 lab), for which the possible origin of the non-stellar polarization is the scattering of light by the presence of circumstellar material around the stars due to their evolutionary state; LS 798 (an emission-line star) shows scattering of light in an extended atmosphere; stars LS 802 and MM 39, which have high values of the σ1 parameter: 3.64 and 4.45 respectively; they could be some kind of variables or undetected binaries. The second cri terion gives only one star, LS 770 (λmax= 0.37μm). for which there is no information in the literature. Column 4 in the table shows the criterion used to detect the intrinsic polarization.
In principle, interstellar dust alone appears to be responsible for the polarization observed in the light of the rest of the stars, but, in fact, a situation in which a standard Serkowski curve gives a good fit to the observations of a particular star does not exclude the possibility of a different origin for the polarization. This is so because circumstellar shells could be subject to an abnormal wavelength dependence on polarization that resembles the interstellar law in a limited range of wavelength. This is the case of MM20, MM52 and MM54, whose σ1 and λmax have normal values.
In Figure 7, we plot the polarization and position angle dependence on wavelength of three stars (LS 681, LS 802, MM 39); the intrinsic polarization was calculated according to the values of σ1: 2.69, 3.64 and 4.45, respectively. We also present similar plots for stars MM20, MM52 and MM54; their intrinsic polarization was not detected using the σ1 parameter but by their unusual location in other polarimetric plots. In the individual graphs, the solid curves denote the Serkowski polarization relation for the interstellar medium; there is mismatch between the observations and the curves, as well as a wavelength dependent position angle. We can explain these position angle rotations as caused by the superposition of a multi-cloud system with different field directions.
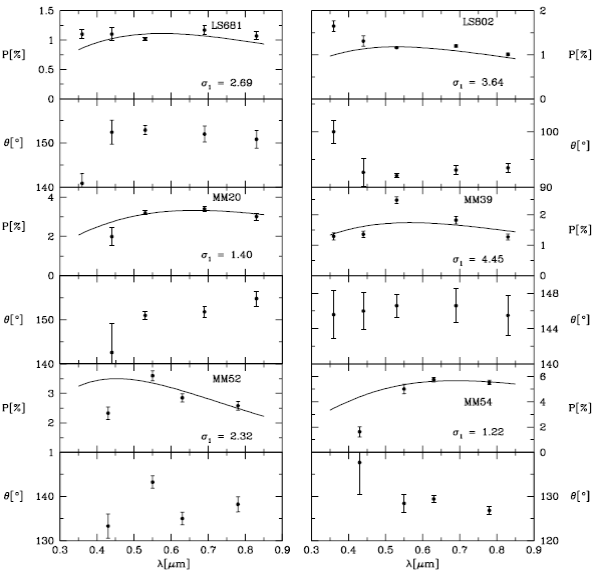
Fig. 7 The plot displays both the polarization and position angle dependence on wavelength, for some of the stars with indications of intrinsic polarization. The solid curve denotes the Serkowski polarization relation for the general interstellar medium (ISM); the value of the σ1 parameter is also shown.
3.4. Polarization efficiency
It is supposed that the same dust that polarizes the light will also redden it, and that what is referred to as the polarization efficiency of the interstellar medium (ISM) (the ratio Pv/E B-V ) is the degree of polarization produced for a given amount of reddening by the intervening dust grains. Assuming a normal interstellar material characterized by Rv = 3.1, the empirical upper limit relation for the polarization efficiency is given by:
(Serkowski et al. 1975). This provides a measure of the efficiency with which the grains are aligned, but there are other factors capable of influencing the result: the number of clouds in the line of sight, the clouds' structure, the homogeneity of the magnetic field, among others.
The polarization of any star that shows higher values than Pv = 9.3E B-V can be immediately sus pected of having a non-interstellar origin. Stars with lower values indicate that the alignment of dust grains is not total (or that it has multiple preferred orientations due to the non-uniformity of the magnetic field along the line of sight), and/or that the grains are only moderately elongated particles (rather than infinite cylinders) that may be irregularly shaped.
Figure 8 shows a very useful polarimetric plot that can be used to analyze star memberships. It shows the Pv vs. E B-V for the polarimetrically observed stars; the solid line represents the empir ical upper limit estimated for interstellar dust particles, assuming an R V = 3.1. Individual color excesses were obtained either from the literature, by dereddening the colors and using the relationship between spectral types and color indexes (Schmidt-Kaler, 1982), or from the spectral types. None of the stars shows higher values than the empirical upper limit.
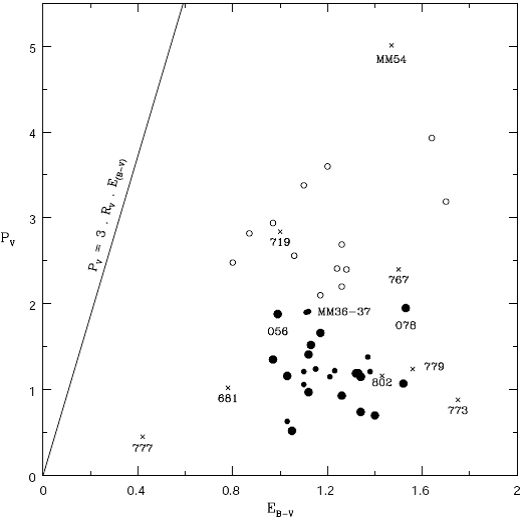
Fig. 8 Polarization efficiency diagram Pv vs. E B-V for stars in the direction of the groups. The line of the empirical maximum efficiency Pv = 9.3 E B-V (solid line) is drawn, adopting Rv = 3.1. Filled and open circles are used for members of Group A and Group B, respectively, crosses for nonmembers.
The figure shows a compact set of stars (0.90 ≤ E B- V ≤ 1.60; 0.50 ≤ Pv ≤ 2.0), as well as other stars with high polarization but similar color excesses. The group with lower polarization includes OB stars from Group A and some luminous stars (LS) in the region (color excesses derived from photoelectric observations are represented by filled circles), as well as stars from MM74 (color excesses from photographic photometry are represented by smaller symbols). Appearing more dispersed in the plot, the figure also shows the position of other stars from MM74 (open circles) and some non-members stars (crosses). Some dispersion in color excess can be seen in Group A, which could be due to the irregular distribution of dust in the region, or to an overestimation of color excesses when taking evolved stars as main sequence stars. Stars O56, O58 and MM36-37 are probable members of Group A. The few stars associated with Group B show a similar dispersion in color excesses.
The ratio P max/E B-V depends mainly on the alignment efficiency and on the magnetic field strength, as well as on the amount of depolarization caused by radiation traversing more than one cloud with different field directions. For the interstellar medium average, Serkowski et al. (1975) found Pmax = 5.03 E B-V , but there are other regions where the value found is smaller, as in Cygnus OB2 which has a.value of 1.7 (McMillan & Tapia, 1977). In our case, working only with Group A stars, we found a polarization efficiency of about 1.25, even lower than that for Cygnus OB2; the strong rotations in θ v, shown in Figure 5, are very probably due to the presence of a number of clouds with different field directions, one of the possible origins of depolarization.
3.5. The Qv vs. Uv plot as a polarimetric tool
The plot of the Stokes parameters Qv vs. Uv for the V-bandpass, where Qv = Pv cos(2θv) and Uv = Pv sin(2θv) are the components in the equatorial system of the polarization vector Pv, is an important polarimetric tool that illustrates the variations occurring in interstellar environments. Since the light from cluster members must have traversed a common envelope of dust with particular polarimetric characteristics, member data points should occupy similar regions in the plot. Non-member (foreground and background) stars should be located somewhat apart from the region occupied by member stars, since their light must have traveled through different dust clouds from those affecting the light of member stars with different polarimetric characteristics.
In open clusters, most of which have projected sizes of a few minutes, this plot has been success fully used for membership identification (Orsatti et al., 2007, 2010, among others), as the characteristics of the interstellar medium associated with them are well defined; however, in the case of stellar associations, the interstellar medium most probably shows variations from one point of the object to another. In this case, there remains the possibility of separating the stars in groups according to the general polarimetric characteristics of the ISM: mean polarization, orientation of the polarization vector and dust grain sizes.
Figure 9 shows the plot of the stars belonging to Groups A and B, represented by filled and open circles respectively; triangles are used for stars with intrinsic polarization, while points represent stars with b ≤ -4.°65. The point of coordinates Qv = 0 and Uv = 0 indicates the dustless solar neighborhood. We see that the interstellar medium associated with Group A is quite homogeneous, as was observed for members of open clusters. The stars in Group B are not so concentrated in the plot, but we must consider that there are polarimetric data for only a few OB members.
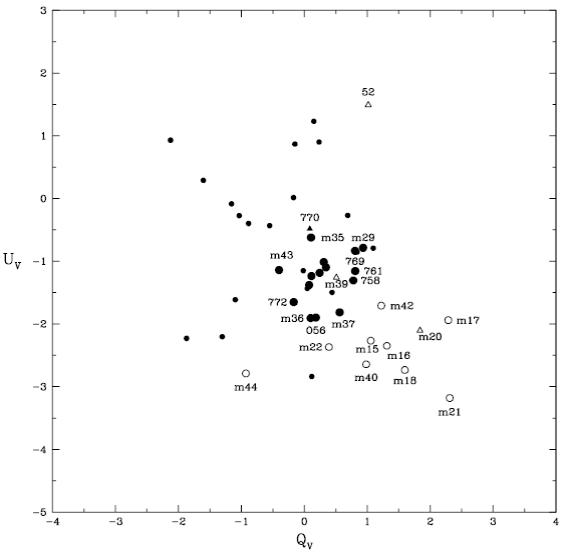
Fig. 9 Qv - Uv Stokes parameters. Filled and open circles are used for members of Group A and Group B, respectively, while triangles are used for stars with intrinsic polarization according to Table 3. Finally, small points represent the position in the plot of the observed stars with b ≥ -4.°65.
From MM stars 27, 28, 32, 33 and 48, we obtained the mean values Pv = 1.21 ± 0.18 (%) and θv = 140.°2±3.°3, which we took as representative parameters of the interstellar medium for Group A. The mean wavelength of maximum polarization amounts to 0.55 μm (mean of five stars), very similar to the mean value for the ISM: λmax = 0.545μ,m (Serkowski et ah, 1975).
For the other aggregate, we selected the MM stars 15, 16, 17, 18, 22, 40 and 42. According to the plot, MM21 is a foreground star. We obtained a mean value of polarization Pv = 2.61 (%), and θv = 149.°5 (mean of 7 stars). The mean wavelength of maximum polarization amounts to 0.53 μm, again very similar to the mean value for the ISM.
The last columns of Table 1 and Table 3 list the proposed star memberships. The photometric observations allowed us to assign each star to a group, and this was later compared with the polarimetric results.
4. CONCLUSIONS
We investigated the possible existence of new OB associations at negative latitudes in the Puppis region. We confirmed one of them, located at a distance of 2.6 kpc from the Sun, with a main concentration at l = 249.°3, b = -4.°6. It is very young and its members are OB stars known from the searches conducted by McCarthy & Miller (1974) and Orsatti (1992). The number of members (40) is under revision due to the detection limits imposed by the plate centers of the thin prism and by exposure times. There is another probable young grouping, at a greater distance (4.4 kpc) with 45 possible members, which partially overlaps the first one in the (l, b) plane.
Polarimetry helped in assigning star memberships taking into consideration the characteristics of the interstellar medium. Using this tool, we found that the polarization efficiency of dust grains to wards the stars in Group A is very low, indicating a poor alignment of the dust grains in the direction of the object, or the presence of other factors such as the number of clouds in the line of sight, the cloud structure, etc. The parameters of the interstellar medium at the central part of the association are Pv = 1.21 ± 0.18 (%) and θ v = 140.°2 ± 3.°3 (both of them from the mean of 5 stars). The dust grains have a normal size, similar to the mean for the ISM (0.55 μm). For the other (possible) group, the lack of reliable measurements of color excesses prevented us from estimating a value of the polarization efficiency. We estimated a higher value of mean polarization (Pv = 2.61 % ) and θ v = 149.°5, as well as normal grain sizes.
Group A is evidently on the Local Arm, but we have doubts about the location of Group B, and even of its existence as a group, as mentioned in § 3.1. This group is on a spur projecting toward the Perseus arm. Kaltcheva et al. (2001) found evidence of a dust cloud possibly located at a distance of about 200-250 pc, towards the region of highest absorption at l = 249°; Av might reach there 5 magnitudes at about 1 kpc. If this dust cloud is the main responsible for the polarization of Group A members (Pv= 1.21%), then there would be another dust cloud between both groups, since the mean polarization for Group В members is higher (Pv = 2.61%). The Qv vs. Uv indicates that the interstellar medium is not the same for both A and В groups.
There is another possibility: that Group A is located on the external border of the Local arm, and Group В on the Perseus arm. If we plot the position of both groups on the four-arm model of Hou & Han (2014), the idea of having them on different galactic arms could be acceptable. We think it is necessary to obtain better information on both groups by including CCD photometry and the spectral types of the most luminous members, as well as radial velocity studies.

