


 nueva página del texto (beta)
 Inglés (pdf)
 Artículo en XML
 Referencias del artículo
 Enviar artículo por email
 Citado por SciELO
  Similares en
SciELO
Similares en
SciELO 
 Permalink
Introduction
The Bay of Campeche is located in the large bay comprising the southern portion of the Gulf of Mexico between the Yucatan Peninsula to the east, the Isthmus of Tehuantepec to the south, and the coast of Mexico at Veracruz to the west. It is enclosed approximately by longitude 91° W on the east, longitude 94° W on the west, latitude 20° N on the north, and the Mexican coast on the south.
The Bay of Campeche is located in a region of moderate to high seismic activity related to the active triple junction between the North American, Caribbean, and Cocos plate boundaries. Therefore, the fixed offshore platforms and subsea structures in the Bay of Campeche must be design against earthquake loading. The most important soil dynamic properties to perform earthquake response analysis include shear wave velocity (Vs), shear modulus (Gmax), material damping ratio (Dmin) at low shear strains (γ) (less than 0.0001 %), and nonlinear shear modulus (G) and material damping ratio (D) as functions of shear strain.
Unfortunately, an engineer responsible for performing earthquake response analysis in the Bay of Campeche sometimes does not have in situ measurements of shear wave velocity, and sometimes the dynamic testing performed with resonant column and strain-controlled cyclic direct simple shear (DSS) is limited and cannot be performed for all the soil layers found in the soil deposit. Therefore, the engineer has to utilize semiempirical correlations to estimate the shear wave velocity, and the available normalized modulus reduction and damping ratio curves either are not based on marine soils or were developed for marine soils from a different geological setting with different soil characteristics from the Bay of Campeche soils.
Therefore, it was necessary to develop a database of classification and index properties tests, in situ measurements of shear wave velocity using downhole P-S suspension seismic velocity logging, in situ piezocone penetration tests (PCPTs), resonant column tests to characterize the shear modulus and material damping ratio at small shear strains (10−5 % to about 0.1 %), and strain-controlled cyclic DSS tests to evaluate the decrease of shear modulus and the increase of material damping ratio at large shear strains (0.1 % to about 10 %) performed on sand from the Bay of Campeche, including sands with no carbonate content to 100 % of carbonate content retrieved from the seafloor to a penetration depth of 120 m below seafloor (BSF). The database was tailored specifically to develop empirical correlations for the Bay of Campeche sands to determine Vs when in situ measurements of Vs are not available and to develop numerical modeling to predict the variation of the normalized shear modulus (G/Gmax) and material damping ratio as a function of shear strains when no dynamic test results are available for all the sand layers.
The semiempirical correlations and the numerical modeling equations developed to determine the most important dynamic soil properties for earthquake response analysis of the marine sands of the Bay of Campeche are presented below.
Shear wave velocity of bay of Campeche sand
Summary of database of shear wave velocity of sand
Data were compiled from 15 sites in the Bay of Campeche, Gulf of Mexico, Mexico where in situ measurements of shear wave velocity and cone tip resistance were available. The water depths at these sites varied between 10.5 m and 80.5 m (Taboada, et al., 2015).
The soil conditions at these sites were investigated by drilling and sampling to a termination depth of 121.9 m BSF. Following completion of the drilling, sampling, and in situ testing activities, downhole P-S suspension seismic velocity logging was performed every 0.5 m from 3.0 m to 121.9 m BSF.
The range, average, and standard deviation of index and mechanical properties of the sands at the 15 sites included in the Bay of Campeche database are presented in Table 1.
Table 1 Summary of index properties of sands at 15 sites.
| Index property | Range | Average | Standard deviation |
| Carbonate content (%) | 0.00 - 48.00 | 10.00 | 8.00 |
| Water content (%) | 7.00 - 53.00 | 28.00 | 7.00 |
| Void ratio | 0.44 - 1.03 | 0.77 | 0.11 |
| Specific gravity | 2.60 - 2.77 | 2.68 | 0.03 |
| Total unit weight (kN/m3) | 17.70 - 20.60 | 19.40 | 0.60 |
| Fines content (%) | 2.00 - 50.00 | 14.00 | 10.00 |
| Relative density (%) | 13.00 - 100.00 | 74.00 | 15.00 |
| Friction angle (degrees) | 25.00 - 40.00 | 32.00 | 4.00 |
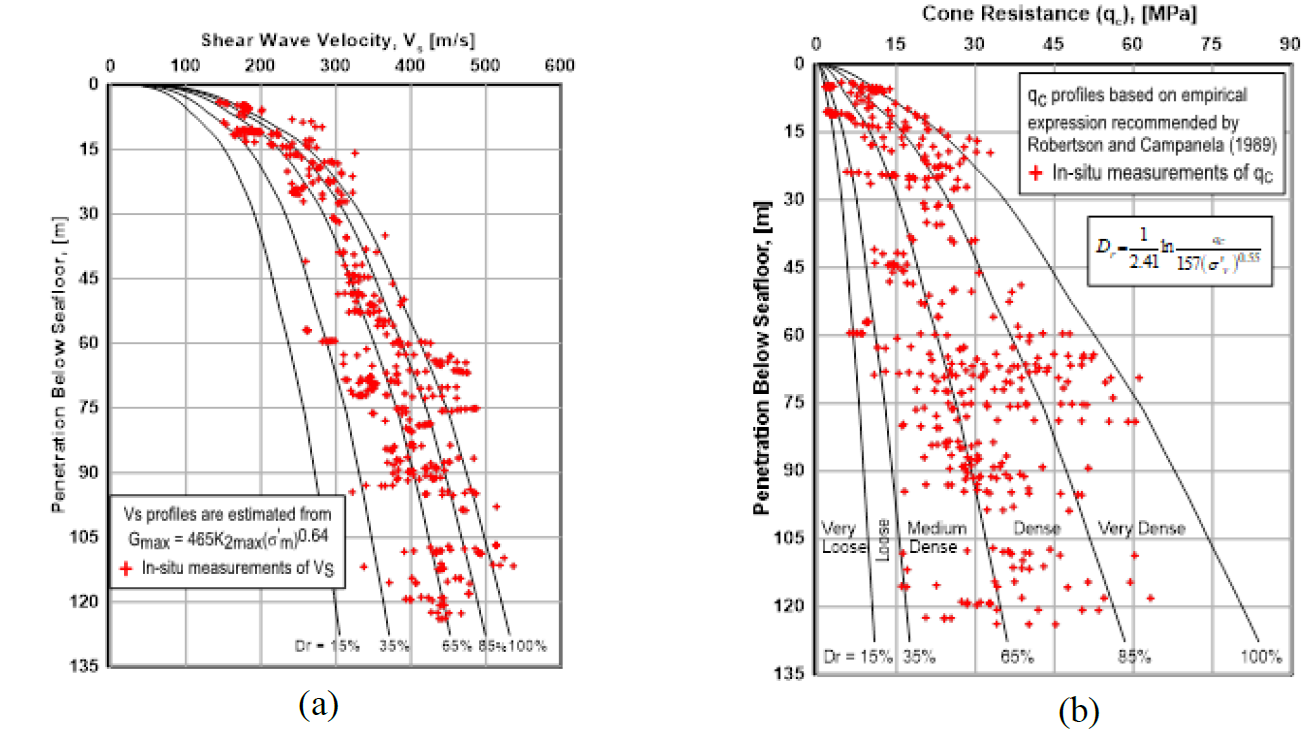
The relative density from the cone tip resistance (qc) is estimated using an empirical expression proposed by Baldi, et al., (1986), which is given below:
where qc and the in situ effective vertical stress (σ’v) are in kPa. This equation applies for normally consolidated moderately compressible, uncemented, unaged quartz sands (with 5 % or less mica by volume). Where appropriate, the cone tip resistance is corrected for the influence of fines content by using the procedures suggested by Lunne, et al. (1997).
A summary of the VS and qc data for the 15 sites is presented in Figure 1. Representative VS values for various Dr for given σ’m calculated from equation (4) are plotted in Figure 1a. Profiles of qc for various Dr for given σ’v calculated from equation (1) are plotted on Figure 1b and give an indication of the state of compaction of the sand strata.
Multiple regression analyses for shear wave velocity of sand
Hardin and Richart (1963) and Richart, et al., (1970) concluded the effective mean normal stress (σ’m) given by equation (2) and void ratio (e) are of paramount importance in determining Gmax.
where, σ’1, σ’2, and σ’3 are the major, intermediate, and minor effective principal stresses, respectively. For field conditions at any given depth, σ’1 = effective vertical stress = σ’v, σ’2 = σ’3 = Koσ’v, where Ko = at rest earth pressure coefficient = 1-sinΦ (where Φ = drained friction angle).
Therefore, an empirical correlation similar to that proposed by Richart, et al., (1970) for rounded sand was developed. The relationship between in situ measurements of Gmax (converted from VS), e, and σ’m for the Bay of Campeche sand developed through least square regression analysis to the n = 325 data sets is:
where Gmax and σ’m are in kPa and the coefficient of correlation r2 is 0.88. The void ratio factor (2.17 − e)2/(1 + e) proposed by Richart and coworkers based on laboratory test data also was found to be valid for the range of void ratios of the Bay of Campeche sand (e = 0.35 − 1.0).
An expression similar to that proposed by Seed and Idriss (1970) that relates Gmax with effective mean normal stress and relative density was developed. The correlation based on Gmax, σ’m, and relative density is defined by:
where Gmax and σ’m are both in kPa, K2max in SI units given by equation (5), the coefficient of determination r2 is 0.922, and the total number of data sets is n = 340. The corresponding values of K2max when Gmax and σo are in SI units (kPa) depend on the relative density of the sand (Dr) and are given by:
Finally, measured values of VS and qc were used to calculate the ratio of normalized shear wave velocity (VS1) to normalized cone tip resistance (qc1). This ratio versus the normalized cone tip resistance is defined by:
where Pa and σ’v are in the same units, VS in m/s, r2 = 0.978, and n=325. The normalized VS is given by:
Application of the most prominent empirical correlations to determine VS in sand
Independent, in situ measurements of VS and qc at a Bay of Campeche site outside of the database provided an opportunity to evaluate the accuracy of the three recommended empirical correlations to predict VS of sand deposits presented in equations (3), (4), and (6). The correlations were directly applied to the best estimate of the correlated parameters. All the results were converted to VS for comparison purposes.
The data shown in Figure 2 indicate good agreement between the measured VS and those inferred from the recommended equations (3), (4), and (6) for the above-mentioned site.

Figure 2 reveals the predictions fall in a rather narrow band, 15 % lower and higher than the measured VS, practically bounding the oscillations of the measured VS.
The accuracy of the three empirical correlations developed to determine the shear wave velocity was investigated and found to be quite good, ± 15 % of the in-situ measurements of VS.
G/GMAX-Γ and D-γ curves of bay of campeche silica sand
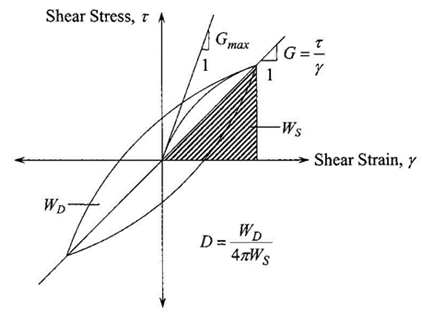
Two of the most important dynamic soil properties required to conduct an equivalent-linear seismic site response analysis to evaluate the soil amplification are: i) a curve of G/Gmax versus cyclic shear strain γ, also called modulus reduction curve, where G is the shear modulus and Gmax is the maximum shear modulus at very low shear strains of the order of 10−4% and ii) a curve of equivalent hysteretic or material damping ratio D versus γ, where D is defined from the measured area (WD) inside a complete hysteretic loop, which corresponds to the energy dissipated in one cycle, and the maximum strain energy stored during one cycle WS, through the basic expression (see Figure 3):
Typically, G/Gmax decreases, and D increases as γ becomes larger, and it has been observed that a fast decrease in G/Gmax with γ, corresponding to a strongly nonlinear soil, is associated with a strong increase of D with γ in the same soil, and vice versa.
In general, G/Gmax increase when the confining pressure (σm) increases. A simple way of explaining this trend is by focusing on the dependence of the shear modulus (G) on σm. The maximum shear modulus is defined as Gmax= A σm m, where m = 0.4 to 0.5 and A is a constant. For an isotropically consolidated sand, Coulomb’s strength law indicates the shear strength (τmax) increases linearly with σm (τmax = σm sinΦ for pure shear loading, where Φ = angle of internal friction of the soil). Because G = τ/γ (Figure 3), at large strains, G = τmax/γ = σm sinΦ /γ; that is, G increases linearly with σm at large strains, whereas G = Gmax increases approximately with σm 0.5 at small strains. Therefore, G/Gmax is proportional to σm 1−m ≈ σm 0.5, and as σm increases, G/Gmax increases. Conversely, the damping ratio (D) decreases.
It is generally difficult by any means to perform in situ tests in which large strains are imposed uniformly in the soil as it exists in the field. In realization of this, most recent efforts to pursue the strain dependency of modulus and damping of in situ soils have been directed toward the conduct of laboratory tests on undisturbed samples that are regarded as representing intact conditions in the field.
Unfortunately, it is not always possible to perform dynamic laboratory testing to obtain the shear modulus reduction curve and material damping ratio curve of all the soil strata found in the offshore soil deposit, and the geotechnical engineer is left to use curves developed mainly for onshore soils with different geological settings than those of the Bay of Campeche sand. Therefore, a characterization of the cyclic stress-strain response of the sand in shear that facilitates prediction of the shear modulus reduction curve and material damping ratio curve of sands of the Bay of Campeche is needed.
To cover this need, a database has been established and tailored for an equivalent linear characterization of the cyclic response of sand units in the Bay of Campeche. The data have been collected from offshore soil investigations performed between 2012 and 2015, which include abundant results of resonant column tests and cyclic DSS tests.
Summary of database of normalized shear modulus G/Gmax-γ and damping D - γ of silica sand
The existing laboratory G/Gmax and D data of silica sand used in this study that include isotropically consolidated resonant column and strain-controlled cyclic DSS test results for 252 specimens of sand.
Histograms of the 252 specimens with respect to the water content, void ratio, relative density, fines content, carbonate content, confining pressure, coefficient of earth pressure at rest, and submerged unit weight of the specimen are presented in Figure 4. As shown in Figures 4a and 4b, most of the water content and void ratio of the specimens vary in the ranges of 20 % to 30 % and 0.6 to 0.8, respectively.
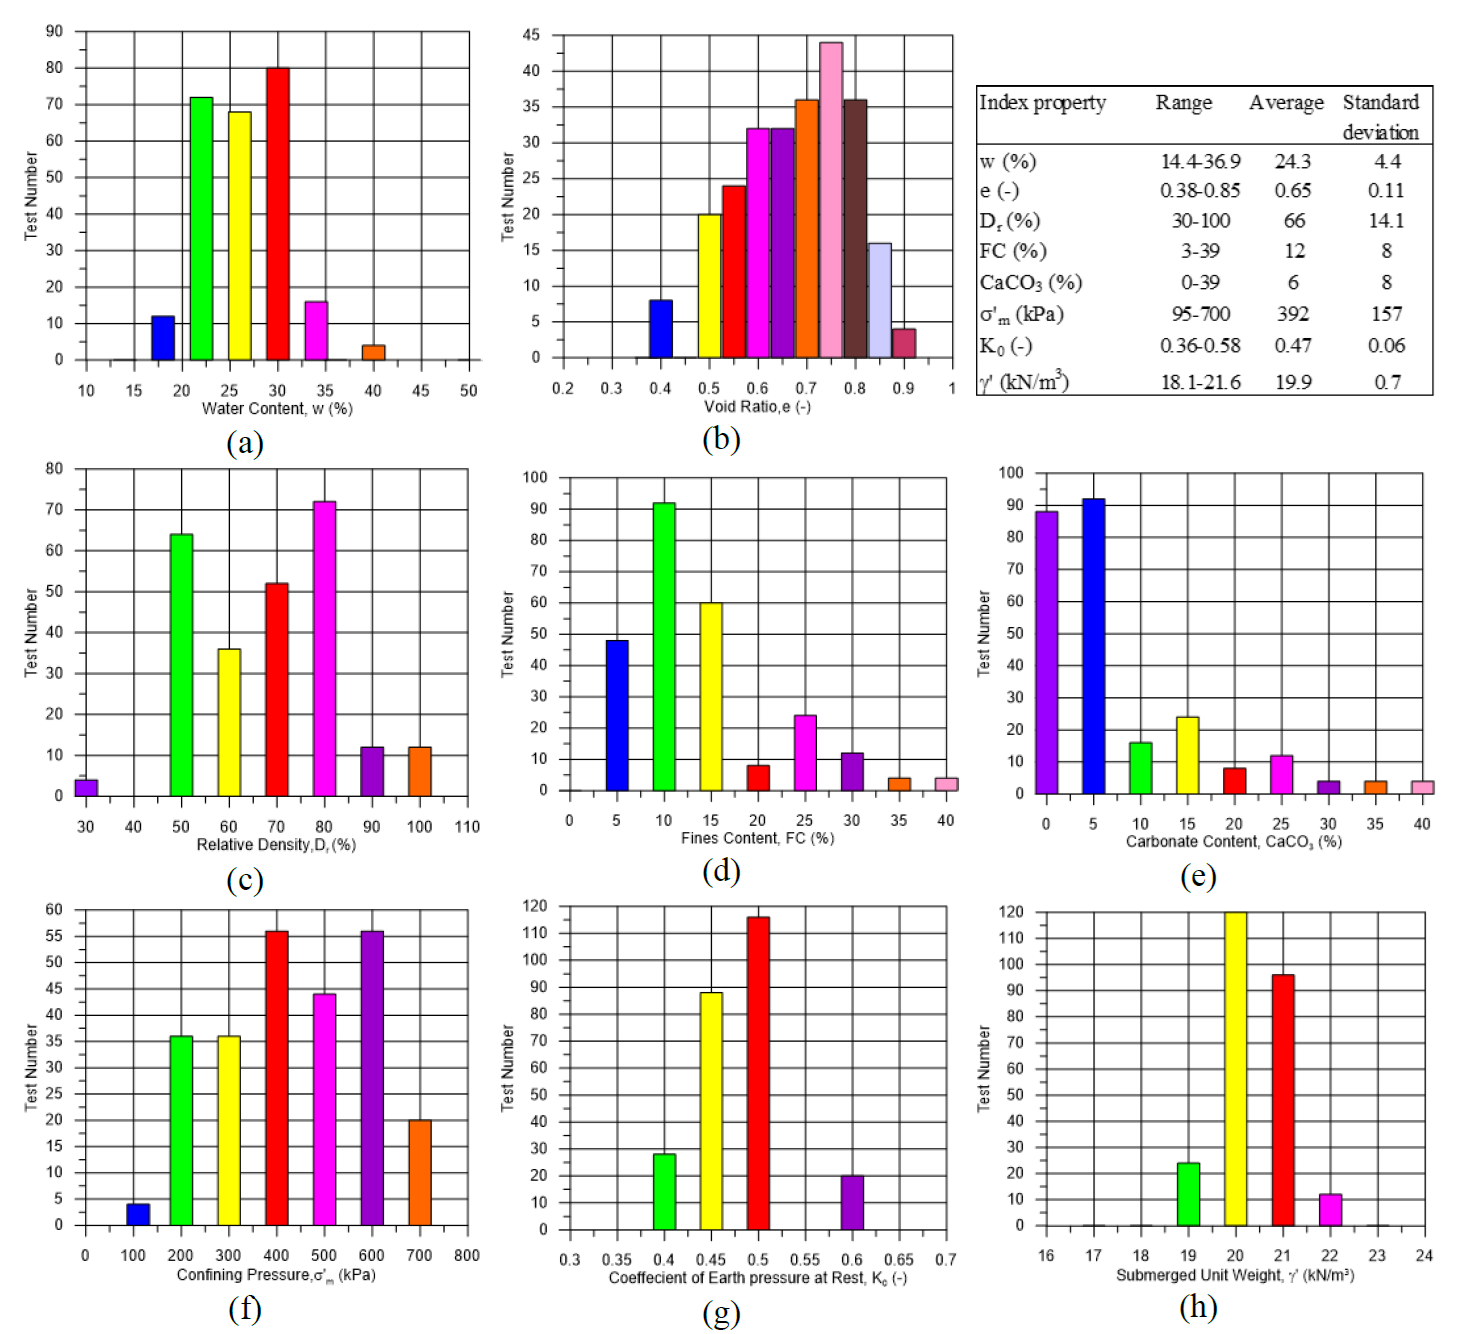
The relative density of the specimens (presented in Figure 4c) is mostly dense in the range of 50 % to 80 %, with only 4 loose specimens with relative density below 35 % and 24 very dense specimens with relative density higher than 85 %. About 55 % of the specimens had a fines content in the range of 5 % to 10 % (Figure 4d), classified as sand with silt, and about 45 % of the specimens had a fines content higher than 12 % but less than 40 %, classified as silty sand.
According to the carbonate content shown in Figure 4e, about 70 % of the soil specimens are siliceous sands with carbonate content less than 10 %, and the rest of the specimens are calcareous sands with carbonate content between 10 % and 40 %. The effective confining pressures presented in Figure 4f are between 100 kPa and 700 kPa, with an average of 400 kPa.
The coefficient of earth pressure at rest is mostly between 0.45 and 0.5, as observed in Figure 4g, while the submerged unit weight presented in Figure 4h is mostly between 20 kN/m3 and 21 kN/m3.
Resonant column tests were performed on solid cylindrical soil specimens approximately 38 mm in diameter and 76 mm in length. Each test specimen was back-pressure saturated to about 140 kPa and then isotropically consolidated to 0.5, 1.0, and 2.0 times the in situ effective confining pressure.
Strain-controlled cyclic DSS tests were conducted on soil specimens of approximately 18 mm to 19 mm in height and trimmed to approximately 50 mm in diameter. Each granular test specimen was consolidated to an effective vertical consolidation stress equal to the estimated in situ effective vertical stress. Each test specimen was allowed to consolidate to about one log cycle of time or 24 hours, whichever was less, past the end of primary consolidation (T100) before applying 20 cycles of sinusoidal cyclic horizontal loads at a frequency of 1.0 Hz (for earthquake loading conditions). The test was conducted while maintaining the specimen at a constant volume, with the pore pressures estimated by measuring the changes in the vertical stress during cycling. Each specimen was subjected to a specified nominal average cyclic shear strain of 0.25 %, 0.5 %, or 1.0 %.
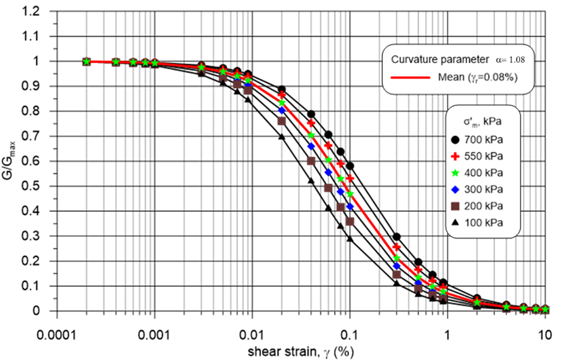
In order to comprehend the non-linear elastic behavior of marine sands and to produce a best-fit functional relationship, a new database has been constructed incorporating G/Gmax-γ and D-γ curves from the Bay of Campeche sand (Taboada, et al., 2016). This curve-fitting process facilitates prediction of shear modulus degradation curves and material damping curves. The relationship between normalized shear modulus (G/Gmax) and shear strain (γ) for the 252 selected tests is plotted in Figure 5.

Modeling of normalized shear modulus degradation curve G/Gmax-γ of silica sand
The non-linear stress-strain behavior of soils at small to medium strains is mostly represented by some form of hyperbolic stress-strain relationship. Harding and Drnevich (1972) propose this relationship as:
where G is the shear modulus at any strain, Gmax is the maximum shear modulus at γ = 0.0001%, and γr is the reference shear strain, which is defined by τmax/Gmax. The disadvantage of this approach is the difficulty in finding τmax. The authors also indicated this true hyperbolic relationship did not generally fit their data (Harding and Drnevich, 1972).
Darendeli (2001) proposed a modified hyperbolic model based on testing on intact sand-gravel samples:
where α is called the curvature parameter and γr is the reference
strain value at which G/Gmax = 0.5. This model uses only two
parameters, and the reference strain provides an efficient normalization of
shear strain. Equation (10) is
adopted in this study to model the variation of G/Gmax with γ. For
the sake of simplicity, the curvature parameter (α) is assumed independent of
the effective confining pressure (
The best-fit functional relationship for the shear modulus degradation database is shown in Figure 5 as a modified hyperbolic equation in the form proposed by Darendeli (2001) and presented in equation (10). The mean, lower-bound, and upper-bound curve-fitting parameters are:
Lower bound: γr = 0.044 % and α = 1.08
Mean: γr = 0.080 % and α = 1.08
Upper bound: γr = 0.140 % and α = 1.08
where γr is the reference shear strain (shear strain at G/Gmax = 0.5) and α is the curvature parameter, as already defined in equation (10).
For the most common confining stresses (70 kPa to 700 kPa), the Bay of Campeche sands of this database produce a regression for γr as follows:
The resulting family of degradation curves using equation (10), varying
Modeling of material damping ratio curve D-γ of silica sand
The best-fit functional relationship for the material damping ratio data for the 252 selected tests is shown in Figure 7 as a modified hyperbolic equation similar to that proposed by Gonzalez and Romo (2011) in the form:
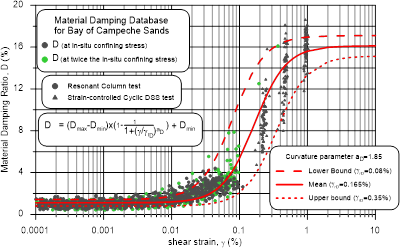
where Dmax and Dmin are the maximum and minimum material damping ratios, respectively; γrD is the deformation corresponding to 50 % of increase in material damping ratio D (i.e., D/Dmax = 0.5); and aD is a curvature parameter characteristic of the curve D-γ.
For the sake of simplicity, the curvature parameter (aD) is assumed
independent of the effective confining pressure (
According to the database curve fitting in Figure 7, the mean, lower-bound, and upper-bound curve-fitting parameters are:
Lower bound: γrD = 0.080 % and αD = 1.85
Mean: γrD = 0.165 % and αD = 1.85
Upper bound: γrD = 0.350 % and αD = 1.85
The Bay of Campeche sands of this database produce regression for γrD as follows:
The trend of minimum material damping ratio (Dmin) with normalized effective confining pressure produces a regression for Dmin as follows:
A simple linear relation can be derived between (Dmax - Dmin) and normalized effective confining pressure using all the available data, as:
The resulting family of material damping curves using equation (12), varying

Validation of normalized shear modulus (G/Gmax) and material damping ratio (D) of sand
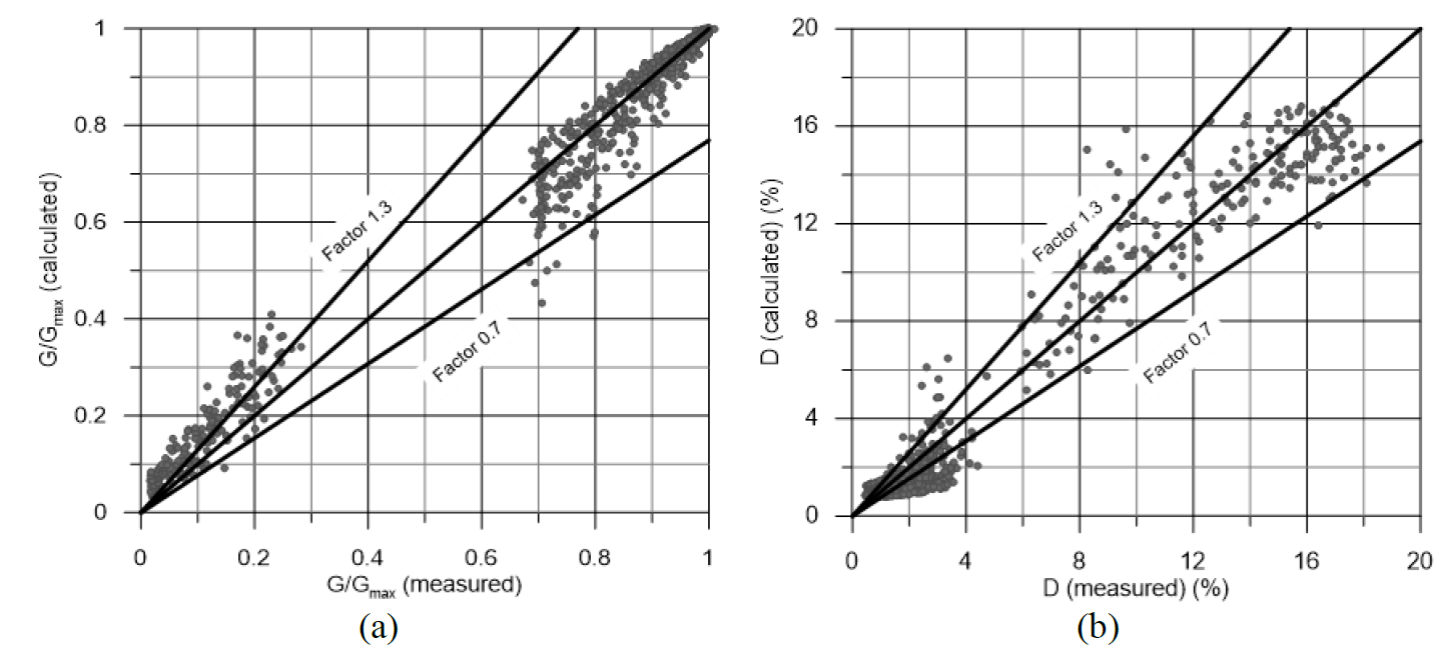
Comparison between measured and predicted values can be validated against the database. G/Gmax and D between predictions and measurements can best be assessed by plotting predicted against measured values for the 936 data points accumulated from all the tests. This is presented in Figure 9a for G/Gmax, where it can be seen that 85 % of the predictions lie within a factor of 1.3 and 0.7 from the measurements and values of G/Gmax less than 0.2 are being overpredicted. The same is presented for D in Figure 9b, where it can be seen that 80 % of predicted values lie within a factor of 1.3 and 0.7 from the measurements and values of D less than 4 % are being underpredicted.
Comparison of calculated G/Gmax and D curves of sand with previously published curves
The calculated G/Gmax and D curves for Bay of Campeche sands are compared with Seed and Idriss (1970), Vucetic and Dobry (1991), and Darendeli (2001) in Figure 10. The recommended curves for σm’ of 100 kPa are shown in Figure 10 because the Vucetic and Dobry (1991) curves and the Seed and Idriss (1970) curves are primarily based on specimens from shallow depths (< 10 m) and are most appropriate for low confining levels corresponding to shallow depths (Roblee and Chiou, 2004). Seed and Idriss (1970) published the first database of shear modulus degradation curves and damping ratio curves for sand for the purpose of earthquake site-response analysis. The recommended G/Gmax curve for Bay of Campeche sand presented in Figure 10 for σm’ of 100 kPa falls well between the range of G/Gmax proposed by Seed and Idriss (1970). The recommended damping ratio curve for the Bay of Campeche sand at the same effective confining pressure presented in Figure 10b closely follows the lower-bound damping curve of Seed and Idriss (1970) up to a shear strain of 0.3 %, and for shear strains higher than 0.3 % and in the range of 0.003 % to 0.07 %, the damping of the Bay of Campeche sand is lower than the lower bound of Seed and Idriss (1970).
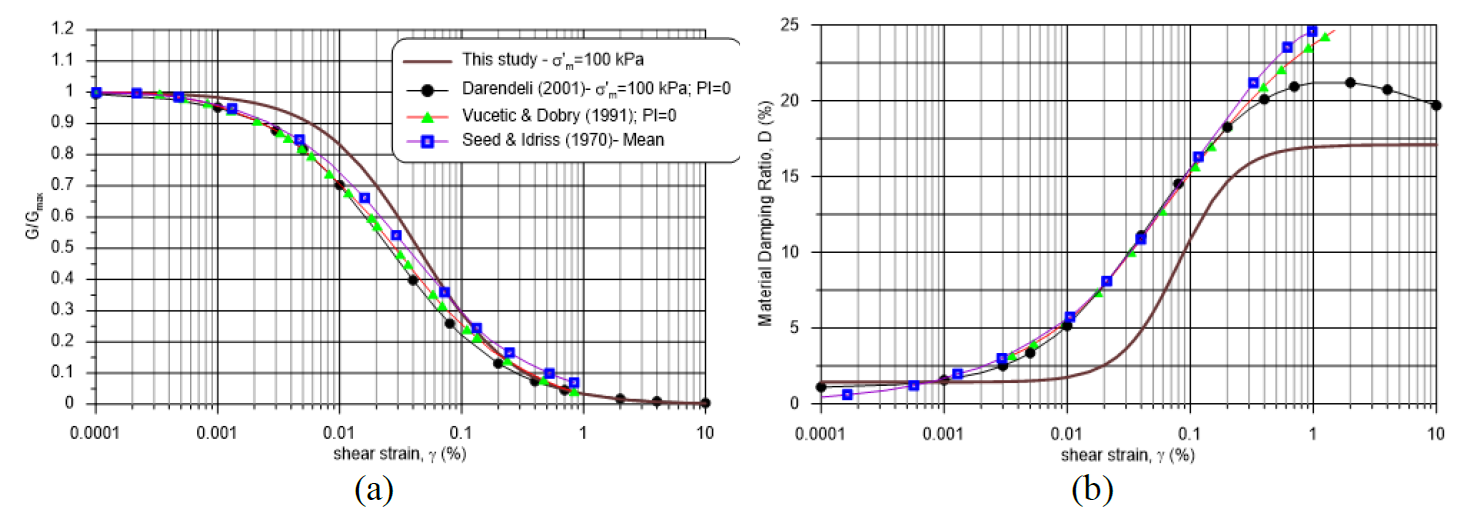
Figure 10 Comparison of recommended G/Gmax and D curves of sand for σ’m=100 kPa with Seed and Idriss (1970), Vucetic and Dobry (1991), and Darendeli (2001) curves
For shear strains lower than 0.09 %, the recommended G/Gmax curve for Bay of Campeche sand for σ'm of 100 kPa (presented in Figure 10a) is more linear than Darendeli (2001) G/Gmax curve and Vucetic and Dobry (1991) for PI = 0. For shear strains higher than 0.09 %, the recommended G/Gmax curve of Bay of Campeche sand is slightly lower than mean of Seed and Idriss (1970) and Vucetic and Dobry (1991) curves. For shear strains higher than 0.001 %, the recommended damping ratio curve for the Bay of Campeche sand for σm’ of 100 kPa (presented in Figure 10b) is lower than both Darendeli (2001) and Vucetic and Dobry (1991) damping curves and Seed and Idriss (1970) mean damping curve.
G/GMAX-Γ and D-γ of bay of campeche calcareous sand
Summary of database of G/Gmax-γ and D - γ of calcareous to carbonate sand and silt
The database of G/Gmax and D curves used in this study was developed based on sands and silts with carbonate content higher than 10 % retrieved from the Bay of Campeche and Tabasco Coastline during geotechnical campaigns performed between 1993 and 2015 (Cruz, et al., 2015). The database contains test results of isotropically consolidated resonant column and strain-controlled cyclic DSS tests. The number of cycles of loading (N) of the cyclic DSS data is N=15.
Figure 11 shows histograms of 106 specimens, including graphs of carbonate content, fines content, and applied effective confining stress of Bay of Campeche calcareous to carbonate sand database. This figure shows that more than 40 % of the data presented carbonate content higher than 70 % (Figure 11a), with fines content concentrated in the range of 10 % to 35 % (Figure 11b), and the effective confining pressure applied to the specimens varied from 40 kPa to 1100 kPa (Figure 11c).
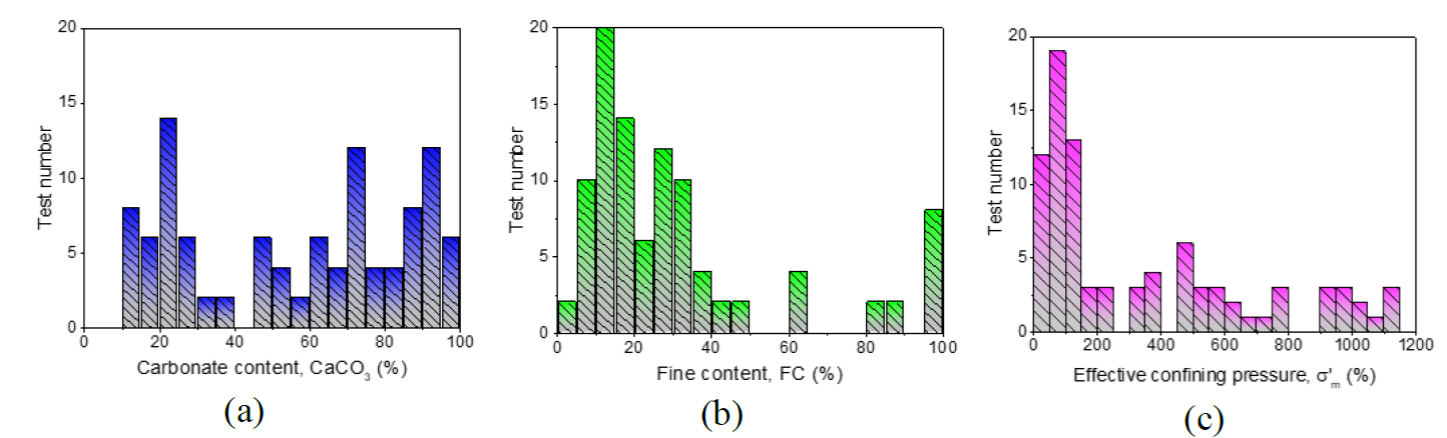
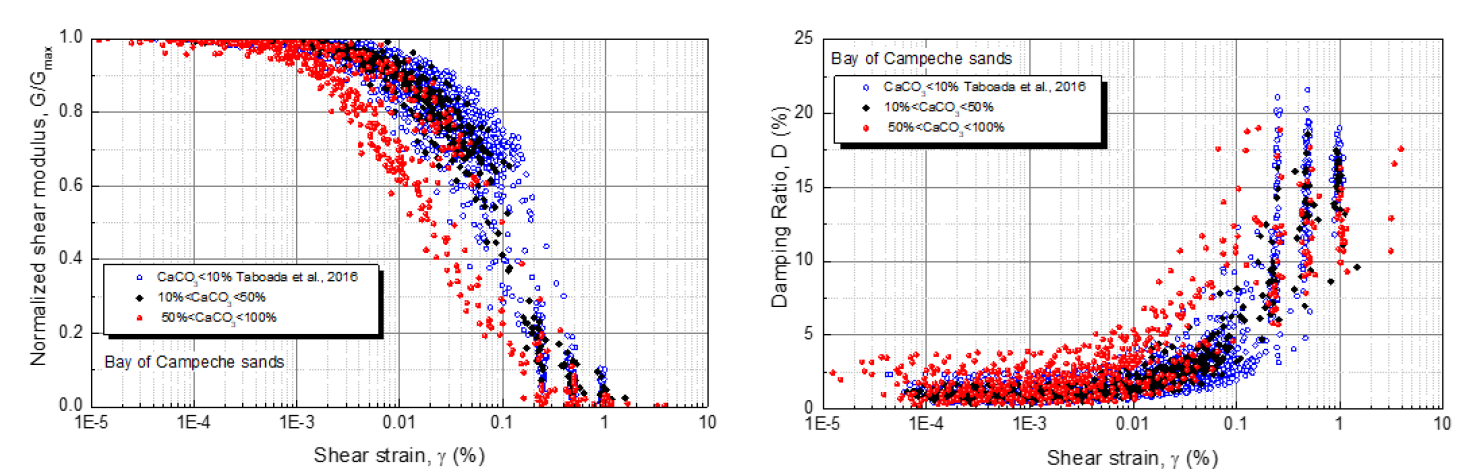
Figure 12 shows the database of the Bay of Campeche and Tabasco Coastline sand of 84 curves of G/Gmax and material damping ratio (D) obtained from resonant column and cyclic DSS tests organized into two groups with carbonate content between 10 % to 50 % and 50 % to 100 % (Flores, et al., 2018). Figure 12 also presents a comparison of G/Gmax and D curves with carbonate content higher than 10 % and curves of silica sands (CaCO3 less than 10 %) of the Bay of Campeche presented by Taboada, et al. (2016). The G/Gmax curves of sands with CaCO3 higher than 10 % show a higher non-linear behavior than the silica sands. That is, G/Gmax of carbonate sands starts to decrease at smaller cyclic shear strains than the silica sands. The damping ratio of carbonate sands is higher than silica sands, especially at cyclic shear strains smaller than 0.1 %. Figure 12 shows that as CaCO3 increases, the G/Gmax curve tends to shift downward and the damping ratio curve tends to shift upward.
Modeling of G/Gmax-γ of calcareous to carbonate sand and silt
Equation (10) was used to model the normalized shear modulus degradation curve G/Gmax-γ, the curvature parameter (α), and reference strain γ r that best fit the mean, upper-bound (UB), and lower-bound (LB) curves of G/Gmax. These values were computed by regression analysis and are presented in Table 2 and in Figure 13 for calcareous sand, siliceous carbonate sand, carbonate sands, and silt with carbonate content between 10 % and 100 %. For simplicity, α was assumed constant and independent of effective confining pressure (σ´m) and its values are reported in Table 2.
Table 2 Parameters to best fit the curves of G/Gmax and damping ratio of sands and marine silts
| Type of soil | G/Gmax | Damping ratio, D | ||||||||
|---|---|---|---|---|---|---|---|---|---|---|
| α | γr (%) | α D | γrD (%) | Dmin (%) | Dmax (%) | |||||
| Mean | LB | UB | Mean | LB | UB | |||||
| Calcareous sand | 1.149 | 0.088 | 0.042 | 0.178 | 1.301 | 0.197 | 0.224 | 0.177 | 1.280 | 17.134 |
| Siliceous carbonate sand | 0.932 | 0.037 | 0.013 | 0.117 | 1.301 | 0.045 | 0.072 | 0.025 | 1.861 | 12.007 |
| Carbonate sand | 0.924 | 0.032 | 0.010 | 0.102 | 1.453 | 0.052 | 0.079 | 0.032 | 1.476 | 12.363 |
| Silt (calcareous, siliceous carbonate and carbonate) | 1.000 | 0.057 | 0.011 | 0.217 | 1.053 | 0.068 | 0.095 | 0.048 | 1.053 | 11.898 |
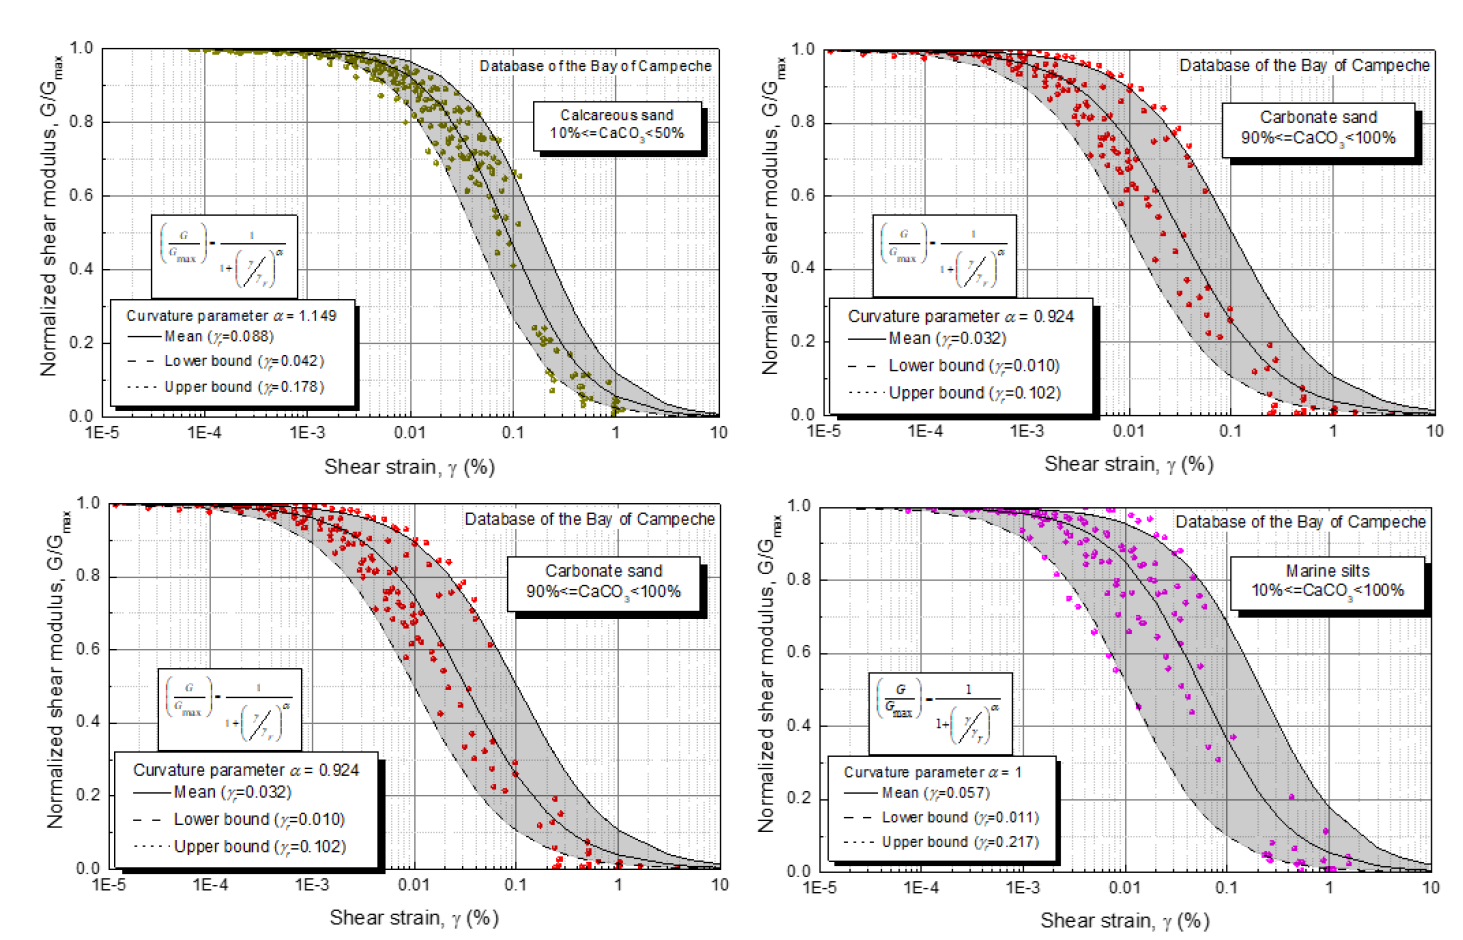
Figure 13 G/Gmax - γ curves of (a) calcareous sand, (b) siliceous carbonate sand, (c) carbonate sand, and (d) silt
The relationship between the reference strain and the normalized effective
confining pressure σ´m with respect to the atmospheric pressure
(Pa) of sands with different carbonate content was obtained. The
equations for calcareous sand, siliceous carbonate sand, and carbonate sand that
relate γ
r
with σ´m normalized with the atmospheric pressure (
Figure 14 shows the variation of the normalized shear modulus as a function of the effective confining pressure varying between 100 kPa and 1000 kPa for siliceous carbonate sand. The constant value of α (i.e. independent of effective confining pressure) presented in Table 2 was used to develop the curves of normalized shear modulus as a function of effective confining pressure presented in this figure.
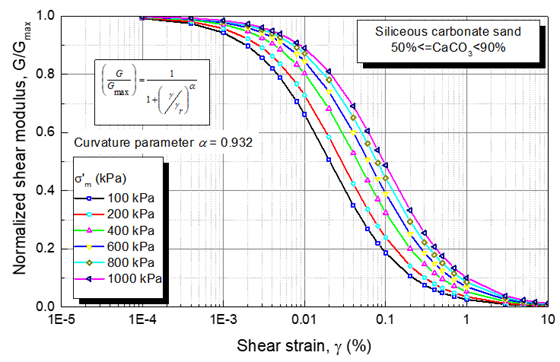
Figure 14 G/Gmax predicted with equations 14 and 20 as a function of σ´m for siliceous carbonate sand
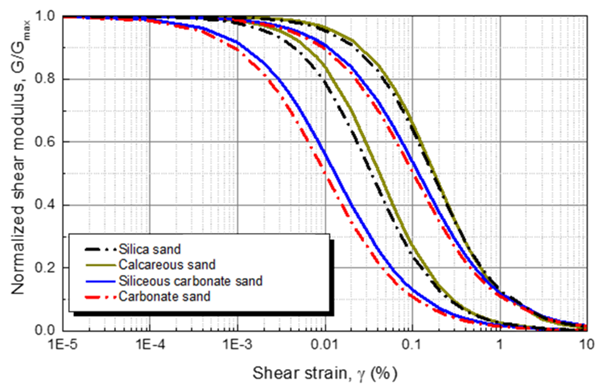
Figure 15 presents a comparison of the upper and lower bounds of G/Gmax versus shear strain for silica sand, calcareous sand, siliceous carbonate sand and carbonate sand. The upper and lower bounds of G/Gmax of silica sand are very similar to those of calcareous sands. This indicates that G/Gmax is not significantly affected when the carbonate content is less than 50%. The upper and lower bounds of G/Gmax of siliceous carbonate and carbonate sand are very similar, and very different than the calcareous and silica sand. This indicates that G/Gmax is affected when the carbonate content is higher than 50%.
Modeling of D-γ of calcareous to carbonate sand and silt
The database of calcareous sand, siliceous carbonate sand, carbonate sand, and silt with carbonate content between 10 % and 100 % is presented in Figure 16. Equation (12) was used to define the upper bound, mean, and lower bound of the curves of damping versus shear strain presented in this figure. The values of the curvature parameter (α D ) and reference strain γ rD for these three curves as well as the values of D min and D max that define the mean curve of damping ratio versus shear strain obtained from regression analyses are presented in Table 2. For simplicity, αD was assumed constant and independent of effective confining pressure (σ´m), and its values are reported in Table 2.
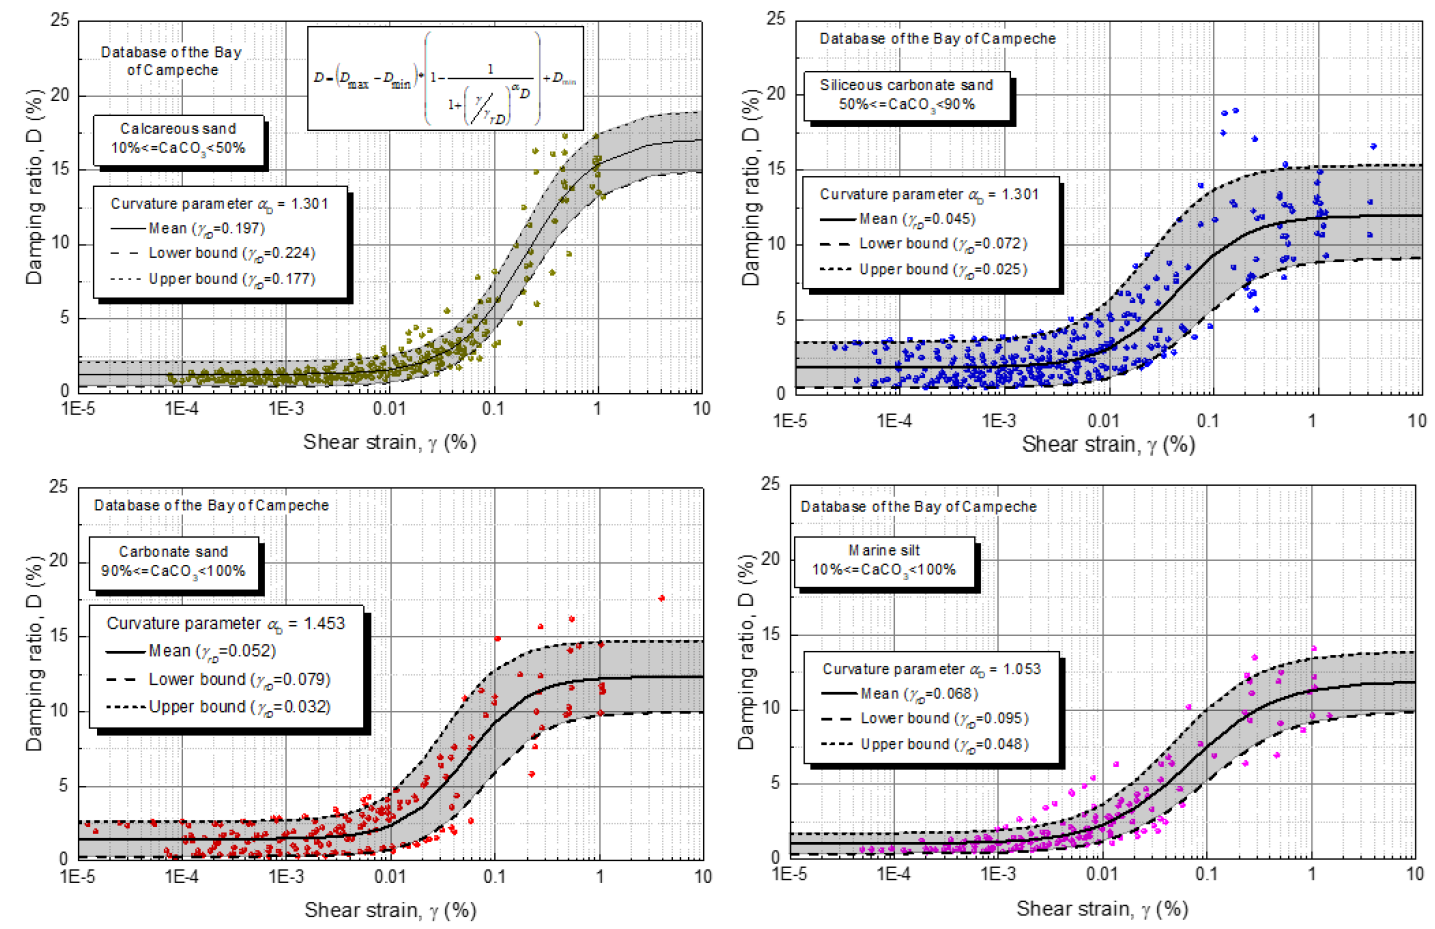
Figure 16 Curves of D-γ of (a) calcareous sand, (b) siliceous carbonate sand, (c) carbonate sand, and (d) marine silts
The relationships found between γ rD and normalized effective confining pressure for calcareous sand, siliceous carbonate sand, and carbonate sand are presented below:
The relationships between minimum material damping ratio (D min ) with normalized confining pressure presented for carbonate sand, siliceous carbonate sand, and carbonate sand are:
The relationships between D max − D mín with normalized effective confining pressure for calcareous sand, siliceous carbonate sand, and carbonate sand are described by the following equations:
Figure 17 shows the variation of material damping ratio versus cyclic shear strain with effective confining pressure for siliceous carbonate sand. The curvature parameter (α D ) was considered independent of the effective confining pressure, and its constant value is presented in Table 2.
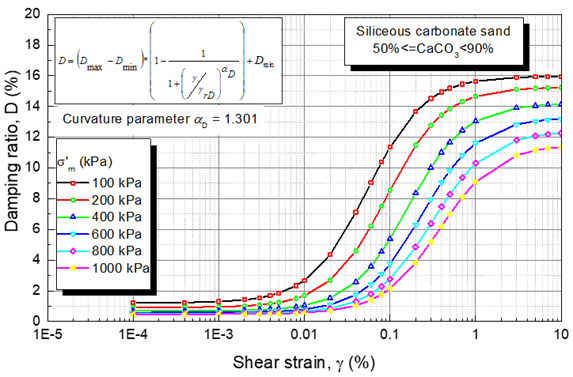
Figure 17 Prediction of D-γ with equations (16), (21), (22), and (23) for various σ´m for siliceous carbonate sand
Figure 18 shows a comparison of the upper and lower bounds of damping ratio versus shear strain for silica sand, calcareous sand, siliceous carbonate sand, and carbonate sand of the Bay of Campeche and Tabasco Coastline. The damping curves of silica sand and carbonate sand are very similar, although the bandwidth is smaller in calcareous sand than in silica sand. The curves of siliceous carbonate sand and carbonate sand are very similar and show a different shape and width than the curves of silica sand and calcareous sand. This indicates there is a small effect on the curve of damping ratio when the carbonate content is smaller than 50 % and an important effect when the carbonate content is greater than 50 %. The damping ratio of siliceous carbonate and carbonate sands is higher than the calcareous and silica sands at shear strains smaller than about 0.1 % and shows an asymptotic value at shear strains larger than 0.4 %.

Validation G/Gmax and material damping ratio (D) of calcareous to carbonate sand
Figure 19a shows the comparison of 902 measurements of G/Gmax using resonant column and strain-controlled cyclic DSS and calculated values of G/Gmax using equations (10) and (16) for the three ranges of carbonate content of sand considered in this study (calcareous sand, siliceous carbonate sand, and carbonate sand). This figure shows a 1:1 line illustrating that the calculated value is equal to the measured value and this line multiplied by a factor of 0.7 (30 % underprediction) and 1.3 (30 % overprediction). There is excellent agreement between the measured and calculated values of G/Gmax for the case of resonant column data (G/Gmax = 1.0 to G/Gmax = 0.2). The measured values of G/Gmax with strain-controlled cyclic DSS tests are over predicted in most of the cases, especially for measured values of G/Gmax < 0.1.
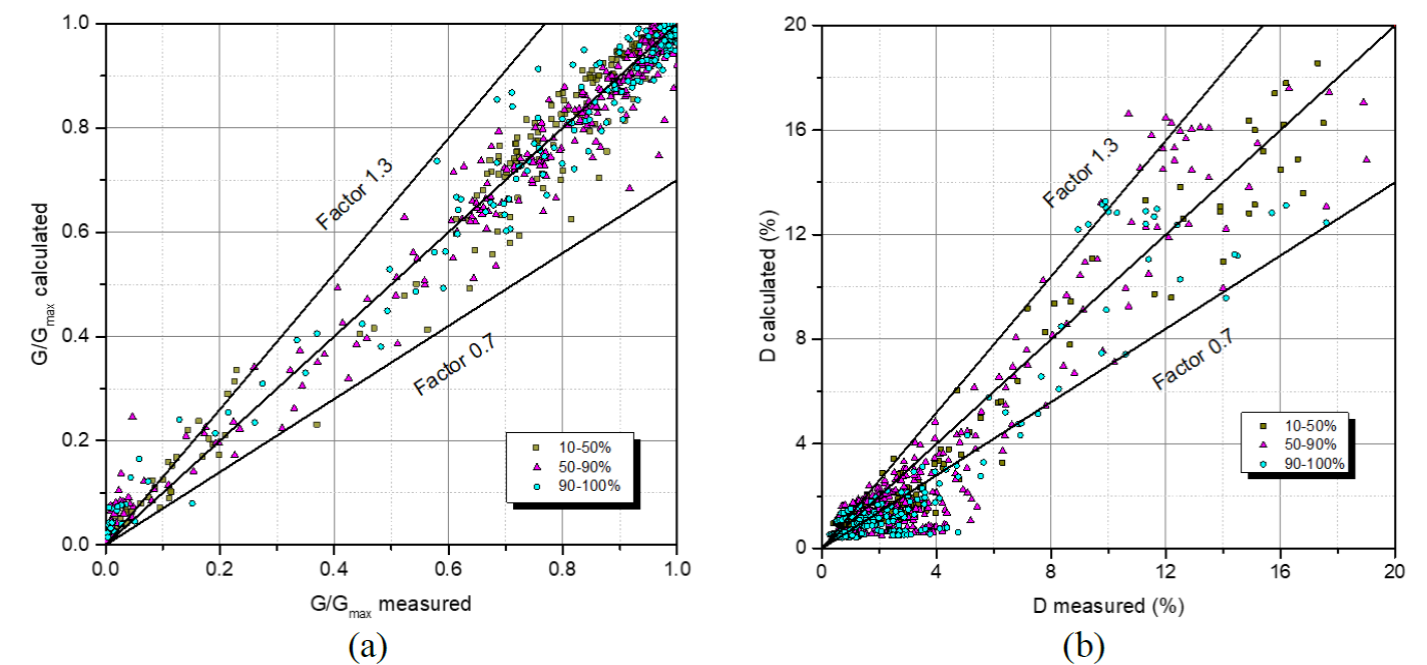
Figure 19 Measured and predicted G/Gmax and D for carbonate sand, siliceous carbonate sand, and carbonate sand
Figure 19b presents the measured versus
predicted damping ratio for calcareous sand, siliceous carbonate sand, and
carbonate sand for a total of 902 measured points. A good prediction is observed
when the measured damping ratio is greater than 4 %, mostly falling within a
band of
Conclusions and recommendations
A database of in situ VS measurements with a P-S suspension seismic velocity logger and standard geotechnical engineering material properties for the Bay of Campeche sand has been established. The database allowed the development of several empirical correlations between in situ VS, basic soil properties of sand, and cone net resistance. These equations should be used with caution in predicting the in-situ shear wave velocity in the top 3.5 m because there were no VS measurements in these surficial soils due to the noise transmitted from the vessel to the time records used for VS determination, which made shear wave arrivals difficult to pick. It is recommended the predictions of VS made with the relationships in the top 3.5 m should be limited to the lowest value of 35 m/s.
The following 3-step procedure is recommended to determine the three Vs profiles of clay and sand needed to perform earthquake response analysis in the Bay of Campeche when in situ measurements of VS at the site are not available:
First, develop the best estimate in situ VS profile in clay by calculating the average of the three VS values estimated using equations (10), (12), and (14) presented in Taboada, et al., (2013).
Second, develop the best estimate in situ VS profile in sand by calculating the average of the three VS values estimated using equations (3), (4), and (6).
Third, to incorporate the potential for variation in the site conditions and the uncertainties in the best estimate in situ shear wave velocity three different shear wave velocity profiles must be analyzed for each acceleration time history: the best estimate VS, a lower VS case, and a higher VS case. The lower and higher VS cases are estimated by applying scaling factors of (2/3)1/2 = 0.816 and (3/2)1/2 =1.225 to the best estimate in situ shear wave profiles obtained in the previous two steps. These scaling factors are recommended in ASCE 4-98 (1998).
A database of resonant column and strain-controlled cyclic DSS tests was developed for the following soil types: sand, calcareous sand, siliceous carbonate sand, and carbonate sand. The database allowed the development of predicting equations based on two independent modified hyperbolic relationships to determine the normalized shear modulus G/Gmax-g and material damping ratio D-g curves when no dynamic test results are available for a given soil layer within the strata.
The predictive equation of G/Gmax in the form of equation (10) features two
curve-fitting parameters: reference strain γr at G/Gmax = 0.5
and a curvature parameter a. For simplicity, the curvature parameter a was given a
constant value for sands. A linear relation for sand, between the reference strain
γr and the normalized effective confining stress with respect to the
atmospheric pressure,
The predictive equation of material damping ratio in the form of equation (12) features four
curve-fitting parameters: reference strain γrD at D/Dmax =
0.5; a curvature parameter aD characteristic of the curve D-γ; and
maximum and minimum material damping ratios, Dmax and Dmin,
respectively. For simplicity, the curvature parameter aD was given a
constant value for sand. A linear relation for sand, between the reference strain
γrD and the normalized effective confining stress with respect to the
atmospheric pressure,
It is shown that as CaCO3 increases, the G/Gmax curve tends to shift downward and the damping ratio curve tends to shift upward and the influence in the shape of the G/Gmax is evident when the carbonate content is higher than 50 %.
The validation of the calculated values of G/Gmax and D shows the best
predictions are found at low shear strains for G/Gmax and at large shear
strains for D falling within
Comparisons between the predictive equations developed in this study and the earlier previously published curves show the predictive equations of this study of G/Gmax exhibits the most linear response and the largest threshold shear strain, and beyond the threshold strain the curve degrades at the highest rate. The predictive equations of material damping ratio provide the lowest material damping ratio for cyclic shear strains larger than 0.001% for sand.
The equations developed to calculate VS, and the curves of G/Gmax-γ and D-γ of Bay of Campeche sands are recommended for preliminary or perhaps even final seismic site response evaluations. It has been shown that they can be used in practice to perform earthquake response analysis in the Bay of Campeche and determine the design acceleration spectrum at the depth of maximum soil-pile interaction (Taboada, et al., 2022).
However, considering the scatter of the data points around VS and the curves, the equations should be used with caution, and parametric and sensitivity studies are strongly recommended to assess the importance of this scatter. In large critical projects, in situ measurements of VS and direct experimental determinations of G/Gmax and D for the sands of interest are suggested to be more appropriate.

