


Serviços Personalizados
Journal
Artigo
 Inglês (pdf)
 Artigo em XML
 Referências do artigo
 Enviar este artigo por email
Indicadores
-
 Citado por SciELO
 -
 Acessos
Links relacionados
-
 Similares em
SciELO
Similares em
SciELO
Compartilhar

 Permalink
Acta zoológica mexicana
versão On-line ISSN 2448-8445versão impressa ISSN 0065-1737
Acta Zool. Mex vol.28 no.2 Xalapa Ago. 2012
Artículos originales
The life cycle of a desert spider inferred from observed size frequency distribution
El ciclo de vida de una araña desértica deducido a partir de la distribución de frecuencia de tallas
Irma Gisela NIETO-CASTAÑEDA,1 Isaías Hazarmabeth SALGADO-UGARTE2 & María Luisa JIMÉNEZ-JIMÉNEZ3
1 Universidad del Mar, Campus Puerto Escondido (UMAR), Ciudad Universitaria, Carretera Vía Sola de Vega, Puerto Escondido, San Pedro Mixtepec, Juquila, Oax., México C.P. 71980 México; Tel: +(52) (954) 954 58 249 90. <irmanieto@zicatela.umar.mx>
2 Laboratorio de Biometría. Facultad de Estudios Superiores Zaragoza, Universidad Nacional Autónoma de México (FESZ, UNAM), Batalla 5 de mayo S/N esq. Fuerte de Loreto, Ejército de Oriente, Iztapalapa 09230, México, D.F., México. <isalgado@servidor.unam.mx>
3 Centro de Investigaciones Biológicas del Noroeste Mar Bermejo 195, Col. Playa Palo de Sta. Rita La Paz, B.C.S., 23090 México Tels: (612) 12 3 8481. <ljimenez04@cibnor.mx>
Recibido: 19/08/2011;
aceptado: 21/03/2012.
ABSTRACT
We studied the life cycle of the spider Syspira tigrina (Araneae: Miturgidae) by indirect methods. This species is endemic to the North American deserts and locally abundant; nevertheless, information on its biology is scarce. We did monthly collections for over a year at La Paz, Baja California Sur, Mexico. We found that adult spiders were more abundant between August and November 2005 and had low abundance or were absent the remainder of the year while juveniles were present all year. To estimate changing body size structure of the population we analyzed juvenile tibia I length distribution (TIL) (as indicator of the body size) of each monthly sample by means of Kernel Density Estimators (KDEs). We found 35 TIL juveniles size groups (Gaussian components). The smallest juveniles were more abundant between October 2005 and January 2006 and the biggest were more abundant twice during the hottest months. We hypothesize that mating period is between August and October 2005 and the main recruitment period from November 2005 and January 2006. However we found evidence of continuous recruitment through the year, suggesting that although there is a peak of reproduction in November, the females oviposit almost all year. Also there is evidence of juveniles' growth pattern from January to July 2006. The use of KDEs with histograms is a very good statistical tool to delimit size groups with mixed frequency distributions that otherwise might be difficult. This tool should be useful to test any hypothesis related with the body size structure of a population or community.
Key words: spider life histories, size frequency, kernel density estimators, size classes.
RESUMEN
Se estudió el ciclo de vida de la especie Syspira tigrina (Miturgidae), por métodos indirectos. Esta especie es endémica de los desiertos de Norte América y es localmente muy abundante; sin embargo, su biología es prácticamente desconocida. Se realizaron recolectas mensuales durante un ciclo anual de la especie en La Paz, Baja California Sur, México. Al analizar los patrones de abundancia de adultos, se encontró que son más abundantes entre los meses de agosto y noviembre del 2005 y poco abundantes o ausentes el resto del año. Lo que apunta a que el periodo reproductivo debe ocurrir durante esta lapso. Paralelamente se analizó la distribución de la longitud tibial I (LTI) de los juveniles (como indicador de talla corporal), mediante el método de estimadores de densidad por kernel (EDKA's). Se delimitaron 35 grupos de talla (componentes Gaussianos) estadísticamente significativos para juveniles durante los 12 meses de muestreo. Los grupos de LTI más pequeños fueron más abundantes entre octubre del 2005 y enero del 2006, sugiriendo que es cuando ocurre el periodo de reclutamiento, mientras que los grupos de talla mayor dominaron dos veces durante los meses más cálidos. Por su parte, el periodo debe ocurrir entre noviembre 2005 y enero 2006 También existe un claro patrón de crecimiento de los juveniles de enero a julio del 2006. El empleo de los EDKA's en conjunto con los histogramas de frecuencia, son una herramienta estadística viable para delimitar distribución de grupos de tallas con frecuencias mezcladas, que sería difícil hacerlo por los métodos tradicionales. Su aplicación podría ser útil para probar cualquier hipótesis relacionada a la talla de los organismos de una población o comunidad.
Palabras clave: historias de vida de arañas, frecuencia de tallas, estimadores de densidad por kernel, clases de tallas.
INTRODUCTION
The life history of any species is related to the species distribution, habitat use and energetic requirements, the biological relationships with other species and the structure and dynamics of communities (Polis et al. 1996; Begon et al. 2006). There are many studies of post-embryonic development and the identification of spiders instars by direct observation of captive specimens (Aguilar & Méndez 1971; Jackson 1978; Bartos 2005; Punzo & Farmer 2006), but this takes a lot of time and effort (Toft 1976). An alternative method is to deduce the life cycle of a species based on the analysis of different body size measurements of organisms systematically collected during one or two years (Toft 1976; Aitchinson 1984; Aiken & Coyle 2000; Wright & Coyle 2000; Crews et al. 2008). Most of these studies identified spider size classes by using frequency histograms, assuming that most conspicuous modes represent size groups while recognizing that the boundaries among them are arbitrary (Toft 1976; Davis & Coyle 2001). However these histograms present several problems, including dependence of grid origin and the interval width, discontinuity and the use of fixed width intervals. These problems have motivated statisticians to find alternative, more efficient methods. Kernel Density Estimators (KDEs) do not depend on the origin position and are continuous distribution estimators (Silverman 1986). Besides, there are several methods for choosing the interval width (Hárdle 1991; Scott 1992). Most of these methods have been employed to describe fish size classes and growth (Sanvicente-Añorve et al. 2003); however they have not been used to describe spider size classes. Here we present the use of KDEs as a modern tool to examine body size-frequency distributions of spiders, using Syspira tigrina Simon, 1885 as an example.
The species Syspira tigrina Simon, 1885 (Araneae: Miturgidae) is very abundant in xeric areas from North America. This species is one of the most conspicuous spiders in Baja California Sur, representing up 40% of all wandering spiders (Nieto-Castañeda & Jiménez-Jiménez 2009; Jiménez & Navarrete 2010). This miturgid is a fast-moving ground-hunting spider and its body size range from 5 to 18 mm; males are same or bigger size than females (Ubick & Richman 2005; Nieto-Castañeda & Jiménez-Jiménez 2009). In turn, this species is an important prey diet component for some rodents (Álvarez-Castañeda et al. 2006), and possibly be preyed upon by other vertebrates and invertebrates due to its high abundance. Nevertheless, information on its biology is scarce.
METHODS
Study area. We worked in El Comitán, a federal biological preserve station located near Bahía de La Paz (24°7'N, 110°25'W, 20 m a.s.l.), west of La Paz city in Baja California Sur, México. The region is a subtropical desert with hot summers, a sporadic rainy season between July and October, and warm winters with little or no rain between November and February. The vegetation is a subtropical desert shrub (León de la Luz ét al. 1996).
Field work. We collected spiders every month from July 2005 to July 2006 by establishing two 150 m line transects, each one with 15 pitfall traps at approximately 10 m intervals (Muma 1981). A wire covering on each trap excluded dead leaves and other debris but not spiders. The samples were preserved in 70% ethanol and transferred to the laboratory for cleaning and taxonomic identification.
Species identification and measurements. We grouped the spiders as juveniles, penultimate adults (males and females) and adults (males and females). Then we measured the tibia I length (TIL) (distance along the dorsal surface from proximal joint to distal joint with the leg on the horizontal plane) as an estimator of body size (Toft 1976), using a graduated lens under the stereoscopic microscope with each specimen submerged in 70% ethanol and anchored in a bed of fine white sand on the bottom of a culture dish. Voucher specimens were deposited in the Arachnological and Entomological Collection of the Centro de Investigaciones Biológicas del Noroeste (CAECIB).
Data analysis. We analyzed the TIL distribution of each monthly sample by means of Kernel Density Estimators (KDEs), using weighted averaging of rounded points (WARP) (Hárdle & Scott 1992; Salgado-Ugarte et al. 1995a). KDEs are defined as:
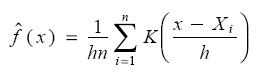
Where,
 = density estimation of the variable x
n = number of observations
h = bandwidth
Xi = tibia length of the i-th spider specimen
K (•)= a smooth, symmetric kernel function integrating to one.
In this case, we use the Gaussian kernel function, i.e.:

The bandwidth h was chosen based on Silverman's rule (1986) (Salgado-Ugarte et al. 1995b):
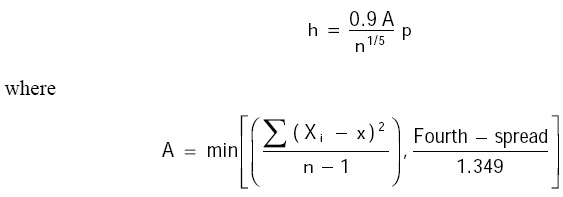
A is the smaller of two estimates of the standard deviation: the usual estimate S or F-pseudosigma, a robust alternative for S (Hoaglin 1983). The Fourth-spread is a resistant dispersion measure approximately equivalent to the interquartile range (Tukey 1977). The Silverman optimal bandwidth is designed for Gaussian distributed data. This value is too large when applied with skewed or multimodal distributions. Nevertheless, in these cases the optimal bandwidth may serve as a starting point which allows the dominant modes to be recovered.
The optimal bandwidth chosen for each TIL size group reflects reference values calculated with several practical rules for oversmoothed and optimal widths (Salgado-Ugarte et al. 1995b) and the values determined by the smoothed Bootstrap multimodality test of Silverman (1986) (Salgado-Ugarte et al. 1997). The resulting density distributions were scaled to a smoothed frequency and decomposed into their Gaussian components with a computerized version of the method proposed by Bhat-tacharya (1967) (Salgado-Ugarte et al. 1994). Since the slope of a Gaussian curve is positive to the left of the mode, zero at the mode and negative to the right of the mode, the logarithmic derivative decreases linearly. Therefore, each Gaussian component can be determined by identifying negative sloped intervals in the graph of logarithmic frequency differences against length midpoints (Salgado-Ugarte et al. 1994). Then each Gaussian component represents a TIL size group. We analyze the TIL groups within samples by plotting monthly TIL frequency histograms with over imposed monthly KDEs for all TIL groups. The KDEs result in figures smoother than histograms, allowing easy recognition of characteristics such as outliers, skewness, and multimodality (Salgado-Ugarte et al. 1993, 1995b). All statistical procedures were performed in Stata v. 9.1 (StataCorp 2001).
RESULTS
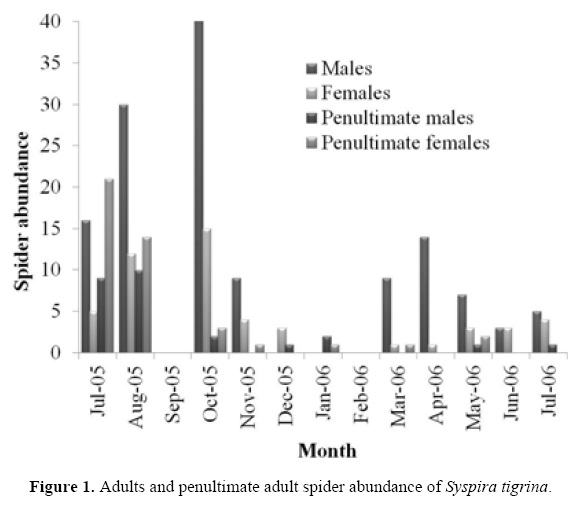
We collected 914 spiders, 660 were juveniles, 69 penultimate adults and 185 adults of S. tigrina. We found that adult spiders were more abundant between August and November 2005 and penultimate adults were more abundant between July and August 2005; both had low abundance or were absent the remainder of the year (Fig. 1) while juveniles were present all year.
Because use KDEs analysis is to delimit size groups continuously we only analyzed juvenile TIL distribution (Fig. 2), and excluded the other spiders because we already identified them as penultimate adults and adults.
The TIL-frequency distributions of juveniles indicate that most part of the year small sizes (TIL mean < 1 mm) had high frequency. TIL mean varied from 0.9752 to 1.0518 mm. Optimal TIL bandwidths used to construct KDEs varied between 0.053 to 0.3425 mm depending on the number of observations and their variation. In most cases we observe a dominant mode with several minor modes. Assuming Gaussian distribution, we estimated the statistics: mean, standard deviation and size (Table 1) corresponding to each main mode by the Bhattacharya's method (Fig. 3). Dominant TIL modes indicate spider groups.
We found 35 spider groups (Gaussian components) with TIL frequency distributions during the 12 month collection period (Table 1). The smallest TIL groups were more abundant between October 2005 and January 2006 (N = 284, TIL mean < 0.65 mm) and the biggest were more abundant twice, one from May to July 2006 (N = 196, TIL mean > 0.75 and < 1.92) and from July to August 2005 (N = 101, TIL mean > 0.75 and < 1.63).
DISCUSSION
The abundance patterns of adult spiders of S. tigrina indicate that the mating period might occur between August and October 2005 because it is when most adults were present. The high abundance of penultimate males and females previous to August 2005 confirms this outcome. This period takes place just after the main rainy season and when temperature starts to drop (Fig. 4). This it is compatible with the breeding season of most desert animals (Keast & Marshall 1954; Barrientos et al. 2007).
Also the juvenile TIL groups also indicate that the principal recruitment period might occur during November and December and, to a lesser extent, on January when the smallest juveniles (TIL mean < = 0.7 mm) were more abundant, and also when larger specimens (TIL mean < = 0.7 mm) were scarcer in the study period. This recruitment occurs after the main rainy season and when the temperature starts to decrease (Fig. 4).
The pattern described above suggests that there should be a continuous recruitment through the year (the highest values occurs between November and December 2005), implying that the females oviposit almost throughout the year, starting in November and gradually less frequently afterwards. There is evidence of juvenile growth from January to February, when the dominant group classes were > 0.7 mm of TIL mean, but growth continued until May- July. This suggests that the maturation and mating periods are close to each other. The patterns we found through this analysis are similar to those observed earlier for the desert spider Diguetia mojavea, where reproduction and oviposition occurs during July and October, and no juveniles are found during August to December (Boulton & Polis 1999). The continuous oviposition periods of the females could be a consequence of the characteristic desert harsh conditions (Polis & Yamashita 1991), as reported for the desert spider Clubiona robusta, which oviposits several times in at least six months in one year (the recruitment period of the species cannot be determined because their juveniles are impossible to identify from other clubionids) (Austin 1984). Unfortunately there are few comparable life history studies of other desert spiders. The lower abundance of the larger juveniles (TIL mean > 0.7 mm) during most part of the year suggests that they must be dying. For this or any other reason they cannot be caught by the pitfall traps.
In general, there are few studies about the life histories of ground dwelling spiders around the world. This might be due to the difficulty of differentiating juveniles among related species, and discriminating size classes in mixed length frequency distributions (Toft 1976). However, it is interesting that in Holarctic regions some spider species from several families (Araneidae, Clubionidae, Linyphidae, Theridiidae, Lycosidae, mainly), mate and ovipositate during May and October (Toft 1976; Aiken & Coyle 2000; Wright & Coyle 2000; Davis & Coyle 2001); these species have well defined life histories where the mature adults occur once or twice in a year, however in all cases the limits of size classes are unambiguous.
The use of KDEs is a powerful statistical tool to delimitate size groups with mixed frequency distributions which otherwise would be difficult to determine, not only for life cycle studies. Animal group size is one of the most important characteristics that structures populations and communities, then it must be necessary to test any biological hypothesis based on size groups.
ACKNOWLDGEMENTS
We thank F. A. Coyle for his suggestions; M. M. Correa-Ramírez assisted during field collections and L. Higgins for her comments and valuable editorial improvements and two anonymous reviewers for the time and concern spent on the review of this manuscript. This project was supported by Consejo Nacional de Ciencia y Tecnología of Mexico (SEMARNAT-CONACYT C01-0052). Additional support was provided by UNAM (PAPIME PE205407). Collection, study, and preservation of specimens comply with Mexican law, including a permit from SEMARNAT.
LITERATURE CITED
Aguilar, P. G. F. & M A. Méndez G. 1971. La "araña chata del nido de arena" Sicarius peruensis (Keyserling, 1880). III. Desarrollo post-embrionario. Primer Congreso Latinoamericano de Entomología. Cusco-Perú. Revista Peruana de Entomología, 14: 213-220. [ Links ]
Aiken, M. & F. A. Coyle. 2000. Habitat distribution, life history and behavior of Tetragnatha spider species in the Great Smoky Mountains National Park. Journal of Arachnology, 28: 97-106. [ Links ]
Álvarez-Castañeda, S. T., M. M. Correa-Ramírez & A. L. Trujano-Álvarez. 2006. Notes on Notio-sorex crawfordi (Coues) from two oases in the Baja California peninsula, Mexico. Journal of Arid Environments, 66: 773-777. [ Links ]
Atchison, C. W. 1984. The phenology of winter-active spiders. Journal of Arachnology, 12: 249-271. [ Links ]
Austin, A. D. 1984. Life history of Clubiona robusta L. Kock and related species (Araneae: Clubioni-dae) in South Australia. Journal of Arachnology, 12: 87-104. [ Links ]
Barrientos, R., A. Barbosa, F. Valera & E. Moreno. 2007. Temperature but not rainfall influences timing of breeding in a desert bird, the trumpeter finch (Bucanetes githagineus). Journal of Ornithology, 148: 411-416. [ Links ]
Bartos, M. 2005. The life history of Yllenus arenarius (Araneae, Salticidae) evidence for sympatric populations isolated by the year of maturation. Journal of Arachnology, 33: 214-221. [ Links ]
Begon, M., C. R. Townsend & J. L. Harper. 2006. Ecology: From individuals to ecosystems. Blackwell Publishing. 4th E.U.A. 738pp. [ Links ]
Bhattacharya, C. G. 1967. A simple method of resolution of a distribution into Gaussian components. Biometrics, 23: 115-135. [ Links ]
Boulton, M. & G. A. Polis. 1999. Phenology and Life History of the Desert Spider, Diguetia mojavea (Araneae, Diguetidae). Journal of Arachnology, 27: 513-521. [ Links ]
Crews, S. C., E. Wienskoskib & R. G. Gillespie. 2008. Life history of the spider Selenops occultus Mello-Leitao (Araneae, Selenopidae) from Brazil with notes on the natural history of the genus. Journal of Natural History, 42: 2747-2761. [ Links ]
Davis, M. J. & F. A. Coyle. 2001. Habitat distribution and life history of Araneus spider species in the Great Smoky Mountains National Park. Bulletin of the British Arachnological Society, 12: 49-57. [ Links ]
Härdle, W. K. 1991. Smoothing techniques: with implementation in S. Springer Verlag, New York. 261 pp. [ Links ]
Härdle, W. K. & D. W. Scott. 1992. Smoothing by weighted averaging of rounded points. Computational Statistics, 7: 97-128. [ Links ]
Hoaglin, D. C. 1983. Letter values: a set of selected order statistics, pp. 33-57. In: D.C. Hoaglin, F.Mosteller andJ.W. Tukey (Eds.), Understanding robust and exploratory data analysis. John Wiley & Sons, New York. [ Links ]
Jackson, R. R. 1978. The life history of Phidippus johnsoni (Araneae: Salticidae). Journal of Arachnology, 6: 1-29. [ Links ]
Jiménez, M. L. & J. G. Navarrete. 2010. Fauna de arañas del suelo de una comunidad árida-tropical en Baja California Sur, México. Revista Mexicana de Biodiversidad, 81: 417-426. [ Links ]
Keast, A. &. A. J. Marshall. 1954. The influence of drought and rainfall on reproduction in Australian desert birds. Proceedings of the Zoological Society of London, 124: 493-499. [ Links ]
León de la Luz, J. L., R. B. Coria & M. E. Cruz. 1996. Fenología reproductiva de una flora árido-tropical de Baja California Sur, México. Acta Botánica Mexicana, 35: 45-64. [ Links ]
Muma, M. H. 1981. Adult activity of ground surface spider populations in pinion-juniper and arid-grass land association in Southwestern New Mexico. Florida Entomologist, 64: 276-283. [ Links ]
Nieto-Castañeda, I. G. & M. L. Jiménez-Jiménez. 2009. Possible niche differentiation of two desert wandering spiders of the genus Syspira (Araneae: Miturgidae). Journal of Arachnology, 37: 299-305. [ Links ]
Polis, G. A. & T. Yamashita. 1991. The ecology and importance of predaceous arthropods in desert communities, pp. 180-215. In: Polis, G (Ed.). Ecology of desert communities. The University of Arizona Press Tucson. [ Links ]
Polis, G. A., R. D. Holt, B. A. Menge, & K. O. Winemiller. 1996. Time, space, and life history: influences on food webs, pp. 435-461. In: G. A. Polis & K. O. Winemiller (Eds.). Food Webs: Integration of Patterns and Dynamics. Chapman & Hall. [ Links ]
Punzo, F. & C. Farmer. 2006. Life history and ecology of the wolf spider Pardosa sierra Banks (Araneae: Lycosidae) in southeastern Arizona. The Southwestern Naturalist, 51: 310-319. [ Links ]
Salgado-Ugarte, I. H., M. Shimizu & T. Taniuchi. 1993. Exploring the shape of univariate data using kernel density estimators. Stata Technical Bulletin, 16: 8-19. [ Links ]
Salgado-Ugarte, I. H., M. Shimizu & T. Taniuchi. 1994. Semi-graphical determination of Gaussian components in mixed distributions. Stata Technical Bulletin, 18: 15-27. [ Links ]
Salgado-Ugarte, I. H., M. Shimizu & T. Taniuchi. 1995a. ASH, WARPing, and kernel density estimation for univariate data. Stata Technical Bulletin, 26: 23-31. [ Links ]
Salgado-Ugarte, I. H., M. Shimizu & T. Taniuchi. 1995b. Practical rules for bandwidth selection in univariate density estimation. Stata Technical Bulletin, 27: 5-19. [ Links ]
Salgado-Ugarte, I. H., M. Shimizu & T. Taniuchi. 1997. Nonparametric assessment of multimodality for univariate data. Stata Technical Bulletin, 38: 27-35. [ Links ]
Sanvicente-Añorve, L., I. H. Salgado-Ugarte & M. Castillo-Rivera. 2003. The use of kernel density estimators to analyze length-frequency distributions of fish larvae, 419-430 pp. In: H. I. Browman & A. B. Skiftesvik (Eds.). The Big fish Bang. Proceedings of the 26th Annual Larval Fish Conference. [ Links ]
Scott, D. W. 1992. Multivariate density estimation: theory, practice and visualization. John Wiley & Sons, New York. 317 pp. [ Links ]
Silverman, B. W. 1986. Density estimation for statistics and data analysis. Chapman and Hall, London. 175 pp. [ Links ]
StataCorp. 2001. Stata Statistical Software: Release 7.0. College Station, TX. Stata Corporation. [ Links ]
Toft, S. 1976. Life histories of spiders in a Danish beech wood. Natura Jutlandica, 19: 5-40. [ Links ]
Tukey, J. W. 1977. Exploratory data analysis. Addison-Wesley, Reading, Massachusetts. Addison-Wesley Publishing Co. 668 pp. [ Links ]
Ubick, D. P. & D. B. Richman. 2005. Miturgidae. p. 173 In: D. Ubick, P. Paquin, P. E. Cushing & V. Roth (Eds.) Spiders of North America: an identification manual. American Arachnological Society. [ Links ]
Wright, R. L & F. A. Coyle. 2000. Habitat distribution, life history and behaviour of Neriene species in the Great Smoky Mountains National Park (Araneae, Linyphiidae). Bulletin of the British Arachnological Society, 11: 293-304. [ Links ]

