


Servicios Personalizados
Revista
Articulo
 Inglés (pdf)
 Artículo en XML
 Referencias del artículo
 Enviar artículo por email
Indicadores
-
 Citado por SciELO
 -
 Accesos
Links relacionados
-
 Similares en
SciELO
Similares en
SciELO
Compartir

 Permalink
Boletín mexicano de derecho comparado
versión On-line ISSN 2448-4873versión impresa ISSN 0041-8633
Bol. Mex. Der. Comp. vol.41 no.121 Ciudad de México ene./abr. 2008
Artículos
From homo sapiens to homo automobilis. Revisiting air quality management in Mexico City*
César Nava Escudero**
** First degree in Law (UNAM, México); MA in Public Administration (University of Exeter, England); PhD (London School of Economics, University of London, United Kingdom). Currently, full-time researcher at the Institute of Legal Research (UNAM, México).
Artículo recibido el 27 de abril de 2007.
Aceptado el 3 de agosto de 2007.
Resumen
El presente trabajo tiene por objeto analizar quince años (1990-2005) de gestión de calidad del aire en la ciudad de México. Tras analizar tres aspectos vinculados entre sí (crecimiento urbano y poblacional, la actual situación de calidad del aire y las emisiones de vehículos automotores), este trabajo concluye que mientras las autoridades mexicanas continúen apostando a las tecnologías nuevas, a la implementación de diversas pero insuficientes medidas de tránsito vehicular, resten importancia al transporte público, y en cambio apoyen la expansión de vialidades, la mejoría de la calidad del aire en la ciudad de México será moderada.
Palabras clave: gestión de la calidad del aire (1990-2005), emisiones de vehículos automotores, autos particulares, ciudad de México.
Abstract
This paper describes fifteen years (1990-2005) of air quality management in Mexico City. By looking at three interlinked issues (urban and population growth; the current air quality situation; and road vehicle emissions) it concludes that as long as Mexican authorities continue to rely on the introduction of new technologies and the implementation ofdiverse but insufficient traffic management schemes and to disregard the importance of seriously compromising on public transport rather than on road building expansion, improved air quality in Mexico City can only be moderately achieved.
Keywords: air quality management (1990-2005), road vehicle emissions, private cars, Mexico City.
SUMMARY
I. Introduction. II. Mexico City 2000: the second mega-city in the world. III. Revisiting air quality management in Mexico City. IV. The building of an automobile-oriented mega-city. V. Conclusion. VI. Bibliography.
I love the car. It has given me the
most beautiful hours of my life.
Adolf Hitler
I. INTRODUCTION
Mexico City is one of many big cities in the world that has experienced mass motorization over the last few decades. The inconceivable rise in the number of road vehicles across the metropolitan area is leading commentators to describe the capital city of Mexico as a prototype of an automobile-oriented urban centre. Winfried Wolf's first idea on explaining the car society phenomenon may be appropriate to explain Mexico City's own experience: "The first claim of the car society is that the car is for everyone: everyone either has a car or wants to have one".1 As much as this is becoming a reality, a large majority of Mexicans (and foreigners) living in Mexico City and surrounded areas do not actually own or have access to a car yet. Non-car drivers, however, suffer from the same consequences of car drivers: traffic jams, polluted air, car accidents, negative health impacts, and so forth.
This paper briefly describes fifteen years (1990-2005) of air quality management in Mexico City. By exploring urban and population growth at the metropolitan level, it focuses on portraying the achievements of Mexican authorities in reducing certain air pollutants as well as preventing others from reaching peak levels as experienced in the late 1980s and early 1990s. While current concerns about polluted air in Mexico City (i. e. concentration levels above health recommended guidelines) are mostly related to road vehicle emissions, this paper shows that such emissions mainly come from private cars. The purpose of this work is to draw attention on the fact that in spite of the existence of diverse air quality management strategies (which have mainly introduced clean technologies and traffic management measures), the absurd rise in the number (and use) of private cars may seriously obstruct government efforts in achieving and then sustaining healthy urban air quality in Mexico City.
II. MEXICO CITY 2000: THE SECOND MEGA-CITY IN THE WORLD
At the beginning of the new millennium, Mexico City turned out to be one of the three largest cities in the world. With its 18.1 million people, the city shared with Bombay (India) the second place on a list of 30 mega-cities. As seen in Table 1 (in the following page), Mexico City was only superseded by Tokyo's 26.4 million people (Japan) and was slightly above Sao Paulo's 17.8 million (Brazil) and New York's 16.6 million (USA). Although by the year 2010 Tokyo will stay on top of the list and Bombay and Lagos (Nigeria) will step on to the second and third places respectively, Mexico City is likely to remain within the seven most populated cities in the globe.2

The number of inhabitants given in Table 1 represents an arbitrary indicator to what truly corresponds to Mexico City. Strictly speaking, as of 1993, Mexico City is politically regarded as the Federal District: the political entity that is the capital city of the country and thus the seat of the federal powers. With a total population of 8.6 million, the territorial extension of Mexico City coincides with the physical boundaries of the Federal District: 1 486 kms2 (148 655 ha) of which 41% of the land is urban and the other 59% rural (conservation purposes, cattle rising and agriculture).
From a historical point of view, the geographical area of Mexico City has been commonly identified with the contiguous built-up area regardless of the physical boundaries of the Federal District. When the latter was created in 1824, it covered a small area of 8.8 kms2 (a radius of five miles around the central square of the city).
Due to political reasons, the Federal District was placed in the core of Mexico City which had at that time a territorial extension of 390 kms2 (39 000 ha). During the nineteenth century, though, both the Federal District and Mexico City experienced a lot of changes in their physical areas and local units of government due to a process of political and social unrest across the country. It was not until 1898 that with a major boundary reorganisation the Federal District extended its limits to as they exist now; by the end of that century, Mexico City was confined to what it is known as the 'First Quarter' with an area of 20 kms2 (2 000 ha) within the new Federal District boundaries.3
Mexico City's urban area began to expand shortly after the Mexican Revolution ended in 1917. From 1917 to 1950, Mexico City's built-up area rapidly grew but remained within the territory of the Federal District. However, after 1950, Mexico City's territorial extension spread out into the surrounding federated state called the State of Mexico (EdoMex); as of this date, conurbation of nearby municipalities commenced. As shown in Table 2 (in the following page), for the following four decades (1950-1990), population increased from 3.1 to an astonishing 14.5 million people with an urban area of more than 1 250 kms2 (125 000 ha).4

During the 1990s, Mexico City and its conurbated area were identified with different concepts, namely the Metropolitan Zone of Mexico City (MZMC), the Metropolitan Zone of the Valley of Mexico (MZVM), and the Metropolitan Area of Mexico City (MAMC). These concepts have been indistinctively used depending on the number of conurbated municipalities.5 For example, by the early-1990s while the MZMC referred to a physical area of 3 399 kms2 (339 900 ha) with a total population of 14.5 million, the MAMC referred to an area of 4 620 kms2 (462 000 ha) with a total population of 15.0 million inhabitants which corresponded with the statistical definition of the metropolis.6
As the conurbation phenomenon continued in the second half of the 1990s, Mexico City's metropolitan limits and population growth figures changed again. In 1995, the new Metropolitan Area (sometimes called Metropolitan Zone) referred to a physical area of more than 4 600 kms2 (460 000 ha) with a total population of 16.6 million; it covered the Federal District with its 16 delegated units and several more conurbated local units — 28 municipalities — from the surrounding State of Mexico.7
By the year 2000, the definition of the Metropolitan Area changed and thus the physical extension of Mexico City's conurbated area increased to more than 7 410 kms2 (741 000 ha) with a total population of 18.3 million inhabitants which covered the Federal District (16 delegated units), 58 conurbated municipalities from the State of Mexico, and 1 conurbated municipality from another federated state: Hidalgo.8
While the territorial expansion of the Metropolitan Area of Mexico City persists at the beginning of the twentieth first century, a relatively new concept has been adopted to describe an even much larger area of Mexico City called the 'Megalopolis'. With a total population of 26.8 million, this term refers to the idea of a city-region area that covers around 265 local units of government including the 16 delegated units of the Federal District, 99 municipalities from the State of Mexico, 31 from Hidalgo, 31 from Morelos, 36 from Puebla, and 52 from Tlaxcala.9
For air quality management purposes, most government reports have used the term 'Metropolitan Zone'. In doing so, they have referred to either the 'Metropolitan Zone of Mexico City' or the 'Metropolitan Zone of the Valley of Mexico'. Actually, the last three main air pollution programmes specifically designed to deal with this urban environmental problem in the capital city have used this terminology: the 1990 Comprehensive Programme Against Air Pollution in the Metropolitan Zone of Mexico City (PICCA 1990); the 1996 Air Quality Improvement Programme for the Valley of Mexico (Proaire 1995-2000); and the 2002 Air Quality Improvement Programme for the Metropolitan Zone of the Valley of Mexico (Proaire 2002-2010).10 However, transport and traffic management government reports usually refer to larger metropolitan areas - like the MAMC or an extended version of the concept of the MZMC.11 While some figures at the metropolitan level may not coincide for this reason, overall percentages on transport contribution to air pollution in the MZMC are readily available and fairly applicable for analysis and public policy design.12
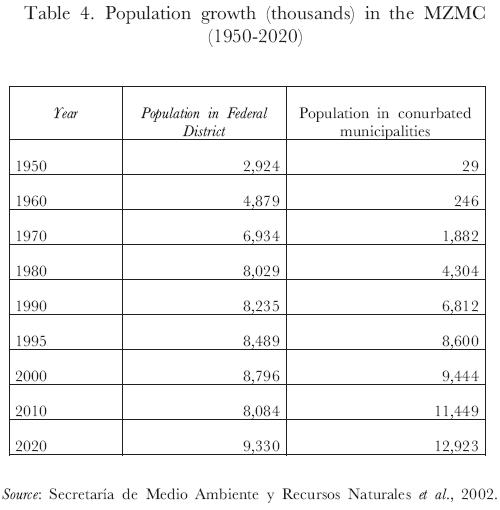
Thus, in spite of the vast amount of government reports (federal and local) that provide with valuable statistical information for analysis on Mexico City's social, economic and environmental development, there is not as yet a common definition to what really constitutes the MZMC. For the purposes of this article and following the last air quality management programme (the Proaire 2002-2010), the MZMC (also known as the Metropolitan Zone of the Valley of Mexico) refers to a territorial extension of 3 540 kms2 (354 000 ha) with a total population of 18.1 million which covers 16 delegated units of the Federal District and 18 surrounding municipalities of the State of Mexico (Table 3 in the following page).

Population growth figures as publicized by Proaire 2002-2010 shows that in the future total number of inhabitants in the MZMC may reach 20.5 million by the year 2010 and 22.5 million by the year 2020. This information considers the fact that new surrounding municipalities will be incorporated into the MZMC within the next twenty years. As seen in Table 4 (in the subsequent page), population growth in the Federal District, though, has somehow stagnated over the last few years.
III. REVISITING AIR QUALITY MANAGEMENT IN MEXICO CITY
Although the existence of air pollution was detected and contested in Mexico City during the 1950s and 1960s, it was not until 1986 that polluted air in the nation's capital city became a priority for the Mexican government. During the late 1980s the levels of such traditional urban pollutants as sulphur dioxide, suspended particulate matter, lead, and nitrogen oxides were all above the World Health Organisation (WHO) guidelines. Undoubtedly, the capital of Mexico was regarded at that time as the most polluted city for several pollutants within a Latin American context. The infamous status of being one of the most polluted cities in the world prompted in 1986 and 1987 a series of government responses that were set out to overcome this increasing urban environmental problem.13 Much stricter plans to control air pollution in the MZMC, though, only began in 1990 with the first of three consecutive programmes: the PICCA 1990, followed by the Proaire 1995-2000, and the Proaire 2002-2010.
Each of these programmes has included a wide number of policy actions, government aims, and a whole set of strategies at all levels (i. e. politico-administrative, social, legal, etc.). Additionally, they have also made available a great deal of statistical information regarding levels of air pollution, types of pollutants and health effects, air quality monitoring systems, public transport and traffic management data, and so on (see Table 5).

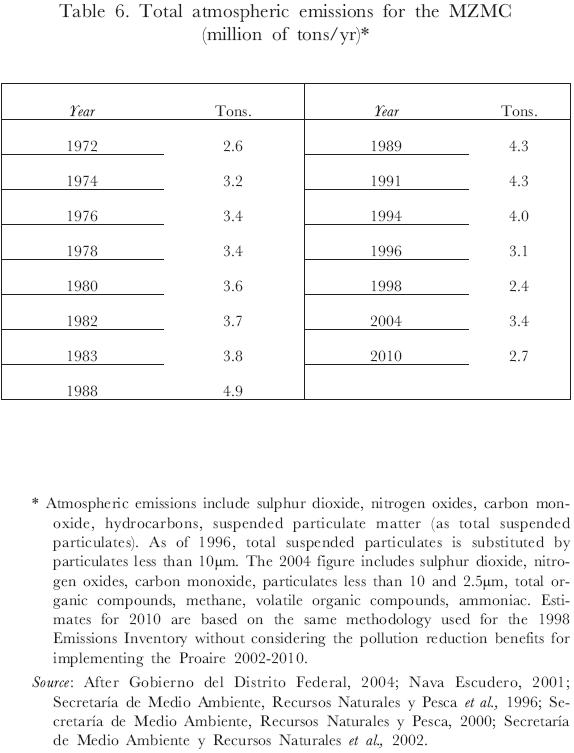
The outcome of more than fifteen years (1990-2005) of government efforts in the implementation of the above mentioned reports shows that current levels of air pollution are not as high as they were in the late 1980s and early 1990s. Indeed, a quick glance at levels of total emissions to the atmosphere for this period causes to feel somehow optimistic toward the way in which air pollution has been dealt with in the MZMC (Table 6 in the following page).
By way of illustration, pollution levels of certain pollutants have either considerably decreased - such as lead (Pb), sulphur dioxide (SO2), carbon monoxide (CO) or nitrogen dioxide (NO2) — or have not augmented - such as ozone (O3) - if compared to levels experienced during the 1990s (Table 7 in the following page). As a matter of fact, concentration levels of Pb have been below the Mexican air quality norm and those for SO2 and CO have only breached the Mexican norm on very few occasions over the last years. For the case of NO2, as much as it has been above Mexican air quality standards, peak levels of pollution are now not as frequent as they used to be. Likewise, pollution levels of ozone (O3) have not augmented as experienced in the early and mid 1990s. While O3 pollution levels breached the air quality norm from 80% to 90% of all days per year during the 1990's period, it has not currently reached the same maximum concentration levels of pollution as detected at that time.14 Overall, between 1990 and 2004 maximum concentration levels of O3 have decreased around 40%.15

In spite of the encouraging data provided by the last three government reports and several emissions inventories, Mexico City has not as yet achieved healthy urban air quality. The Metropolitan Zone still suffers from high concentrations of ozone, particulates - specifically particulates less than 10 μm (PM10) — and hydrocarbons (HC) above health guidelines where permissible limits for these pollutants are still too high compared to international values. For instance, while the WHO guidelines recommend a maximum concentration of 0.05 to 0.10 ppm / 1 hour once a year for ozone, the Mexican index value - Imeca (Índice Metropolitano de la Calidad del Aire) points - allows concentrations of more than 0.23 ppm / 1 hour once a year before any emergency action is taken to low down such levels of pollution.
Indeed, for many years, Phase 1 of the emergency plan16 - known as Atmospheric Environmental Contingency Programme (PCAA) -had been called first at 250 Imeca points (which corresponded to 0.29 ppm / 1 hour once a year) and then at 241 Imeca points (which corresponded to 0.28 ppm / 1 hour once a year). From 1995 to 2000, ozone concentration levels in the Metropolitan Zone of Mexico City have been above health recommended guidelines (0.11 ppm / 1 hour once a year or 100 Imeca points) for almost 85% of all days per year. In the year 2000, there were 323 days above WHO guidelines where maximum concentration levels reached more than 200 Imeca points for 19 times; there were only 23 days in which concentration levels were below the health threshold limits of 100 Imeca points.17 In 2004, the threshold limits were breached six days out of every ten, and during the first six months of 2005 (January-July) they were breached seven days out of every ten.18 Although Phase 1 of the contingency plan is currently called at 200 Imeca points for ozone (which corresponds to 0.23 ppm / 1 hour once a year) the norm is still too tolerant for health-protecting purposes.
It is important to mention that as much as this statistical information helps to analyse air pollution trends in Mexico City for the last 15 years it may not be completely reliable. So, for example, as shown in Table 8 (in the following page) the number of times for implementing the Pre-contingency phase and Contingency Phase I have decreased over the last years. This information, though, does not match with statistical data given by previous government reports which have presented higher figures on the number of times the emergency plan has been implemented: 63 times in 1991, 41 in 1992, and 11 in 1993.19 There exist two other examples that show that statistical information provided by diverse government reports may not be as accurate as it seems. First, during the period 1990-2005 data on total atmospheric emissions has been based on several emission inventories where the most important for air quality management policy were issued in 1989, 1994, and 1998. These three inventories20 have been respectively utilized as the statistical basis for air pollution figures in the elaboration of the PICCA 1990, the Proaire 1995-2000, and the Proaire 2002-2010. The problem here arises because the 1994 Emissions Inventory cannot be compared with its predecessor (the 1989 Inventory) as the case-studies and methodology used for estimates on total atmospheric emissions are not the same, as openly recognized by the Proaire 1995-2000. Something similar happens with the 1998 Emissions Inventory vis á vis its predecessor (the 1994 Inventory): the Proaire 2002-2010 has accepted that the previous Inventory (i. e. the 1994) is not as reliable as the 1998 one. Second, statistical information shows that whereas total atmospheric emissions went down from a maximum of 4.9 million of tons (per year) in 1988 to 4.3 in 1991 over a period of three years, they suddenly declined from 4.0 million of tons (per year) in 1994 to an amazing 2.4 in 1998 over a period of less than four years. Paradoxically, while air pollution declined the number and use of vehicles in that period (mainly private cars) steadily augmented and the consumption of fuel gradually increased (from 1990 to 2004 it has almost progressively gone up for more than 30%).21 Is it possible to believe that total emissions dropped almost the double in just a few years during the mid-1990s?

In spite of the latter, existing data on diverse air quality-related matters does help in the understanding of air pollution trends in Mexico City. Whether we like it or not, or whether we believe it is reliable or not, this information published has served as the basis for policy design and implementation. It follows that current concerns about polluted air in Mexico City include such pollutants as CO, O3, PM10, NO2, SO2 and HC — among few others. As already seen, while each of these pollutants has breached the Mexican air quality norm during the period 1990-2005 (some on fewer occasions than others and with diverse concentration levels), the Mexican government (central and local) has recognised that pollution levels of O3 and PM10 are still a serious problem and pose a threat to human health in the Metropolitan Zone of Mexico City.22
So, if the information provided is taken into account (despite the existing inaccuracies) it is possible to contend that the MZMC continues to suffer from perceived poor air quality where morbidity and mortality rates are still an issue of much concern. The main consequences on human health produced by ozone include a wide variety of respiratory illnesses, school absenteeism among children, emergency visits to hospitals for asthma, eye, nose and throat irritation, cough and headache, among others. Needless to say, the most vulnerable groups are children, the elderly and/or those that suffer from asthma or cardiovascular illnesses. In the case of PM10, current levels of air pollution affects lungs, increases ill-respiratory symptoms, augments visits into hospitals due to bronchitis in children and adults, and so on.
High levels of air pollution in the MZMC have also contributed to an increased number of excess deaths. According to some studies, there exists a correlation between high concentrations of certain pollutants in the atmosphere and increased mortality rates. There are two examples of this. First:
In [a] study carried out for the World Bank in 1992, conservative calculations suggested that there was a significant relation between total suspended matter (TSP) and mortality rates. Based on the level of TSP pollution in Mexico City during 1990, the estimated total number of (statistical) lives saved would have been 6 400 - equivalent to 3.8 lives per 10,000 people.23
Second, the University of Harvard have recently carried out studies for analysis on mortality rates in Mexico City concluding that around 1 000 lives per year could be saved if only 10% of current levels of PM10 were diminished; the same reduction of 10% in ozone levels could save hundreds of lives per year in the capital city.24
IV. THE BUILDING OF AN AUTOMOBILE-ORIENTED MEGA-CITY
Over the last few decades, Mexico City has faced explosive growth in the number of automobiles (defined as self-moving vehicles). This expansion has basically included private cars, buses, minibuses, taxis, light, medium and heavy goods vehicles, and motorbikes. At present (early-2007), total number of road vehicles in the MZMC is estimated at 4.5 million with an annual increase of around 5.9% per year; there are around 175 000 brand new vehicles on the road every year.25 The use of vehicles represents 47% of all energy-consumption for the whole metropolitan zone.
A recent report by the local government in Mexico City — i. e. the Federal District Government (GDF) — gives evidence of the rapid increase of private cars in the Federal District over a period of 60 years (Table 9 in the following page). According to this report, mass motorization began in the 1960s; while car ownership in the year 2000, has not augmented in the Federal District as in previous years, annual car sales continue in the capital city. The rise in the number of private cars is expected to increase in the surrounding conurbated area by almost three times more than in the Federal District for the coming years.

Estimates on vehicles growth in the MZMC for the present decade go from around 3.5 million in the year 2000 to 4.5 million in 2006, and to 5.4 million in 2010.
As seen in Table 10 (in the following page), private cars stand for the largest number of road vehicles.

It has been worldwide revised that an increased number of automobiles in large and growing urban centres result in unhealthy urban air quality for the entire city.26
Surely, Mexico City has not been the exception to the latter. Nevertheless, it would be too simplistic to say that the rise in the number (and use) of automobiles in the case of the MZMC has inevitably derived in the increase of air pollution levels in the same proportion. At the same time, it would be too naive to believe that healthy urban air quality can be achieved by introducing all sort air quality management strategies in spite of the growing amount of road vehicles in an also growing metropolitan zone where there are almost no economic or social incentives to use less polluting modes of transport.
Without any doubt, the rise in car ownership and car use has resulted in two urban environmental happenings that are related to air quality management in the MZMC. First, more cars has meant more traffic jams. As a result, the average speed of road vehicles has lowered down dramatically. During the 1990s, the average speed in the MZMC was 36 km/h where more than 30% of road vehicles had an average speed of 10-20 km/h.27 At present, while the average speed per day of road vehicles in the main freeways (Periférico and Viaducto) is around 13-20 km/h, the average speed during rush hours in the same freeways has gone down to an absurd of 7-15 km/h.28 This situation becomes absolutely ridiculous if it is remembered that in the first human car race - organized in 1894 by two French car firms (Panhard-Lavassor and Peugeot) between Paris and Rouen - the speed achieved was around 20 km/h!29
Low speeds do have an impact on the quality of air. This is because automobiles operating below a range of 50-90 km/h (30-50 miles/h) consume more fuel and produce more emissions.30
Certainly, there have been some traffic management schemes oriented to reduce the use of cars to bring down emissions and at the same time ease traffic congestion thus encouraging steady driving speeds which in turn are more effective in reducing emissions than lower or even higher speeds. This is the case of the traffic ban programme called 'A day without the car' which became compulsory in November 1989. Under this programme, all car drivers have been asked not to use their cars one day a week depending on the last number (or color) of their circulation permit. This legally-binding programme has not been efficient enough as many families have actually bought a second car to be used on the day the other driver's car is banned. Nowadays, this ban does not apply to brand new cars (until they become older) as they are suppose to be cleaner than cars purchased in previous decades. When the programme began, around 500 000 private cars per day were not allowed to be on the road; in the year 2000 this ban applied daily to around 350 000 'oldish' cars.
Another example to the latter has to do with the construction of new ring roads, bypasses or more roads in order to ease traffic jams and allow more environmentally-sound speed limits. This is the case of the recent additional freeways — commonly known as 'second layers' (segundos pisos) - that are been currently built by the local government of Mexico City. Beyond the political reasons underlying the construction of monumental freeways 'on top' of existing ones mainly within the boundaries of the Federal District, the rationale for carrying out such a task is to ease traffic jams in some troubled car junctions and in some of the most congested parts of the already existing freeways. However, as the number of cars is growing it is hard to believe that these new roads will effectively reduce pollution levels by increasing current average speeds in the MZMC. Above all, as Elsom brilliantly puts it:
Many countries attempt to solve traffic congestion problems in cities by building more roads to cope with the traffic. This policy can be self-defeating, however. New roads, including bypasses, encourage more cars to use them. New roads continue the cycle of continual traffic growth whose drivers demand new roads.31
Second, more cars has also meant that even as new technologies have been implemented in the MZMC (cleaner fuels, catalytic converters, stricter emissions control, and so on) pollution emissions above air quality norms have unavoidably continued. While the 'technological fix' approach has been somehow successful for diminishing high levels of certain pollutants (such as lead), these and other alternative traffic management measures in order to significantly reduced other pollutants (such as ozone) may be offset by everyday levels of road transport emissions in a city that has been in many ways automobile-oriented for some time ago now.
Overall, there are four main issues that need to be revised regarding automobiles (road vehicles or transport) vis á vis air pollution in the MZMC. First, after fifteen years of air quality management in Mexico City (1990-2005), road transport has remained as the major source of air pollution. As shown in Tables 11, 12 and 13 (in the subsequent pages), transport emissions have been by far (and for most pollutants) the main cause for unhealthy urban air quality in the Metropolitan Zone of Mexico City. As early described, these inventories cannot be properly compared because case-studies and methodology used for estimates on atmospheric emissions by sector were different in each inventory. However, it is important to take into account that regardless of the methodology used for each inventory, road transport is the main source of total emissions in all of them including estimates for the year 2010 (Table 14 in the subsequent page).


Second, according to statistical information, road traffic appears as the main source of pollution for at least two pollutants of current concerninMexicoCity: CO and NOx. Even more, although transport is not the main source of pollution for PM10, it represents the second highest contributor of this pollutant with 36% of total emissions just behind the major source (greenery and soil erosion) which contributes with 40%. Similarly, while transport does not constitute the main source for HC, it also represents the second highest contributor with 40% of total emissions below services (as in fixed sources) which contributes with 52%. As the combination of high solar radiation, NOx and HC favours the formation of O3, again, transport largely contributes to the high levels of this pollutant that are continuously experienced in the MZMC.
Third, not all types of automobiles pollute in the same quantity. Not surprisingly, private cars are top on the list of all transport polluters for several pollutants. According to the programme Proaire 2002-2010, private cars were in 1998 well above road vehicle emissions for SO2, HC and CO (Table 15 in following page). Following the last Emissions Inventory (2004) private cars continue as the main source of pollution for such pollutants as SO2, NOx, and CO (Table 16 in following page).


Finally, while private cars are the main source of most pollutants of concern in today's Mexico City atmosphere, they amount for much less than one fourth of the total journeys in the MZMC by mode of transportation. Indeed, private cars account for only 16.1% of the journeys; the rest — 83% — are distributed among other means of public transport such as buses (excluding the newly created Metrobus), underground, minibuses, light trains and electric buses, and to a lesser extent, taxis.
As seen in Table 17 (in the subsequent page), statistical information on mode of transportation is divided up into three main areas (high, medium and low capacity) according to the number of estimated journeys. In dealing with air pollution, it is important to look at the fact that over the last years, while the use of electric-powered transportation (i. e. underground, light trains, electric buses) has gone down, road traffic ran by diesel or fuel has considerably increased. As much as it is true that the former mode of transportation needs power stations, they produce altogether less pollutants emissions per person per journey than such road vehicles as private cars, taxis and minibuses which are all of low capacity.

It is interesting to note that while the underground system started to expand from the mid and late-1990s onwards, less people travelled by this less pollutant emission mode of transportation. With increased number of inhabitants and private cars in the MZMC, it is quite likely that private cars may account for even less percentage of the journeys in the following years. At the same time, it is estimated that the need for urban mobility (i. e. the amount of journeys) across the MZMC will also increase.32
Finally, few more years are needed to analyze whether the implementation of the 'bus corridors' scheme (i. e. low emission buses along certain roads: the only one currently functioning along Avenida de los Insurgentes) will have a positive impact on less transport emissions and less use of private cars.
V. CONCLUSION
This paper has been written with the objective of giving evidence on how the rise in the number (and use) of automobiles — particularly private cars — may hinder government efforts for achieving healthy urban air quality in the Metropolitan Zone of Mexico City. By describing and exploring three main issues — urban and population growth; the current air quality situation; and road vehicle emissions as the main source of polluted air — it is possible to say that there are some conclusions that can be drawn from the information presented in this paper.
Statistical information shows that the territorial expansion and population growth in the Metropolitan Zone of Mexico City continues. Increased rates on population are going to be registered mainly in the surrounding municipalities of the Federal District; likewise, physical expansion will mainly take place in the enhanced conurbated area of Mexico City. At the same time, data on transport indicates that the number of road vehicles has increased to such an extent that speed limits have considerably declined; traffic jams and low vehicle speeds are endlessly experienced across the whole MZMC. Ironically, much of the latter is actually happening on high speed-purpose roads (i. e. freeways). Overall data on transportation and air pollution shows that the main source of most pollutants of concern in today's Mexico City's atmosphere is automobiles — mainly private cars. As much as the number of private cars has increased (thus releasing most pollution emissions over the last years), certain pollutants have significantly decreased. Improved air quality in Mexico City has been moderately achieved due to the introduction of new technologies and the implementation of diverse traffic management schemes.
While road vehicle emissions are not the only cause for air pollution in the capital of Mexico, the main target must include not only clean technologies but schemes for less use of the private car. One of the many challenges that the Mexican government (federal and local) faces at the beginning of this century and for several years to come is to assure urban mobility without compromising almost two decades of urban environmental governance where some air quality improvement has taken place. At the same time, present and future strategies should also aim at reducing high and health-risk levels of pollution, particularly regarding such pollutants as O3 and PM10.The government response to this issue, though, has been mainly focused on technological measures (i. e. cleaner fuels and cleaner cars); while the expansion of the underground has finally started and a new bus corridors programme has been launched, the Mexican government has not changed its policies toward road building expansion and disproportionate urban sprawl which has in turn favoured the use of private vehicles over less polluting public transport systems.
As mentioned few years ago,33 car users have not shifted (as yet) to other means of transport in order to make a positive impact on bringing down those pollutants that are contributing to enhanced morbidity and mortality rates in Mexico City. The current Mexican homo sapiens who lives, works, experiences daily traffic jams, and suffers from poor air quality in Mexico City, is not willing to leave his/her car at home and use public transport instead. On top of this, those who do not own a car yet, want to have one; they are eager to buy one, two, or even more. Social status, consumerism and comfort, lack of public transport, safety, all kind of financial loans and diverse schemes designed by car companies on the advantages of getting an automobile have become in those 'good enough' reasons to purchase and use cars. It seems that, al least for the case of Mexico City, Henry Ford's one-century-ago idea of 'a car for the masses' is succeeding:
I will build a motorcar for the great multitude. It will be large enough for the family but small enough for the individual to run and care for. It will be constructed of the best materials, by the best men to be hired, after the simplest designs that modern engineering can devise. But it will be so low in price that no man making a good salary will be unable to own one — and enjoy with his family the blessing of hours of pleasure in God's great open spaces.34
Driving a car in Mexico City, where low speed levels take place as a result of continuous traffic jams, and increased levels of polluted air are being constantly experienced, is not precisely a blessing. However, the use of public transport has not become into a feasible option for thousands and thousands of car drivers that have little or no incentive to change their current way of moving around the capital city. In the meantime, the number of vehicles on the road - particularly private cars - continues to increase.
If statistical information proves to be right, in a short period of 10 years — from 2000 to 2010 — the number of new vehicles would have incredibly increased by almost 2.0 millions. However, the underlying issue behind this figure is that only one mode of transport - private cars - would have accounted at the end of the present decade for the largest increment: they alone would have augmented by almost 1.7 million!
Surely, no one can deny now that Mexico City's urban dwellers have already initiated a new evolutionary process: they have gone from homo sapiens to homo automobilis.
VI. BIBLIOGRAPHY
COMISIÓN METROPOLITANA PARA LA PREVENCIÓN Y CONTROL DE LA CONTAMINACIÓN AMBIENTAL EN EL VALLE DE MÉXICO, La Contaminación Atmosférica en el Valle de México, México, CMPCCAVM, 1994. [ Links ]
DEPARTAMENTO DEL DISTRITO FEDERAL, Programa Integral de Transporte y Vialidad 1995-2000 (Pitvi 1995-2000), México, DDF, 1995. [ Links ]
ELSOM, Derek, Smog Alert: Managing Urban Air Quality, Londres, Earthscan, 1996. [ Links ]
GAMBOA DE BUEN,Jorge, Ciudad de México, una visión, México, FCE, 1994. [ Links ]
Gobierno del Distrito Federal, Manual para la Aplicación del Programa de Contingencias Ambientales Atmósféricas en el Distrito Federal, México, GDF, 2000, obtained from: http://www.sma.df.gob.mx. [ Links ]
----------, Programa Integral de Transporte y Vialidad 2001-2006 (Pitvi 2001-2006), Gaceta Oficial del Distrito Federal, México, GDF, 2002. [ Links ]
----------, Inventario de Emisiones de la Zona Metropolitana del Valle de México, 2004, México, GDF, 2004; http://www.sma.df.gob.mx/sma/modules.php?name=Aire. [ Links ]
----------, Decreto por el que se Reforma y Adiciona el Programa para Contingencias Ambientales Atmosféricas en el Distrito Federal, Gaceta Oficial del Distrito Federal, México, GDF, 2006. [ Links ]
----------, "Presentación", Medio Ambiente y Transporte Sustentable, México, GDF, s.f.; http://www.sma.df.gob.mx/transportesustentable/. [ Links ]
----------, Fechas de Activación del Programa de Contingencias Ambientales Atmosféricas, México, GDF, 2007, http://www.sma.df.gob.mx/sma/modules.php?na-me=Aire. [ Links ]
INSTITUTO NACIONAL DE ESTADÍSTICA, GEOGRAFÍA E INFORMÁTICA, Ciudad de México (Área Metropolitana). Resultados Definitivos. Tabulados Básicos, XI Censo General de Población y Vivienda 1990, Aguascalientes, México, INEGI, 1992. [ Links ]
----------, Estadísticas Históricas de México, 3a. ed., Aguascalientes, México, INEGI, vols. I y II, 1994. [ Links ]
----------, Estadísticas del Medio Ambiente — México 1997, Aguascalientes, INEGI, 1998. [ Links ]
MOLINA, Luisa T. y MOLINA, Mario J. (coords.), La calidad del aire en la megaciudad de México. Un enfoque integral, trad. de Dulce María Ávila, Bárbara Córcega y Silvia Ruiz de Chávez, México, FCE, 2005. [ Links ]
NAVA ESCUDERO, César, Urban Environmental Governance: Comparing Air Quality Management in London and Mexico City, Aldershot, Ashgate, 2001. [ Links ]
SECRETARÍA DE MEDIO AMBIENTE Y RECURSOS NATURALES et al., Programa para Mejorar la Calidad del Aire de la Zona Metropolitana del Valle de México 2002-2010 (Proaire 2002-2010), México, Semarnap, Secretaría de Salud, GDF, Gobierno del Estado de México, 2002. [ Links ]
----------, Gestión de la calidad del aire en México, México, Semarnap, 2000. [ Links ]
----------, et al., Programa Integral contra la Contaminación Atmosférica de la Zona Metropolitana de la Ciudad de México (Proaire 1995-2000), México, Semarnap, Secretaría de Salud, GDF, Gobierno del Estado de México, 1996. [ Links ]
SECRETARIADO TÉCNICO INTERGUBERNAMENTAL, Programa Integral Contra la Contaminación Atmosférica de la Zona Metropolitana de la Ciudad de México (PICCA 1990), México, STI, 1990. [ Links ]
UNITED NATIONS CENTRE FOR HUMAN SETTLEMENTS, An Urbanizing World: Global Report on Human Settlements, Oxford, England, UNCHS - HABITAT-Oxford University Press, 1996. [ Links ]
----------, The State of the World's Cities Report 2001,UNCHS - HABITAT, 2001; http://www.unchs.org. [ Links ]
WARD, Peter, Mexico City, Londres, Belhaven, 1990. [ Links ]
WOLF, Winfried, Car Mania. A Critical History of Transport,Londres, Pluto, 1996. [ Links ]
Paper presented at Urban Governance in Global Perspective International Workshop, University of Southern California, United States of America, September 17-18, 2004. It has been revised and updated for publication purposes.
1 Wolf, Winfried, Car Mania. A Critical History of Transport, Londres, Pluto, 1996, p. 150.
2 See, for details, United Nations Centre for Human Settlements, The State of the World's Cities Report 2001, UNCHS - HABITAT, 2001; http://www.unchs.org.
3 Nava Escudero, César, Urban Environmental Governance: Comparing Air Quality Management in London and Mexico City, Aldershot, Ashgate, 2001; Ward, Peter, Mexico City, Londres, Belhaven, 1990.
4 See, for a more detailed description, Gamboa de Buen, Jorge, Ciudad de México, una visión, México, FCE, 1994; Nava Escudero, César, op. cit., note 3.
5 Instituto Nacional de Estadística, Geografía e Informática, Estadísticas del Medio Ambiente - México 1997, Aguascalientes, México, INEGI, 1998.
6 Historical data can be obtained from previous Government Reports, such as, Instituto Nacional de Estadística, Geografía e Informática, Ciudad de México (Área Metropolitana). Resultados Definitivos. Tabulados Básicos, XI Censo General de Población y Vivienda 1990, Aguascalientes, México, INEGI, 1992; and Instituto Nacional de Estadística, Geografía e Informática, Estadísticas Históricas de México, 3a. ed., Aguascalientes, México, INEGI, vols. I y II, 1994.
7 Instituto Nacional de Estadística, Geografía e Informática, op. cit., note 5.
8 See, Gobierno del Distrito Federal, Programa Integral de Transporte y Vialidad 2001-2006 (Pitvi 2001-2006), Gaceta Oficial del Distrito Federal, México, GDF, 2002.
9 Idem.
10 These three programmes are known as: Programa Integral contra la Contaminación Atmosférica de la Zona Metropolitana de la Ciudad de México (PICCA 1990); Programa para Mejorar la Calidad del Aire en el Valle de México 1995-2000 (Proaire 1995-2000); Programa para Mejorar la Calidad del Aire de la Zona Metropolitana del Valle de México 2002-2010 (Proaire 2002-2010).
11 On the one hand, the 1995 Comprehensive Programme on Transport and Traffic Management (Pitvi 1995-2000) stated that the Metropolitan Area of Mexico City covered 16 delegated units of the Federal District and 28 conurbated municipalities of the State of Mexico; see, Departamento del Distrito Federal, Programa Integral de Transporte y Vialidad 1995-2000 (Pitvi 1995-2000), México, DDF, 1995. On the other hand, the 2002 Comprehensive Programme on Transport and Traffic Management (Pitvi 2001-2006) establishes that the MZMC covers 16 delegated units of the Federal District, 58 conurbated municipalities of the State of Mexico, and 1 municipality from Hidalgo, see, Gobierno del Distrito Federal, op. cit., note 8.
12 Even academic reports make a different use of such terms. In this sense, see, for example, Molina, Luisa T. y Molina, Mario J. (coords.), La calidad del aire en la megaciudad de México. Un enfoque integral, trad. de Dulce María Ávila, Bárbara Córcega y Silvia Ruiz de Chávez, México, FCE, 2005, who prefer to use the term Metropolitan Area of Mexico City.
13 Nava Escudero, César, op. cit., note 3.
14 Secretaría de Medio Ambiente y Recursos Naturales et al., Programa para Mejorar la Calidad del Aire de la Zona Metropolitana del Valle de México 2002-2012 (Proaire 2002-2012), México, Semarnap-Secretaría de Salud-GDF-Gobierno del Estado de México, 2002.
15 Gobierno del Distrito Federal, "Presentación", Medio Ambiente y Transporte Sustentable, México, GDF, s. f.; http://www.sma.df.gob.mx/transportesustentable/.
16 The current emergency plan - Programa de Contingencias Ambientales Atmosféricas (PCAA) - is divided into three phases: Pre-contingency (for O3 or for PM10), Phase 1 (for O3 or for PM10 or for a combination of both), and Phase 2 (for O3 or for PM10). According to a recent government programme resolution (August 2006), the Pre-contingency phase is called at 170 (or more) Imeca points for O3 and at 160 (or more) Imeca points for PM10; Phase 1 is called at 200 (or more) Imeca points for O3 and at 175 (or more) Imeca points for PM10; and when combined, Phase I is called at 180 (or more) Imeca points for O3 and at 125 (or more) Imeca points for PM10; Phase II is called at 250 (or more) Imeca points for ozone and at 250 (or more) Imeca points for PM10. Actions (depending whether Pre-contingency, Phase I or Phase II) include, among others, no open air activities at schools and halting of street repairs, a variety of restrictions in relation to the "one day without the car" programme, reductions in the use of government vehicles, diverse traffic management measures to minimize traffic jams, cuts in industrial emissions, power plants activities reduced, and so on. For a detailed description on the implementation of the emergency plan for ozone and PM10, see Gobierno del Distrito Federal, Manual para la Aplicación del Programa para Contingencias Ambientales Atmosféricas en el Distrito Federal, México, 2000, http://www.sma.df.gob.mx, and the recently published Gobierno del Distrito Federal, Decreto por el que se Reforma y Adiciona el Programa para Contingencias Ambientales Atmosféricas en el Distrito Federal, Gaceta Oficial del Distrito Federal, México, GDF, 2006.
17 See, also, Secretaría de Medio Ambiente y Recursos Naturales et al., op. cit., note 14.
18 Gobierno del Distrito Federal, op. cit., note 15.
19 Comisión Metropolitana para la Prevención y Control de la Contaminación Ambiental en el Valle de México, La Contaminación Atmosférica en el Valle de México, México, CMPCCAVM, 1994.
20 The 1998 Emissions Inventory is revised, enhanced and updated every two years. So far, three more inventories have been issued by Mexican authorities for the years 2000, 2002, and 2004. The 2004 Emissions Inventory provides statistical information for the MZMC based on the same physical and politico-administrative boundaries that the Proaire 2002-2012 recognises, that is to say, it refers to a territorial extension of more than 3500 kms2 (350 000 ha) that covers the 16 delegated units of the Federal District and the 18 conurbated municipalities of the surrounding State of Mexico. More information on the 2004 Emissions Inventory can be obtained from: Gobierno del Distrito Federal, Inventario de Emisiones de la Zona Metropolitana del Valle de México, 2004, México, GDF, 2004; http://www.sma.df.gob.mx/sma/modules.php?name=Aire.
21 For more details, see idem; and Secretaría de Medio Ambiente y Recursos Naturales et al., op. cit., nota 14.
22 This has been recognised since the year 2000 as clearly stated in: Secretaría de Medio Ambiente, Recursos Naturales y Pesca, Gestión de la Calidad del Aire en México, México, Semarnap, 2000; Secretaría de Medio Ambiente y Recursos Naturales et al., op. cit., note 14. In the same vain, scientists have also pointed out their preoccupation on such pollutants: see Molina, Luisa T. y Molina, Mario J. (coords.), op. cit., note 12, p. 89.
23 Nava Escudero, César, op. cit., note 3, p. 35.
24 Secretaría de Medio Ambiente y Recursos Naturales et al., op. cit., note 14.
25 According to Secretaría de Medio Ambiente y Recursos Naturales et al., op. cit., nota 14, only 3.9% of all vehicles in the MZMC go off the road every year.
26 See, for example, United Nations Centre for Human Settlements, An Urbanizing World: Global Report on Human Settlements, Oxford, England, UNCHS - HABITAT-Oxford University Press, 1996.
27 Secretaría de Medio Ambiente, Recursos Naturales y Pesca et al., Programa Integral contra la Contaminación Atmosférica de la Zona Metropolitana de la Ciudad de México (Proaire 1995-2000), México, Semarnap-Secretaría de Salud-GDF-Gobierno del Estado de México, 1996.
28 Gobierno del Distrito Federal, op. cit., note 8.
29 Wolf, Winfried, op. cit., note 1, p. 69.
30 See Elsom, Derek, Smog Alert: managing urban air quality, London, Earthscan, 1996, pp. 143-145.
31 Ibidem, p. 148.
32 Secretaría de Medio Ambiente y Recursos Naturales et al, op. cit, note 14, pp. 2-20.
33 See Nava Escudero, César, op. cit., note 3, p. 234.
34 Cited in Wolf, Winfried, op. cit., note 1, p. 70.

