


 nova página do texto(beta)
 Inglês (pdf)
 Artigo em XML
 Referências do artigo
 Enviar este artigo por email
 Citado por SciELO
  Similares em
SciELO
Similares em
SciELO 
 Permalink
Introduction
In Mexico, childhood cancer is the leading cause of death from disease in children aged 5-14 years and the second in children under five. Acute lymphoblastic leukemia (ALL) is the most common malignant neoplasm in Mexican children and adolescents.1 As of 2005, Seguro Popular included coverage for chemotherapy treatment based on national protocols within the Catastrophic Expenses Protection Fund. The coverage of the expenses derived from complications were covered by the hospitals and/or by the support of non-governmental organizations.
Mortality is an indicator in cancer determined by the characteristics of the patient and the disease at diagnosis, the response to treatment, and the presence and severity of complications.2 Mortality can also be the reflect of the physical and human infrastructure in hospitals for the attention of pediatric patients with cancer as well as the quality of attention. Infrastructure have been described to vary in the days of the week and the time of the day. Another factor described is that care in pediatric hospitals show better outcomes than general hospitals. Finally, in Mexico there is no periodic assessment of performance in procedures and outcomes.3
This is the reason why our aim is to determine the magnitude of mortality due to ALL nationally and by age group, sex, state of residence and insurance status, as well as to evaluate time trends during the period 1998-2018.
Materials and methods
Data sources
Information on mortality from ALL was obtained from death certificates, validated by the National Institute of Statistics and Geography (Instituto Nacional de Estadística y Geografía, INEGI) from the period 1998-2018. Causes of death in these datasets are codified using the International Statistical Classification of Diseases and Related Health Problems, Tenth Revision (ICD-10). We included acute lymphoblastic leukemia (ICD-10 code C91.0). There were 33 705 deaths identified with this code. Records with missing sex (n=6), missing age or ≥20 years of age (n=17 300), and with missing state of residence or international citizens residing in Mexico (n=89) were excluded from our study. There were 16 310 deaths included in our analysis.
Population data
Population estimates by age, sex, state of residence, and year were obtained from the National Population Council (Consejo Nacional de Población, Conapo).4 Using census data from INEGI (2000 and 2010), intercensal survey (2015), and National Health Nutrition Survey (Encuesta Nacional de Salud y Nutrición, Ensanut 2006 and 2012), population proportions by health insurance affiliation were estimated using adjusted ordinary least squares models (methods described elsewhere).5,6,7,8
Statistical analysis
Health insurance affiliation
We classified health insurance affiliation according to membership in one of five institutions: (1) Mexican Institute for Social Security (Instituto Mexicano del Seguro Social, IMSS); (2) Institute of Social Security and Services for Public Servants (Instituto de Seguridad y Servicios Sociales de los Trabajadores del Estado, ISSSTE) (federal); (3) those without health insurance (including those with Seguro Popular), IMSS Prospera or without health insurance; (4) those with other private insurance; or (5) not mentioned. Registries with more than one reported affiliation (n=2) were excluded from the analysis as we could not confirm the institution where they received care. Registries with private providers were not included in analysis by health insurance (n=661). Registries with undocumented affiliation were eliminated (n=973).
Mortality estimation
National mortality rates from 1998 to 2018 were calculated by sex and year using Conapo population estimates, and when we stratified by health insurance, we used our estimated populations as denominators. National and state-level five-year average (2014-2018) mortality rates by sex were calculated (expressed per 100 000 person-years) using Conapo population estimates. Age-standardized mortality rates (ASMR) and their respective 95% confidence intervals were calculated through direct method using the World Health Organization (WHO) 2000-2025 World Standard Population.9 Analyses were performed with Stata (Release 14. College Station, TX:StataCorp LP).
Time trends
To analyze mortality trends by sex, health insurance and state of residence, we estimated temporal trends using joinpoint regression analysis (Joinpoint Statistical Software version 4.9.0), with a maximum of three joinpoints allowed in each model. Each temporal trend is identified in the 1998 to 2018 period by the annual percent change (APC). To determine the direction and magnitude of the recent trends, the average annual percent change (AAPC) and respective 95% confidence interval was evaluated for the first five years (1998-2002), last five years (2014 -2018) and the full range (1998-2018). Statistically significant AAPCs are documented with an asterisk (*).
Mortality trends
To identify changes in mortality rate trends, we performed a Joinpoint regression using the Joinpoint Regresion Program, Version 4.5.0.1 (Statistical Research and Applications Branch, National Cancer Institute). Briefly, the program uses mortality rates as the dependent variable and the year of occurrence as the independent variable and identifies the year (s) in which a change in trend occurs. We chose this method widely used in cancer mortality trend analysis because it estimates the APC in rates between trend change points and also estimates the AAPC throughout the study period.
Results
During a period of 20 years (1998-2018), 33 705 deaths from childhood ALL were recorded of which 16 310 were included in our analysis. Mean age at death in boys was 10.4 years and 9.6 years in girls. ASMR increased from 1.6 per 100 000 in 1998 to 1.7 per 100 000 in 2018. For boys, the ASMR increased from 1.7 to 1.8 while, for girls, we observed a decrease from 1.6 to 1.5. In the first five years of the study period, a constant annual increase in mortality was observed for both sexes (1998-2002 AAPC 0.6 in boys, and 1998-2002 AAPC 0.3 in girls) (table I, figure 1).
Table I: Average annual percent changes for ALL age standardized mortality rates, by state and sex. Mexico, 1998-2018
|
Male |
Female |
|||||||||||
|
1998-2002 |
2014-2018 |
1998 - 2018 |
1998-2002 |
2014-2018 |
1998 - 2018 |
|||||||
|
Location |
AAPC |
(95%CI) |
AAPC |
(95% CI) |
AAPC |
(95%CI) |
AAPC |
(95%CI) |
AAPC |
(95% CI) |
AAPC |
(95%CI) |
|
Aguascalientes |
1 |
(-2.1, 4.2) |
1 |
(-2.1, 4.2) |
1 |
(-2.1, 4.2) |
-3.4 |
(-11.8, 5.9) |
-3.4 |
(-11.8, 5.9) |
-3.4 |
(-11.8, 5.9) |
|
Baja California |
-0.7 |
(-2.8, 1.4) |
-0.7 |
(-2.8, 1.4) |
-0.7 |
(-2.8, 1.4) |
-3 |
(-6.1, 0.3) |
-3 |
(-6.1, 0.3) |
-3 |
(-6.1, 0.3) |
|
Baja California Sur |
-8.8 |
(-20.8, 5) |
-8.8 |
(-20.8, 5) |
-8.8 |
(-20.8, 5) |
7.4 |
(-10.9, 29.6) |
7.4 |
(-10.9, 29.6) |
7.4 |
(-10.9, 29.6) |
|
Campeche |
0.3 |
(-3.9, 4.8) |
0.3 |
(-3.9, 4.8) |
0.3 |
(-3.9, 4.8) |
-0.6 |
(-4.9, 3.8) |
-0.6 |
(-4.9, 3.8) |
-0.6 |
(-4.9, 3.8) |
|
Coahuila |
-0.8 |
(-2.9, 1.4) |
-0.8 |
(-2.9, 1.4) |
-0.8 |
(-2.9, 1.4) |
-0.1 |
(-3.4, 3.4) |
-0.1 |
(-3.4, 3.4) |
-0.1 |
(-3.4, 3.4) |
|
Colima |
1.3 |
(-16.3, 22.5) |
1.3 |
(-16.3, 22.5) |
1.3 |
(-16.3, 22.5) |
9.1 |
(-14.9, 40) |
9.1 |
(-14.9, 40) |
9.1 |
(-14.9, 40) |
|
Chiapas |
3.4* |
(1.5, 5.4) |
3.4* |
(1.5, 5.4) |
3.4* |
(1.5, 5.4) |
2* |
(0.1, 4) |
2* |
(0.1, 4) |
2* |
(0.1, 4) |
|
Chihuahua |
0.3 |
(-1.8, 2.3) |
0.3 |
(-1.8, 2.3) |
0.3 |
(-1.8, 2.3) |
1.2 |
(-1.6, 4) |
1.2 |
(-1.6, 4) |
1.2 |
(-1.6, 4) |
|
México City |
1.6* |
(0.4, 2.7) |
1.6* |
(0.4, 2.7) |
1.6* |
(0.4, 2.7) |
0.7 |
(-1.1, 2.5) |
0.7 |
(-1.1, 2.5) |
0.7 |
(-1.1, 2.5) |
|
Durango |
-0.5 |
(-4.7, 3.8) |
-0.5 |
(-4.7, 3.8) |
-0.5 |
(-4.7, 3.8) |
0.1 |
(-9.6, 10.9) |
0.1 |
(-9.6, 10.9) |
0.1 |
(-9.6, 10.9) |
|
Guanajuato |
0.1 |
(-1.9, 2.1) |
0.1 |
(-1.9, 2.1) |
0.1 |
(-1.9, 2.1) |
0.2 |
(-1.5, 1.9) |
0.2 |
(-1.5, 1.9) |
0.2 |
(-1.5, 1.9) |
|
Guerrero |
3.1* |
(1, 5.2) |
-17.8 |
(-41.5, 15.4) |
-1.5 |
(-8.1, 5.7) |
3.1* |
(1.2, 4.9) |
3.1* |
(1.2, 4.9) |
3.1* |
(1.2, 4.9) |
|
Hidalgo |
-3.2 |
(-8, 1.9) |
-13.9 |
(-38.5, 20.7) |
-1.7 |
(-9.2, 6.5) |
1.4 |
(-0.6, 3.5) |
1.4 |
(-0.6, 3.5) |
1.4 |
(-0.6, 3.5) |
|
Jalisco |
0.1 |
(-0.9, 1.2) |
0.1 |
(-0.9, 1.2) |
0.1 |
(-0.9, 1.2) |
-0.4 |
(-1.5, 0.8) |
-0.4 |
(-1.5, 0.8) |
-0.4 |
(-1.5, 0.8) |
|
Estado de México |
0.3 |
(-0.7, 1.3) |
0.3 |
(-0.7, 1.3) |
0.3 |
(-0.7, 1.3) |
0.1 |
(-1, 1.2) |
0.1 |
(-1, 1.2) |
0.1 |
(-1, 1.2) |
|
Michoacán |
0.2 |
(-1.5, 2) |
0.2 |
(-1.5, 2) |
0.2 |
(-1.5, 2) |
-1.8 |
(-4.3, 0.8) |
-1.8 |
(-4.3, 0.8) |
-1.8 |
(-4.3, 0.8) |
|
Morelos |
-5.4 |
(-10.8, 0.4) |
-12.5 |
(-23.9, 0.7) |
-2.2 |
(-7.5, 3.4) |
1.2 |
(-2.6, 5.1) |
1.2 |
(-2.6, 5.1) |
1.2 |
(-2.6, 5.1) |
|
Nayarit |
0.1 |
(-2.7, 3.1) |
0.1 |
(-2.7, 3.1) |
0.1 |
(-2.7, 3.1) |
6.1 |
(-8.1, 22.4) |
6.1 |
(-8.1, 22.4) |
6.1 |
(-8.1, 22.4) |
|
Nuevo León |
-0.1 |
(-1.6, 1.5) |
-0.1 |
(-1.6, 1.5) |
-0.1 |
(-1.6, 1.5) |
-0.9 |
(-2.9, 1.1) |
-0.9 |
(-2.9, 1.1) |
-0.9 |
(-2.9, 1.1) |
|
Oaxaca |
1.9* |
(0.1, 3.6) |
1.9* |
(0.1, 3.6) |
1.9* |
(0.1, 3.6) |
3.4* |
(1.4, 5.4) |
3.4* |
(1.4, 5.4) |
3.4* |
(1.4, 5.4) |
|
Puebla |
1.5 |
(-0.1, 3.2) |
1.5 |
(-0.1, 3.2) |
1.5 |
(-0.1, 3.2) |
-2 |
(-4.6, 0.6) |
14.9 |
(-15.4, 56) |
1.1 |
(-5.2, 7.9) |
|
Querétaro |
-2.2 |
(-4.6, 0.2) |
-2.2 |
(-4.6, 0.2) |
-2.2 |
(-4.6, 0.2) |
-3.1* |
(-5.9, -0.3) |
-3.1* |
(-5.9, -0.3) |
-3.1* |
(-5.9, -0.3) |
|
Quintana Roo |
0.6 |
(-2.2, 3.5) |
0.6 |
(-2.2, 3.5) |
0.6 |
(-2.2, 3.5) |
-1.9 |
(-11, 8) |
-1.9 |
(-11, 8) |
-1.9 |
(-11, 8) |
|
San Luis Potosí |
0.4 |
(-2.2, 3) |
0.4 |
(-2.2, 3) |
0.4 |
(-2.2, 3) |
0.8 |
(-2.1, 3.8) |
0.8 |
(-2.1, 3.8) |
0.8 |
(-2.1, 3.8) |
|
Sinaloa |
-2 |
(-4.2, 0.2) |
-2 |
(-4.2, 0.2) |
-2 |
(-4.2, 0.2) |
-2.1 |
(-4.7, 0.6) |
-2.1 |
(-4.7, 0.6) |
-2.1 |
(-4.7, 0.6) |
|
Sonora |
-1.9 |
(-6.8, 3.4) |
-13* |
(-21.7, -3.3) |
-1.8 |
(-8.1, 5) |
0.5 |
(-3.1, 4.3) |
0.5 |
(-3.1, 4.3) |
0.5 |
(-3.1, 4.3) |
|
Tabasco |
1.3 |
(-0.7, 3.3) |
1.3 |
(-0.7, 3.3) |
1.3 |
(-0.7, 3.3) |
0.1 |
(-2.2, 2.6) |
0.1 |
(-2.2, 2.6) |
0.1 |
(-2.2, 2.6) |
|
Tamaulipas |
-0.7 |
(-2.3, 0.9) |
-0.7 |
(-2.3, 0.9) |
-0.7 |
(-2.3, 0.9) |
-0.3 |
(-3.1, 2.5) |
-0.3 |
(-3.1, 2.5) |
-0.3 |
(-3.1, 2.5) |
|
Tlaxcala |
-2.9 |
(-6.9, 1.2) |
-2.9 |
(-6.9, 1.2) |
-2.9 |
(-6.9, 1.2) |
-5.3* |
(-9.4, -1.1) |
-5.3* |
(-9.4, -1.1) |
-5.3* |
(-9.4, -1.1) |
|
Veracruz |
0.8 |
(-0.6, 2.2) |
0.8 |
(-0.6, 2.2) |
0.8 |
(-0.6, 2.2) |
1.3 |
(-0.4, 3.1) |
1.3 |
(-0.4, 3.1) |
1.3 |
(-0.4, 3.1) |
|
Yucatán |
12.7* |
(1.1, 25.6) |
-4.5 |
(-9.1, 0.3) |
2 |
(-2.8, 7.1) |
2.9* |
(0.3, 5.6) |
2.9* |
(0.3, 5.6) |
2.9* |
(0.3, 5.6) |
|
Zacatecas |
-2.8 |
(-6, 0.4) |
-2.8 |
(-6, 0.4) |
-2.8 |
(-6, 0.4) |
-1.7 |
(-5, 1.8) |
-1.7 |
(-5, 1.8) |
-1.7 |
(-5, 1.8) |
|
National |
0.6* |
(0.2, 1.0) |
0.6* |
(0.2, 1.0) |
0.6* |
(0.2, 1.0) |
0.3 |
(-0.2, 0.7) |
0.3 |
(-0.2, 0.7) |
0.3 |
(-0.2, 0.7) |
First 5-year period (1998-2002), last 5-year period (2014-2018) and full 21-year period (1998-2018) average annual percent changes (AAPC’s) for acute lymphoblastic leukemia (ALL) age standardized mortality rates (ASMR, WHO Standard Population, 2000-2025) among children younger than 19 years, in the 32 states from Mexico.
AAPC: Average annual percent change for age-standardized mortality rates.
* Significantly different from 0 at alpha < 0.05

* Significantly different from 0 at alpha < 0.05.
AAPC: average annual percent change.
Figure 1 National ALL age-standardized mortality rates, trends, and AAPC by sex. Mexico, 1998-2018
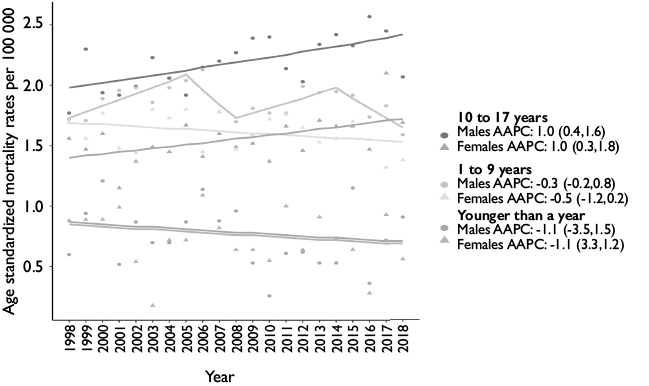
When we compared age groups, we observed that ASMR in children under 1 year has been variable, ranging from 0.6 deaths per 100 000 in 1998, 1.0 in 2008 and 0.9 in 2018, with an AAPC for the entire period of -1.1. In the first 5-year period (1998-2002) we observed a significant annual increase in the mortality of children aged 1-9 years; for girls in this age group, a constant but not significant annual decrease is observed throughout the entire period (1998-2018 AAPC 0.5). For the 10-17-year-old group, a constant and significant annual increase is observed with an AAPC of 1 throughout the entire period (table II, figure 2).
Table II Age standardized national mortality trends for acute limphoblastic leukemia, by age and sex. Mexico, 1998-2018
|
Year |
<1 y |
1-9 years |
10-17 years |
<1 y |
1-9 years |
10-17 years |
||||||
|
ASMR |
(95%CI) |
ASMR |
(95%CI) |
ASMR |
(95%CI) |
ASMR |
(95%CI) |
ASMR |
(95%CI) |
ASMR |
(95%CI) |
|
|
1998 |
0.6 |
(0.2, 1) |
1.7 |
(1.5, 2) |
1.8 |
(1.5, 2.1) |
0.9 |
(0.3, 1.4) |
1.7 |
(1.4, 1.9) |
1.6 |
(1.3, 1.8) |
|
1999 |
0.9 |
(0.4, 1.5) |
1.7 |
(1.5, 2) |
2.3 |
(2, 2.6) |
0.9 |
(0.3, 1.4) |
1.6 |
(1.3, 1.8) |
1.5 |
(1.2, 1.7) |
|
2000 |
1.2 |
(0.6, 1.8) |
1.9 |
(1.6, 2.1) |
1.9 |
(1.7, 2.2) |
0.9 |
(0.3, 1.4) |
1.8 |
(1.5, 2) |
1.6 |
(1.3, 1.9) |
|
2001 |
0.5 |
(0.1, 0.9) |
2.0 |
(1.7, 2.2) |
1.9 |
(1.6, 2.2) |
1.0 |
(0.4, 1.6) |
1.5 |
(1.2, 1.7) |
1.1 |
(0.9, 1.4) |
|
2002 |
0.9 |
(0.3, 1.4) |
2.0 |
(1.7, 2.3) |
2.0 |
(1.7, 2.3) |
0.5 |
(0.1, 1) |
1.4 |
(1.2, 1.7) |
1.4 |
(1.1, 1.6) |
|
2003 |
0.7 |
(0.2, 1.2) |
1.9 |
(1.6, 2.1) |
2.2 |
(1.9, 2.5) |
0.2 |
(-0.1, 0.4) |
1.8 |
(1.5, 2.1) |
1.5 |
(1.2, 1.8) |
|
2004 |
0.7 |
(0.2, 1.2) |
2.0 |
(1.7, 2.2) |
2.1 |
(1.8, 2.4) |
0.7 |
(0.2, 1.2) |
1.7 |
(1.5, 2) |
1.5 |
(1.2, 1.7) |
|
2005 |
0.9 |
(0.3, 1.4) |
2.0 |
(1.8, 2.3) |
1.9 |
(1.6, 2.2) |
0.7 |
(0.2, 1.2) |
1.8 |
(1.5, 2.1) |
1.7 |
(1.4, 1.9) |
|
2006 |
1.1 |
(0.5, 1.8) |
2.1 |
(1.8, 2.4) |
2.1 |
(1.8, 2.4) |
1.1 |
(0.5, 1.7) |
1.5 |
(1.2, 1.7) |
1.4 |
(1.2, 1.7) |
|
2007 |
0.9 |
(0.3, 1.4) |
1.8 |
(1.5, 2) |
2.2 |
(1.9, 2.5) |
0.8 |
(0.3, 1.4) |
1.8 |
(1.5, 2) |
1.6 |
(1.3, 1.9) |
|
2008 |
1.0 |
(0.4, 1.5) |
1.7 |
(1.5, 2) |
2.3 |
(2, 2.6) |
0.6 |
(0.2, 1.1) |
1.5 |
(1.2, 1.7) |
1.5 |
(1.2, 1.7) |
|
2009 |
0.5 |
(0.1, 0.9) |
1.8 |
(1.5, 2.1) |
2.4 |
(2.1, 2.7) |
0.6 |
(0.2, 1.1) |
1.6 |
(1.3, 1.8) |
1.5 |
(1.3, 1.8) |
|
2010 |
0.3 |
(0, 0.6) |
1.8 |
(1.5, 2) |
2.4 |
(2.1, 2.7) |
0.5 |
(0.1, 1) |
1.7 |
(1.5, 2) |
1.4 |
(1.1, 1.6) |
|
2011 |
0.6 |
(0.2, 1.1) |
1.8 |
(1.5, 2) |
2.1 |
(1.8, 2.4) |
1.0 |
(0.4, 1.6) |
1.8 |
(1.5, 2) |
1.7 |
(1.4, 1.9) |
|
2012 |
0.6 |
(0.2, 1.1) |
2.0 |
(1.7, 2.3) |
2.0 |
(1.7, 2.3) |
0.6 |
(0.2, 1.1) |
1.7 |
(1.4, 1.9) |
1.5 |
(1.2, 1.7) |
|
2013 |
0.5 |
(0.1, 1) |
1.9 |
(1.7, 2.2) |
2.3 |
(2, 2.7) |
0.9 |
(0.3, 1.5) |
1.5 |
(1.3, 1.8) |
1.7 |
(1.4, 2) |
|
2014 |
0.5 |
(0.1, 1) |
2.0 |
(1.7, 2.2) |
2.4 |
(2.1, 2.7) |
0.7 |
(0.2, 1.2) |
1.6 |
(1.3, 1.8) |
1.7 |
(1.4, 1.9) |
|
2015 |
1.2 |
(0.5, 1.8) |
1.9 |
(1.7, 2.2) |
2.3 |
(2, 2.6) |
0.6 |
(0.2, 1.1) |
1.7 |
(1.4, 2) |
1.7 |
(1.4, 1.9) |
|
2016 |
0.4 |
(0, 0.7) |
1.7 |
(1.5, 2) |
2.6 |
(2.2, 2.9) |
0.3 |
(0, 0.6) |
1.5 |
(1.3, 1.8) |
1.5 |
(1.2, 1.7) |
|
2017 |
0.7 |
(0.2, 1.2) |
1.8 |
(1.6, 2.1) |
2.4 |
(2.1, 2.8) |
0.9 |
(0.4, 1.5) |
1.3 |
(1.1, 1.5) |
2.1 |
(1.8, 2.4) |
|
2018 |
0.9 |
(0.3, 1.5) |
1.6 |
(1.3, 1.8) |
2.1 |
(1.8, 2.4) |
0.6 |
(0.1, 1) |
1.4 |
(1.1, 1.6) |
1.7 |
(1.4, 2) |
|
Male |
Female |
|||||||||||
|
<1 y |
1-9 years |
10-17 years |
<1 y |
1-9 years |
10-17 years |
|||||||
|
Period |
AAPC |
(95% CI) |
AAPC |
(95% CI) |
AAPC |
(95% CI) |
AAPC |
(95% CI) |
AAPC |
(95% CI) |
AAPC |
(95% CI) |
|
1998-2002 |
-1.1 |
(-3.5, 1.5) |
2.7* |
(0.7, 4.7) |
1* |
(0.4, 1.6) |
-1.1 |
(-3.3, 1.2) |
-0.5 |
(-1.2, 0.2) |
1* |
(0.3, 1.8) |
|
1998-2018 |
-1.1 |
(-3.5, 1.5) |
-0.3 |
(-2.5, 2) |
1* |
(0.4, 1.6) |
-1.1 |
(-3.3, 1.2) |
-0.5 |
(-1.2, 0.2) |
1* |
(0.3, 1.8) |
|
2014-2018 |
-1.1 |
(-3.5, 1.5) |
-4.6 |
(-8.9, 0.1) |
1* |
(0.4, 1.6) |
-1.1 |
(-3.3, 1.2) |
-0.5 |
(-1.2, 0.2) |
1* |
(0.3, 1.8) |
First 5-year period (1998-2002), last 5-year period (2014-2018) and full 21-year period (1998-2018) crude mortality rate per 100 000 among children younger than 19 years, in Mexico.
ASMR: age standardized mortality rates; AAPC: Average annual percent change for ASMR
* Significantly different from 0 at alpha < 0.05
* Significantly different from 0 at alpha < 0.05.
AAPC: average annual percent change
Figure 2 Age standardized national ALL mortality rates, trends and AAPCs by age group and sex. Mexico, 1998-2018
We performed an analysis stratifying by health insurance affiliation and observed that those without social security have the lowest mortality rates, these rates being lower in girls, followed by those affiliated with ISSSTE. As of 2006, an increasing trend has been observed in those boys and girls without social security. For children affiliated with IMSS, a downward trend throughout the period was observed for both sexes and this decrease was statistically significant (1998-2018 APC -1.0 in boys and -1.2 in girls), and for children affiliated with ISSSTE a decrease was also observed but this was not significant (figure 3).

* Significantly different from 0 at alpha < 0.05.
AAPC: average annual percent change
IMSS: Instituto Mexicano del Seguro Social
ISSSTE: Instituto de Seguridad y Servicios Sociales para los Trabajadores del Estado
Figure 3 Age standardized national ALL mortality rates, trends and AAPCs by health insurance and sex. Mexico, 1998-2018
When we compared mortality rates at the state level, we observed that during the last five years studied (2014-2018) the states that reported the highest number of deaths were Tabasco, Hidalgo, Chiapas, Puebla, Yucatán, Oaxaca, and Quintana Roo, while states with the lowest number of deaths were Durango, Sinaloa, Zacatecas, Baja California, Michoacán, Aguascalientes and Chihuahua (figure 4). Chiapas, Sonora, Oaxaca, Yucatán, Guerrero, and Mexico City showed a significant annual increase in mortality. While in Tlaxcala and Querétaro a significant annual decrease was observed (table III).

ALL: acute lymphoblastic leukemia
ASMR: age standardized mortality rates
Figure 4 Geographical distribution of subnational age-standardized average annual ALL mortality rate by sex. Mexico, 2014-2018
Table III Five-year average age-standardized acute lymphoblastic leukemia mortality rates and average annual percent change, by state and sex. Mexico, 2014-2018
|
Location |
Male |
Female |
||||||
|
ASMR* |
(95%CI) |
AAPC‡ |
(95%CI) |
ASMR* |
(95%CI) |
AAPC‡ |
(95%CI) |
|
|
Chiapas |
2.8 |
(2.4, 3.3) |
3.4§ |
(1.5, 5.4) |
2 |
(1.6, 2.4) |
2§ |
(0.1, 4) |
|
Sonora |
1.9 |
(1.4, 2.4) |
-13§ |
(-21.7, -3.3) |
1.6 |
(1.1, 2.1) |
0.5 |
(-3.1, 4.3) |
|
Oaxaca |
2.2 |
(1.7, 2.6) |
1.9§ |
(0.1, 3.6) |
2 |
(1.6, 2.5) |
3.4§ |
(1.4, 5.4) |
|
México City |
2.3 |
(1.9, 2.7) |
1.6§ |
(0.4, 2.7) |
1.7 |
(1.4, 2.1) |
0.7 |
(-1.1, 2.5) |
|
National |
2.1 |
(2, 2.1) |
0.6§ |
(0.2, 1.0) |
1.5 |
(1.5, 1.6) |
0.3 |
(-0.2, 0.7) |
|
Puebla |
2.8 |
(2.4, 3.2) |
1.5 |
(-0.1, 3.2) |
1.9 |
(1.6, 2.3) |
14.9 |
(-15.4, 56) |
|
Tabasco |
2.9 |
(2.2, 3.6) |
1.3 |
(-0.7, 3.3) |
1.9 |
(1.3, 2.5) |
0.1 |
(-2.2, 2.6) |
|
Colima |
1.6 |
(0.7, 2.6) |
1.3 |
(-16.3, 22.5) |
1.9 |
(0.8, 3) |
9.1 |
(-14.9, 40) |
|
Aguascalientes |
2.3 |
(1.5, 3.1) |
1 |
(-2.1, 4.2) |
0.9 |
(0.4, 1.5) |
-3.4 |
(-11.8, 5.9) |
|
Veracruz |
1.9 |
(1.6, 2.2) |
0.8 |
(-0.6, 2.2) |
1.8 |
(1.5, 2.1) |
1.3 |
(-0.4, 3.1) |
|
Quintana Roo |
2.8 |
(2, 3.7) |
0.6 |
(-2.2, 3.5) |
1.1 |
(0.5, 1.6) |
-1.9 |
(-11, 8) |
|
San Luis Potosí |
1.7 |
(1.2, 2.2) |
0.4 |
(-2.2, 3) |
1.3 |
(0.8, 1.7) |
0.8 |
(-2.1, 3.8) |
|
Campeche |
2.2 |
(1.2, 3.2) |
0.3 |
(-3.9, 4.8) |
1.7 |
(0.8, 2.5) |
-0.6 |
(-4.9, 3.8) |
|
State of México |
2 |
(1.8, 2.2) |
0.3 |
(-0.7, 1.3) |
1.5 |
(1.3, 1.7) |
0.1 |
(-1, 1.2) |
|
Chihuahua |
1.5 |
(1.1, 1.9) |
0.3 |
(-1.8, 2.3) |
1.4 |
(1, 1.8) |
1.2 |
(-1.6, 4) |
|
Michoacán |
1.7 |
(1.3, 2.1) |
0.2 |
(-1.5, 2) |
0.9 |
(0.6, 1.2) |
-1.8 |
(-4.3, 0.8) |
|
Guanajuato |
2.1 |
(1.7, 2.4) |
0.1 |
(-1.9, 2.1) |
1.6 |
(1.3, 2) |
0.2 |
(-1.5, 1.9) |
|
Jalisco |
2.1 |
(1.7, 2.4) |
0.1 |
(-0.9, 1.2) |
1.6 |
(1.3, 1.9) |
-0.4 |
(-1.5, 0.8) |
|
Nayarit |
1.6 |
(0.9, 2.4) |
0.1 |
(-2.7, 3.1) |
1.7 |
(0.9, 2.5) |
6.1 |
(-8.1, 22.4) |
|
Nuevo León |
1.9 |
(1.5, 2.3) |
-0.1 |
(-1.6, 1.5) |
1.4 |
(1, 1.7) |
-0.9 |
(-2.9, 1.1) |
|
Durango |
0.9 |
(0.5, 1.4) |
-0.5 |
(-4.7, 3.8) |
0.9 |
(0.5, 1.4) |
0.1 |
(-9.6, 10.9) |
|
Baja California |
2.3 |
(1.8, 2.8) |
-0.7 |
(-2.8, 1.4) |
1.1 |
(0.7, 1.5) |
-3 |
(-6.1, 0.3) |
|
Tamaulipas |
1.6 |
(1.1, 2) |
-0.7 |
(-2.3, 0.9) |
1.4 |
(0.9, 1.8) |
-0.3 |
(-3.1, 2.5) |
|
Coahuila |
2.2 |
(1.7, 2.8) |
-0.8 |
(-2.9, 1.4) |
1.1 |
(0.7, 1.5) |
-0.1 |
(-3.4, 3.4) |
|
Sinaloa |
1.3 |
(0.8, 1.7) |
-2 |
(-4.2, 0.2) |
0.8 |
(0.5, 1.2) |
-2.1 |
(-4.7, 0.6) |
|
Querétaro |
1.8 |
(1.2, 2.4) |
-2.2 |
(-4.6, 0.2) |
1.3 |
(0.8, 1.8) |
-3.1§ |
(-5.9, -0.3) |
|
Zacatecas |
1.4 |
(0.8, 2) |
-2.8 |
(-6, 0.4) |
1.4 |
(0.8, 1.9) |
-1.7 |
(-5, 1.8) |
|
Tlaxcala |
1.7 |
(1, 2.4) |
-2.9 |
(-6.9, 1.2) |
1.1 |
(0.5, 1.6) |
-5.3§ |
(-9.4, -1.1) |
|
Yucatán |
2.2 |
(1.5, 2.8) |
-4.5 |
(-9.1, 0.3) |
2.3 |
(1.6, 3) |
2.9§ |
(0.3, 5.6) |
|
Baja California Sur |
1.5 |
(0.6, 2.4) |
-8.8 |
(-20.8, 5) |
1.6 |
(0.6, 2.5) |
7.4 |
(-10.9, 29.6) |
|
Morelos |
1.9 |
(1.2, 2.5) |
-12.5 |
(-23.9, 0.7) |
1.6 |
(1, 2.2) |
1.2 |
(-2.6, 5.1) |
|
Hidalgo |
2.9 |
(2.2, 3.5) |
-13.9 |
(-38.5, 20.7) |
1.9 |
(1.4, 2.4) |
1.4 |
(-0.6, 3.5) |
|
Guerrero |
1.7 |
(1.3, 2.2) |
-17.8 |
(-41.5, 15.4) |
1.5 |
(1.1, 1.9) |
3.1§ |
(1.2, 4.9) |
Five-year (2014-2018) age-standardized mortality rates (ASMR, WHO Standard Population, 2000-2025) for acute lymphoblastic leukemia among children younger than 19 years, in Mexico.
* Acute lymphoblastic leukemia age-standardized mortality rates, per 100 000 person-years
‡Average annual percent change for age-standardized mortality rates
§Significantly different from 0 at alpha < 0.05
Discussion
The present analysis showed that over a twenty-year period there was an increase in the mortality rates from ALL in the population under 19 years of age. This increase was accompanied by a reduction in the proportion of deaths and in the general mortality rates of the same age group. This situation is similar to that of other low- and middle-income countries and responds to the demographic and epidemiological transition, essentially caused by reductions in fertility rates, improvements in health services, and reduction in infant mortality.10,11
When we compared two periods (1998-2002 and 2014-2018), we observe a constant annual increase in mortality rates in children <19 years who did not have social security, and a decrease in those with social security. The same trend was observed when we stratified by age group, except for children under 1 year of age (high risk) in whom an increase was observed in those without social security, this could be due to the implementation of the Seguro Popular, which began to cover the treatment of those children without social security.3
We observed lower ASMR among children without social security, probably because before 2005, fewer children were diagnosed and after Seguro Popular implementation, diagnosis increased and so as reported deaths.
In some states (Baja California Sur, Baja California, Coahuila, Durango, Zacatecas, Querétaro, Hidalgo, Sonora, Nuevo León, Tamaulipas, Tlaxcala) we observed a significant decrease in mortality rates in the two studied periods; while in Aguascalientes, Campeche, Colima, Chiapas, Chihuahua, Guanajuato, Jalisco, Puebla, Tabasco, Morelos, Guerrero there is an increase. Yucatán showed an increase in the first period and a decrease in the second period. The heterogeneity in the percentages of change in state mortality rates reflects the differences in access to health services.11
It is worth mentioning that this type of study, in which we describe mortality trends, has the difficulty of establishing associations -in this case the decrease or increase in mortality rates- and the causes or specific control measures, for example, and we are limited to mentioning possible explanations. We do not have information on the incidence of ALL, which suggests of specific hypotheses even more complex.12,13 Some states as Guerrero, Hidalgo, Sonora where mortality have a significant variation between male and female reflects that there are some factors that need to be analyzed deeply for a better understanding. We can speculate that male population, in which ALL is more common in the adolescent period, have a poorest outcome as all the adolescents with cancer in the world.14
Seguro Popular funds increased from 2008 to 2011 from 36 millions dollars and then decreased to 13.6 in 2018.4,15 The distribution of health professionals and the infrastructure in pediatric oncology is uneven between hospitals and between regions. The institutions share barriers and lack monitoring, which prevents them from having uniform standards of high-quality care. It is necessary to have continuous and homogeneous investment strategies to reduce mortality.
ALL is a complex disease that in 2020 is a parameter of quality of treatment in pediatric cancer as well as the capacity of collaboration.10 Challenge begins in the effort of countries to stablish early detection campaigns to avoid oncologic emergencies in children and adolescents at diagnosis. After the patient arrives to the right hospital, the issue is to provide the patient a precise immunological and molecular diagnosis to make and adequate classification of the risk of the disease and stablish a personalized plan of treatment based on international systematic protocols. Access to minimal residual disease is today a need for an optimal follow up during treatment.16
Finally, the team which takes care of the patient must be coordinated between oncologists, hematologists, and infectious disease specialists. In parallel, nutrition, psychological and social support are indispensable to reach success. All these steps must be coordinated to obtain the excellent results published internationally. Early death defined as the death in the first phase of treatment is an excellent parameter to evaluate the pre-diagnosis phase, the diagnosis phase, and the quality of attention of oncological emergencies and complications.17
Detailed information on childhood ALL mortality in the different states of Mexico results in the reflect of the social, economic, geographic diversity of the country. Analyzing the outcome of this specific disease which have become a thermometer of the quality of attention of pediatric cancer in the world shows us that Seguro Popular implementation may not had the expected impact on survival.18 The main limitation is the fact that the analysis cannot consider the age of patients, the risk of the leukemia or the presence of a relapse among others.
A registry which considers a minimum of variables to make an analysis is necessary as well as a performance tool would allow the creation a structured pediatric cancer plan. Stakeholders would be able to integrate all the parameters that impact on the success or failure in the serie of situations that a patient lives from the diagnosis to the outcome and aspire to have a national homogeneity in the attention of these diseases.19

