


 nueva página del texto (beta)
 Inglés (pdf)
 Artículo en XML
 Referencias del artículo
 Enviar artículo por email
 Citado por SciELO
  Similares en
SciELO
Similares en
SciELO 
 Permalink
Introduction
Despite the availability of effective screening strategies, colorectal cancer (CRC) remains the second-leading cause of cancer mortality worldwide.1 In 2018, CRC caused 880 000 deaths worldwide with most of these deaths occurring in lower- and middle-income countries (LMICs) without effective screening programs in place.2,3 In 2018, CRC was Mexico’s second most common cause of cancer mortality in both sexes.4 Reflecting the heterogeneity of Mexico’s population, there are dramatic regional differences in cancer burden, with mortality rates are rapidly increasing,5 especially in urban areas,6 whereas rising adult mortality rates defy traditional epidemiological transition models in which decreased death rates occur across all ages. These trends suggest Mexico is experiencing a more complex, dissonant health transition than historically observed. Enduring inequalities between states further emphasise the need for more detailed health assessments over time. Since there are currently no organized screening programs in Mexico, CRC is often diagnosed at advanced stages.7
Healthcare services in Mexico are divided into several institutions that serve unique populations and are stratified by employment status. Individuals who are employed in the formal labor market are affiliated in the Instituto Mexicano del Seguro Social (IMSS). Individuals who are employed by government institutions are insured by the Instituto de Seguridad y Servicios Sociales de los Trabajadores del Estado (ISSSTE). Individuals employed by the Mexico Armed Forces are insured by the Army’s own health service. For individuals who are either unemployed or who work as day laborers without formal employment, the government offers universal health services through the Ministry of Health. Universal coverage was previously provided under Seguro Popular (2003-2020), which was recently replaced by the Instituto de Salud para el Bienestar (INSABI) in 2020. According to the Instituto Nacional de Estadística y Geografía (INEGI) 2015 survey, 82% of Mexico’s population has some type of reported affiliation. Of these, 49.9% were affiliated with Seguro Popular, 39.2% with IMSS, 7.7% with ISSSTE, 3.3% with private institutions that self-insure, and 2.7% with Army health services and other institutions.8 Since cancer screening programs and treatment coverage vary across the different insurance systems, understanding mortality trends by health insurance affiliation is critical for the design of effective public health screening and intervention programs.
While previous analyses5,9,10,11 have examined time trends, data on the burden of colorectal cancer according to state and healthcare insurance status in the Mexican population is scarce. In effort to understand the at-risk populations who are most likely to benefit from CRC screening interventions, we aimed to describe the burden of CRC in Mexico, according to state of residence and insurance status, and changes over time.
Materials and methods
Data sources
Mortality data
Deaths from 1998 to 2018 by cause, age, sex, state of residence, health insurance, and year were retrieved from national mortality databases from the INEGI registries. This de-identified publicly available data is based on death certificates, with cause of death codified using the International Statistical Classification of Diseases and Related Health Problems, Tenth Revision (ICD-10). We included colon (codes C18.0, C18.2-18.9) and rectal cancer (codes C19 and C20) and excluded malignant neoplasm of appendix (code C18.1) ICD-10 codes. There were 84 808 deaths identified with these codes. Records with missing sex (n=3), age (n=48), state of residence (n=65) were excluded from our study. International citizens residing in Mexico (n=290) were also excluded.
Population data
Population estimates by age, sex, state of residence, and year were obtained from the Consejo Nacional de Población (Conapo).12 Using census data from INEGI (2000 and 2010), intercensal survey (2015), and Encuesta Nacional de Salud y Nutrición (Ensanut) (2006 and 2012), population proportions by health insurance affiliation were estimated using adjusted ordinary least squares models.13,14,15,16
National and state-level percentages of total population living in urban areas was obtained from INEGI’s 2014 Encuesta Nacional de la Dinámica Demográfica (Enadid).17 This percentage was the quotient of the total estimated resident population in areas with 2 500 and more residents among the total national or state-level resident population.
National and state-level Global Burden of Disease 2016 Healthcare Access and Quality Index (HAQ) scores for CRC were obtained. HAQ is provided as a 0-100 score, with higher scores representing greater access. This index is constructed using age-standardized risk-standardized death rates by cause, along with existing indicators of health-care access such as hospital beds per 1 000, physicians and nurses per 1 000, proportion of population with formal health coverage, among others.18,19
Statistical analysis
Health insurance affiliation
We classified health insurance affiliation according to membership in one of five groups: (1) IMSS; (2) ISSSTE (federal); (3) those without health insurance, including those with Seguro Popular, IMSS Prospera, or no health insurance; (4) those with other minor and private insurance; or (5) undocumented. Records with more than one reported affiliation (n=23) were excluded from these specific analyses since we could not confirm the institution in which they received care. Records registered with other minor and private providers were not included in analyses by health insurance (n=4 572). Records with undocumented affiliation (n=5 933) were excluded from the main analysis by health insurance. We performed a sensitivity analysis where we reclassified these deaths as occurring in the population without health insurance.
Death rates and standardization
National mortality rates from 1998 to 2018 were calculated by sex and year using Conapo population estimates, and by health insurance using our estimated populations as denominators. National and state-level five-year average (2014-2018) mortality rates by sex were calculated (expressed per 100 000 person-years) using Conapo population estimates. Age-Standardized Mortality Rates (ASMR) and their respective 95% confidence intervals were calculated through direct method using the World Standard Population.20 Analyses were performed with Stata (Release 14. College Station, TX:StataCorp LP).
Time trends
To analyze mortality trends by sex, health insurance and state of residence, we estimated temporal trends using joinpoint regression analysis (Joinpoint Statistical Software version 4.4.0), with a maximum of three joinpoints allowed in each model. Each temporal trend identified in the 1998 to 2018 period was described by the annual percent change (APC). To determine the direction and magnitude of the recent trends, the average annual percent change (AAPC) and respective 95% confidence interval was evaluated for the full range (1998-2018) and for the last five years (2014-2018) using the underlying joinpoint model for the 1998-2018 period. Statistically significant APC and AAPCs are documented with an asterisk (*).
Results
National mortality trends (1998-2018)
Between 1998 and 2018, 84 808 CRC deaths were registered in Mexico. 48.2% of the 84 402 records included in our analysis were females. Mean age at death in men was 64.5 years (±15.3), and 66.0 (±15.8) in females. In the overall population, ASMR increased from 3.4 per 100 000 in 1998 to 4.6 in 2018. In men, ASMR increased from 3.6 in 1998 to 5.5 per 100 000 in 2018; while in females this increase was from 3.2 to 4 (table I). In the first 10 years of the study period, mortality among females increased (1998-2007 APC: 1.4*), while in 2010-2015 a greater percent increase was observed, compared to males in the same period (APC: 4.8*). Other years in the period showed a non-significant decrease. Consistent increase in male mortality was observed in the complete period, increasing 2.7% annually (1998-2018 AAPC: 2.7*) (figure 1).
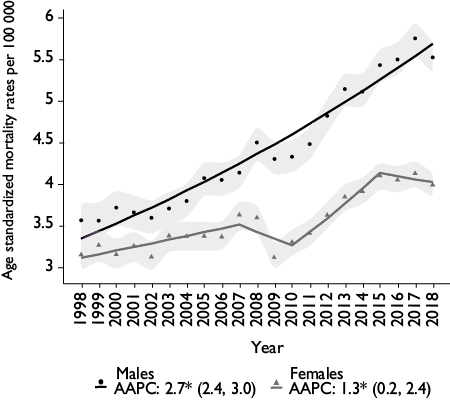
Dots and triangles represent age-standardized mortality rates per 100 000 (World Standard Population, Segi). Solid lines represent best fit modeled trends. Shadowed area represents confidence intervals. Average Annual Percent Change (AAPC) (95% confidence interval) summarizes trends for the complete period 1998-2018.
* Significantly different from 0 at alpha < 0.05
Figure 1 Colorectal cancer mortality trends by sex. Mexico, 1998-2018
For the complete 21-year period, females mortality rates increased by 1.3%* annually, while mortality rates among males increased by 2.7%* annually (AAPC 1998-2018). Although a decrease (-0.9% annually) in mortality rates was observed among females from 2015 to 2018 (APC), AAPC in the last five years (2014-2018) was 0.5%. None of these latter trends were statistically significant (table I).
Table I Colorectal cancer mortality rates. Mexico, 1998, 2008, 2018
|
Sex |
Year |
Cases |
Crude rate |
ASMR (95%CI)* |
AAPC 2014-2018 (95%CI)‡ |
AAPC 1998-2018 (95%CI)‡ |
|
Males |
1998 |
1 145 |
2.4 |
3.6 (3.4-3.8) |
2.7§ (2.4-3.0) |
2.7§ (2.4-3.0) |
|
2008 |
2 033 |
3.8 |
4.5 (4.3-4.7) |
|||
|
2018 |
3 383 |
5.5 |
5.5 (5.3-5.7) |
|||
|
Females |
1998 |
1 180 |
2.4 |
3.2 (3-3.3) |
0.5 (-1.3-2.3) |
1.3§ (0.2-2.4) |
|
2008 |
1 909 |
3.4 |
3.6 (3.4-3.8) |
|||
|
2018 |
2 920 |
4.6 |
4 (3.8-4.1) |
* Age standardized mortality rate (ASMR) per 100 000 (World Standard Population, Segi).
‡ AAPC: Average annual percent change for ASMR
§ Significantly different from 0 at alpha < 0.05
Health insurance mortality trends (1998-2018)
In the complete period, 45.5% of deaths registered had an IMSS affiliation (n=38 428), 10.4% ISSSTE (n=8 734), 31.7% did not have health insurance (n=26 712), 5.4% had other minor or private insurance (n=4 572), and 7% had undocumented health insurance affiliation information (n=5 933). National mortality trends showed that the highest mortality rates were in males affiliated with ISSSTE (ASMR 2018: 7.9 per 100 000) and IMSS (ASMR 2018: 7.6 per 100 000) (figure 2). Lowest mortality rates were found in males and females without health insurance (ASMR 2018: 3.1 and 2.5 and per 100 000, respectively). Males showed a 2.3 to 2.6% increase and women a 1.2 to 1.6% increase in mortality rates across different health insurance status (AAPC 1998-2018). In males, highest annual increase was found in population affiliated with IMSS (2.6%*), while in females in population affiliated with ISSSTE (1.6%) (AAPC 1998-2018).
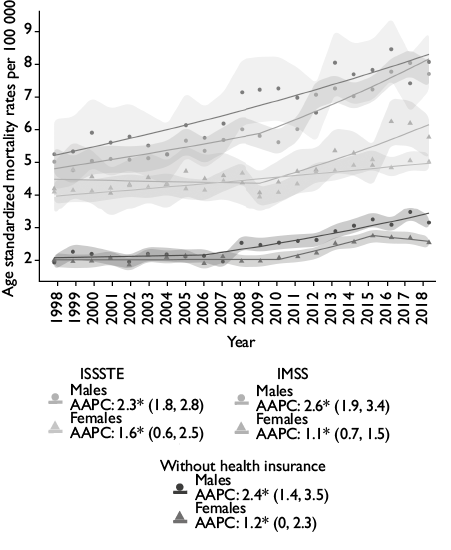
Dots and triangles represent age-standardized mortality rates per 100 000 (World Standard Popultaion, Segi)
Solid lines represent best fit modeled trends. Shadowed area represents confidence intervals
AAPC: Average Annual Percent Change (95% confidence interval) for 1998-2018 period
Without health insurance: population with Seguro Popular, IMSS Prospera, or no health insurance. ISSSTE: population affiliated with Instituto de Seguridad y Servicios Sociales de los Trabajadores del Estado; IMSS: population affiliated with Instituto Mexicano del Seguro Social
CRC: colorectal cancer
* Significantly different from 0 at alpha <0.05
Figure 2 Age standardized national CRC mortality rates, trends and AAPCs by health insurance and sex. México
In a sensitivity analysis, we classified records missing insurance information (n=5 933) as uninsured and detected an increase in the 1998-2018 AAPC in males, changing from 2.4%* to 3.1%*. In females, AAPC changed from 1.2%* to 2.0, but was non-significant. Although mortality rates increased in males (3.1 vs 4.0 per 100 000 in 2018) and females (2.5 vs 3.1 per 100 000 in 2018), they remained lower compared to other health insurances.
State-level mortality trends (2014-2018)
In the last five years studied (2014-2018), there were 29 734 CRC deaths registered. States that registered the highest number were State of Mexico (n=3 539), followed by Mexico City (n=3 293) and Jalisco (n=2 401), while states with the lowest number of deaths were Campeche, Colima, and Quintana Roo (table II).17 Although Baja California Sur had the highest ASMR, it was the 5th state with the lowest number of cases registered in the period (n=240) (table II).
Table II Five-year average age-standardized CRC mortality rates and average annual percent change, by state and sex. Mexico, 2014-2018
|
Location |
Male |
Female |
Population in urban area (%)§ |
HAQ Index GBD 2016# |
||||||||||
|
Cases |
Crude Rate |
ASMR* |
ASMR* 95%CI |
AAPC‡ |
AAPC‡ 95%CI |
Cases |
Crude Rate |
ASMR* |
ASMR* 95%CI |
AAPC‡ |
AAPC‡ 95%CI |
|||
|
Mexico City |
1 705 |
7.9 |
6.4 |
(6.1-6.7) |
1.3& |
(0.8-1.9) |
1 588 |
6.7 |
4.5 |
(4.2-4.7) |
0.4 |
(0-0.8) |
99.5 |
96.2 |
|
Nuevo León |
997 |
7.5 |
8.1 |
(7.6-8.6) |
3& |
(1.9-4.1) |
689 |
5.2 |
4.8 |
(4.5-5.2) |
1.5& |
(0.6-2.5) |
94.7 |
85.4 |
|
Baja California |
635 |
7.4 |
8.9 |
(8.2-9.6) |
2.4& |
(1.5-3.3) |
468 |
5.5 |
5.8 |
(5.2-6.3) |
1.1 |
(0-2.2) |
92.3 |
82 |
|
Coahuila |
519 |
6.8 |
7.5 |
(6.8-8.1) |
3& |
(1.8-4.2) |
343 |
4.5 |
4.4 |
(3.9-4.9) |
0.8 |
(-0.5-2.2) |
90 |
82.1 |
|
Colima |
121 |
6.6 |
6.8 |
(5.6-8.1) |
4.5& |
(2.4-6.7) |
61 |
3.3 |
3.2 |
(2.4-4) |
-0.4 |
(-3.2-2.3) |
88.8 |
75.8 |
|
Quintana Roo |
107 |
2.7 |
3.7 |
(3-4.4) |
2.4 |
(-0.2-5) |
75 |
1.9 |
2.6 |
(2-3.2) |
0.2 |
(-2.5-2.9) |
88.2 |
77.3 |
|
Tamaulipas |
524 |
6 |
6.1 |
(5.6-6.7) |
3.2& |
(2-4.3) |
441 |
5 |
4.5 |
(4.1-4.9) |
1.7& |
(0.5-2.9) |
87.8 |
81.6 |
|
State of Mexico |
1 834 |
4.5 |
5.0 |
(4.7-5.2) |
2.7& |
(2.1-3.2) |
1 705 |
4 |
3.9 |
(3.7-4) |
1.1& |
(0.5-1.8) |
87 |
77.9 |
|
Jalisco |
1 308 |
6.6 |
7.1 |
(6.7-7.5) |
3.8& |
(3.2-4.4) |
1 093 |
5.4 |
5.0 |
(4.7-5.3) |
1.8& |
(1.2-2.4) |
86.6 |
74.7 |
|
Baja California Sur |
145 |
7.7 |
9.4 |
(7.8-10.9) |
3.3& |
(1.2-5.5) |
95 |
5.3 |
5.5 |
(4.4-6.7) |
-0.9 |
(-2.5-0.7) |
86.1 |
76.1 |
|
Sonora |
532 |
7.3 |
7.5 |
(6.9-8.2) |
3.1& |
(2.1-4.1) |
400 |
5.4 |
5.1 |
(4.6-5.7) |
1.2& |
(0-2.4) |
86 |
82.2 |
|
Chihuahua |
716 |
7.9 |
8.5 |
(7.8-9.1) |
3.2& |
(2.2-4.1) |
518 |
5.6 |
5.5 |
(5-5.9) |
2.5& |
(1.3-3.7) |
84.8 |
80.6 |
|
Yucatán |
172 |
3.2 |
3.2 |
(2.7-3.7) |
0.9 |
(-0.9-2.7) |
133 |
2.4 |
2.2 |
(1.8-2.6) |
-0.9 |
(-2.6-0.9) |
84 |
69 |
|
Morelos |
259 |
5.5 |
5.2 |
(4.6-5.8) |
2.3& |
(1.2-3.3) |
272 |
5.4 |
4.5 |
(4-5.1) |
2.9& |
(1.6-4.2) |
83.9 |
74.6 |
|
Aguascalientes |
146 |
4.4 |
5.3 |
(4.5-6.2) |
3.7& |
(1.9-5.4) |
132 |
3.8 |
4.2 |
(3.4-4.9) |
1.7 |
(-0.1-3.4) |
80.8 |
77.7 |
|
Tlaxcala |
126 |
3.9 |
4.4 |
(3.6-5.2) |
1.5 |
(-1.4-4.4) |
107 |
3.2 |
3.1 |
(2.5-3.7) |
0.8 |
(-1.4-3.1) |
79.9 |
70.7 |
|
National |
15 848 |
5.3 |
5.5 |
(5.4-5.6) |
2.7& |
(2.4-3) |
13 886 |
4.4 |
4.0 |
(4-4.1) |
0.5 |
(-1.3-2.3) |
76.8 |
76.1 |
|
Campeche |
78 |
3.4 |
3.6 |
(2.8-4.4) |
1.5 |
(-1.1-4.1) |
93 |
3.9 |
3.9 |
(3.1-4.7) |
2.6 |
(-0.5-5.8) |
74.6 |
71.4 |
|
Sinaloa |
366 |
4.8 |
4.7 |
(4.2-5.2) |
3.2& |
(1.9-4.6) |
343 |
4.5 |
3.9 |
(3.5-4.4) |
1.9& |
(0.3-3.5) |
72.8 |
75.7 |
|
Puebla |
606 |
4 |
4.4 |
(4-4.7) |
2.7& |
(1.6-3.8) |
625 |
3.8 |
3.5 |
(3.3-3.8) |
5.1& |
(2.9-7.2) |
71.8 |
65 |
|
Queretaro |
213 |
4.1 |
4.9 |
(4.2-5.6) |
3.6& |
(1.8-5.4) |
214 |
4 |
4.2 |
(3.6-4.7) |
4.1& |
(2.7-5.5) |
70.4 |
75.3 |
|
Guanajuato |
609 |
4.2 |
4.7 |
(4.3-5) |
2.9& |
(1.9-3.9) |
564 |
3.7 |
3.6 |
(3.3-3.9) |
2.3& |
(1.2-3.4) |
69.9 |
68.4 |
|
Nayarit |
167 |
5.5 |
5.4 |
(4.6-6.2) |
2.6& |
(0.5-4.7) |
147 |
4.8 |
4.5 |
(3.7-5.2) |
1.6 |
(-0.5-3.7) |
68.9 |
69.4 |
|
Durango |
217 |
4.9 |
5.3 |
(4.5-6) |
1.9& |
(0.5-3.3) |
171 |
3.8 |
3.6 |
(3-4.1) |
1.6 |
(-0.4-3.6) |
68.9 |
66.2 |
|
Michoacán |
716 |
6.3 |
6.2 |
(5.7-6.7) |
3.7& |
(2.9-4.6) |
562 |
4.7 |
4.1 |
(3.7-4.4) |
2.5& |
(1.4-3.6) |
68.7 |
62.5 |
|
San Luis Potosí |
315 |
4.6 |
4.4 |
(3.9-4.8) |
3.1& |
(2.1-4.2) |
265 |
3.7 |
3.3 |
(2.9-3.7) |
0.7 |
(-0.9-2.4) |
63.8 |
72.7 |
|
Veracruz |
996 |
4.9 |
4.5 |
(4.3-4.8) |
-4.4 |
(-13.6-5.7) |
1 030 |
4.8 |
3.8 |
(3.6-4.1) |
1.5& |
(0.8-2.2) |
61.1 |
64.7 |
|
Zacatecas |
218 |
5.5 |
5.3 |
(4.5-6) |
3.3& |
(1.8-4.8) |
177 |
4.3 |
3.9 |
(3.3-4.5) |
2.2& |
(0.6-3.8) |
59.5 |
64.3 |
|
Guerrero |
291 |
3.3 |
3.5 |
(3.1-3.9) |
3.1& |
(2.1-4.1) |
264 |
2.8 |
2.6 |
(2.2-2.9) |
2.3& |
(0.7-3.9) |
58.2 |
53.2 |
|
Tabasco |
204 |
3.4 |
3.7 |
(3.2-4.2) |
1.6& |
(0.1-3.1) |
231 |
3.7 |
3.9 |
(3.3-4.4) |
0.6 |
(-1.2-2.3) |
57.4 |
67.6 |
|
Hidalgo |
311 |
4.4 |
4.3 |
(3.9-4.8) |
2.7& |
(1.7-3.7) |
295 |
3.9 |
3.5 |
(3.1-3.9) |
1.7& |
(0.1-3.4) |
52.2 |
61.8 |
|
Chiapas |
381 |
2.9 |
3.6 |
(3.2-3.9) |
1.9& |
(1-2.8) |
424 |
3.1 |
3.7 |
(3.3-4) |
1.4& |
(0.1-2.6) |
48.7 |
50.8 |
|
Oaxaca |
314 |
3.2 |
3.1 |
(2.7-3.4) |
1.4& |
(0.3-2.5) |
361 |
3.4 |
2.9 |
(2.6-3.2) |
1.5& |
(0-3) |
47.3 |
53.7 |
CRC: colorectal cancer
Five-year (2014-2018) crude and age-standardized mortality rates (ASMR, World Standard Population, Segi) ranked by proportion of population living in urban area.
* Colorectal cancer age-standardized mortality rates, per 100 000 person-years. Color by magnitude of ASMR, which ranges from dark blue, for the lowest rate, to dark red, for the highest, and with gradients for the intermediate values (color representation of magnitudes changed to grey for the printed version).
‡ Average annual percent change (AAPC) for ASMR
§ Percentage of total population in urban area, Encuesta Nacional de la Dinámica Demográfica, Instituto Nacional de Estadística y Geografía, 201417
# Healthcare Access and Quality Index (Global Burden of Disease, 2016)
& Significantly different from 0 at alpha < 0.05
Across states, males had higher mortality rates compared to females in the same period. Exceptions for this were Chiapas, Tabasco, and Campeche (table II). National ASMR mortality rate in males was 5.5 per 100 000 person-years, and 4.0 per 100 000 person-years in females. Highest crude mortality rates were found in males in Mexico City (7.9 per 100 000 person-years), Chihuahua (7.9), Baja California Sur (7.7), and Nuevo León (7.5). Lowest crude rates were found in females in Yucatán and Guerrero, and males and females in Quintana Roo. Highest ASMRs were observed in males in Baja California Sur (9.4 per 100 000 person-years), Baja California (8.9), Chihuahua (8.5) and Nuevo León (8.1).
Highest statistically significant AAPCs in males in this 5-year period were observed in Colima (4.5%, 95%CI:2.4-6.7), Jalisco (3.8%, 95%CI: 3.2-4.4) and Michoacán (3.7%, 95%CI: 2.9-4.6). In females, highest AAPCs were observed in Puebla (5.1%, 95%CI: 2.9, 7.2), Querétaro (4.1%, 95%CI: 2.7, 5.5) and Morelos (2.9%, 95%CI: 1.6, 4.2). None of the decreasing AAPCs was statistically significant.
States with the highest proportion of population living in urban areas had the highest CRC mortality rates. In men, of the 10 states with the highest proportion of population living in urban areas, seven were ranked as one of the 10 states with highest CRC mortality rates. In females, 6 of the 10 states with highest mortality were also states with a higher proportion of the population in urban areas.
When ranked by Global Burden of Disease 2016 Healthcare Access and Quality Index (HAQ) scores, we observed that states with higher HAQ scores had higher ASMR’s for CRC. In males and females, of the 10 states with the highest HAQ, 6 were ranked as one of the 10 states with highest CRC mortality rates (table II).
Geographical distribution of mortality rates is shown in figure 3. Highest mortality rates were observed in males in the northern region of Mexico, especially in Baja California peninsula. West Mexico and Mexico City areas also showed high mortality rates. In females, higher rates were observed mainly in the northwestern region.
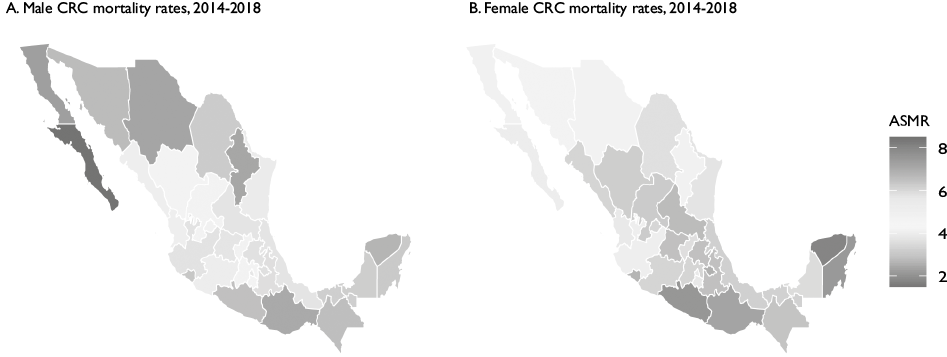
CRC: Colorectal cancer
ASMR: Age-Standardized Mortality Rates
Five-year (2014-2018) crude and age-standardized colorectal cancer mortality rates per 100 000 person-years (ASMR, World Standard Population, Segi), color by magnitude of ASMR which ranges from dark blue, for the lowest rate, to dark orange, for the highest, and with median values at lightest hues. Panel A. Male mortality, Panel B Female mortality.
Figure 3 Geographical distribution of subnational age-standardized average annual mortality rate by sex. Mexico, 2014-2018
Discussion
Our analysis of CRC mortality trends in the last 21 years (1998-2018) in Mexico revealed several noteworthy findings. First, we found a significant increase in overall CRC mortality, especially in males, over two decades. Second, we observed a higher ASMRs and percentage increase among males and females with health insurance. Third, the highest mortality rates for both males and females were observed in states with higher proportion of population living in urban areas, despite having better access to healthcare (HAQ scores). And fourth, we found a pattern of higher mortality rates in the northern region of Mexico.
Rising CRC mortality rates have been reported in several middle-income countries in Latin America, including Brazil, Argentina, and Ecuador.21,22 Meanwhile, high income countries in North America and Europe have successfully decreased CRC incidence and mortality through the implementation of effective screening programs and early treatment, despite having historically some of the highest mortality rates.21,22,23 For unclear reasons, higher mortality in males has been documented worldwide. Studies suggest that hormonal, lifestyle factors (diet, physical activity) and socioeconomic characteristics (occupation, environment) play a role in these sex differences. Other potential factors reported include insurance status and differential use of medical services, preventive behaviors, and adherence to follow up and treatment.24 Even though females are more likely to present right-sided tumors,24 better survival outcomes with conventional chemotherapy,25 and better prognosis due to higher presence of microsatellite instability phenotype have been reported.26
Our findings were contrary to our hypothesis that patients without insurance would have higher mortality rates. Findings of increased mortality amongst the under-insured in other settings have been attributed to increased risk of presentation with advanced disease due to lack of access to preventive healthcare27 and a lower likelihood of receiving oncologic treatment following diagnosis.28,29 Although uninsured individuals may have a different distribution of lifestyle factors, we hypothesize we observed lower mortality rates since insured populations could be more likely to access diagnostic services, while the uninsured population may never be diagnosed at the time of death. This could also be a potential explanation for the differences between urban areas, where most of the Mexican population has health insurance (>50%), compared to rural areas where this proportion is low (<20%).30 Furthermore, if urban areas have a higher burden of CRC, cases are more likely to have some type of health insurance. Finally, patients without social security with a CRC diagnosis may seek care by enrolling in a social security institution with guaranteed treatment for this cancer site.
Higher rates of CRC have been reported in urban areas and sites with rapid development and industrialization.23,31,32 Different mechanisms have been hypothesized to cause this association, such as westernization of dietary patterns, modifications of dietary intake, and environmental factors.23,33 Our results are consistent with this evidence, finding higher mortality rates in states with greater proportion of population living in urban areas, and a geographic distribution consistent with dietary patterns. Namely, diet in the northern region of Mexico is characterized by low consumption of whole fruits, whole grains and vegetables and high consumption of meat and animal products, while highest quality diet is found in the southern region.34
A strength of our study is the high quality of death registration in Mexico (timeliness, completeness and population coverage)35 and high agreement of medical records with death certificates in cases of neoplasia.36 Our age-standardized national mortality rates were consistent with previous published results,23 along with the high proportion of cancer related deaths with IMSS affiliation.11 One limitation of our analysis is the potential for differential underdiagnosis, since population with no health insurance may be less likely to seek health services and cancer may be under-reported as a the cause of death in this population.37 Other limitations include the lack of available national cancer incidence data and impossibility to determine changes in insurance status due to cancer diagnosis. Finally, validating our health insurance specific rates with previously published institution’s rates was not possible, since previous estimations used total affiliates as denominators, which may include duplicates.38 Despite our study strengths, our findings may underestimate actual mortality rates for individuals with limited access to diagnostic services, which underscores the potential benefits of increased investment in comprehensive screening, diagnosis, and treatment strategies for the general population.
Given the increasing burden of CRC, effective Fecal Occult Blood Test-based screening, efficient referral between primary care and diagnostic and treatment facilities, and guaranteed access to treatment are essential components for controlling the burden of disease. Efforts should be made for a structured approach to the development and deployment of CRC screening programs and early diagnosis and referral. Early detection of CRC has successfully decreased incidence and mortality in several countries.21,23
To properly inform these policies, we urgently need research to understand: (1) incidence and mortality in groups that may not have access to health insurance, (2) differences in CRC incidence and mortality by age groups, and (3) state-specific mortality trends and association with known risk factors. This evidence will further contribute to the development of equitable strategies for screening and early detection of CRC for populations throughout Mexico.

