


 nueva página del texto (beta)
 Inglés (pdf)
 Artículo en XML
 Referencias del artículo
 Enviar artículo por email
 Citado por SciELO
  Similares en
SciELO
Similares en
SciELO 
 Permalink
Introduction
Zinc is an essential trace element present in several enzymes, which acts as an antioxidant and is a crucial component of diverse regulatory proteins involved in DNA transcription and innate immunity. Zinc is regulated by homeostatic responses and has no bodily reserves.1 Deprivation of zinc at early ages is associated with growth retardation, altered immune function which decreases resistance to infection,2 metabolic3 and neurological disorders,4 and more. Mild to moderate zinc deficiency (ZD) is frequent, affecting one third of the global population, mostly pregnant women and children.5
The 1999 Mexican National Nutrition Survey (ENN 1999) first documented ZD magnitude in Mexican women and children.6 Data from both the ENN 1999 and the subsequent 2006 Mexican National Health and Nutrition Survey (Ensanut 2006)7 highlighted ZD as a public health problem. Afterwards, no representative data on zinc status in Mexico were reported at national level. In order to address undernutrition issues, two social programs were implemented for low-income Mexican families which either provided fortified foods like milk (Liconsa) or baby food fortified with multiple micronutrients (Progresa). The effectiveness of both programs on child growth and anemia has been previously documented.8,9 The Mexican conditional cash transfer program called respectively Progresa (1997), Oportunidades (2002), and Prospera (2012) -herein referred to as “CCT-POP”- targeted the population at high risk of undernutrition. This program had a nutritional component which consisted in the distribution of baby food fortified with multiple micronutrients to children and a beverage for pregnant women containing a mixture of nutrients critical to optimal nutrition (iron, zinc, folic acid, and vitamins A, E, C, and B12).10 CCT-POP program coverage grew gradually, having started in 2007, and reaching approximately 6.6 million Mexican households (27 million people, or approximately 22.7% of the population) by 2017.11 This higher coverage may have exhibited challenges in promoting adequate supplement consumption among beneficiary families.10
Identification of the main factors associated with changes in the ZD trend in Mexico is of great relevance to public health. This study aims to document the trend in ZD prevalence in Mexican children from 1999 to 2018- 19, and to explore whether the program CTP-POP may have modified this trend.
Materials and methods
Design and sample. The data for the present analysis came from children aged 1-4 years who participated in one of three national probabilistic surveys with cross-sectional designs: the ENN 1999, the Ensanut 2006 and the Ensanut 2018-19. Blood samples were collected in 30% of total participants within each of the three surveys. These subsamples were representative at the national level, by geographic region and by dwelling type (urban or rural). The numbers of final samples sizes of children aged 1-4 analysed in the present study were 158 (ENN 1999), 1 435 (Ensanut 2006), and 1 004 (Ensanut 2018-19). Further details on the methodology of these surveys are documented elsewhere.6,7,12
Blood collection
Blood samples were collected by previous appointment in the home of the participants. Venous blood samples were taken from the antecubital vein directly into certified metal-free collection tubes and centrifuged in situ at 3 000 g. Serum samples were stored in cryovials and frozen in liquid nitrogen (-130°C) until delivery to the Biochemical Nutrition Laboratory of the National Institute of Public Health (Instituto Nacional de salud Pública, INSP) in Cuernavaca, Mexico, and stored in freezers at -70°C.
For the ENN 1999, serum zinc concentrations were analysed using atomic absorption spectrometry with a graphite furnace (Analyst 300, Perkin-Elmer, Norwalk, Ct, USA).13 For the Ensanut 2006, serum zinc was determined by inductively coupled plasma optical emission spectrometry (Varian Vista Pro CCD Simultaneous),14 and for Ensanut 2018-19 using atomic absorption flame spectrometry (GTA129 Agilent Technology, 200 AA Waldbroon, Germany). Results were calibrated against NIST SRM 3131a reference material. The coefficients of variation were 18.5% (1999), 13.5% (2006) and 29.3% (2018).
Definition of variables
A household wealth index (HWI) was constructed as a proxy of socioeconomic status, based on household characteristics and family assets through a principal component analysis; it was divided into tertiles indicating low, medium or high HWI.15 Indigenous ethnicity was defined as any indigenous language spoken at home (Ensanut 2018-19) or any indigenous language spoken by the household matriarch (ENN 1999 and Ensanut 2006). Geographic regions were categorized as North, Central and Mexico City, and South. Dwelling type was classified as rural for localities with <2 500 inhabitants; otherwise, they were classified as urban.
Children were classified as beneficiaries of the social programs Liconsa (low-cost milk fortified with iron, zinc and other critical micronutrients) or “CCT-POP” (Progresa in the ENN 1999, Oportunidades in the Ensanut 2006 or Prospera in the Ensanut 2018-19).
Anthropometric measures of weight (kg) and length (in children aged 1-2 y) or height (cm, in children aged 3-4 y) were obtained by trained personnel using standardized methods;16,17 the BMI (Z-score) was then calculated according to the criteria of the World Health Organization (WHO).18 Stunting was defined as length/ height-for-age Z-score <-2 SD. Overweight was defined as BMI Z-score >+1 SD.18
Zinc deficiency
Serum zinc cutoff values determining ZD were defined according to the criteria of the International Zinc Nutrition Consultative Group (IZiNCG).21 For Ensanut 20067 and Ensanut 2018-19, ZD was defined as serum zinc concentrations of <65 μg/dL for girls and <57 μg/dL for boys. Because the blood samples in the ENN 1999 were not obtained in fasting state,6 ZD was defined therein as serum zinc <65 μg/dl, as recommended by the IZiNCG.21
Statistical análisis
Descriptive characteristics of child participants are described as frequencies, percentages, and confidence intervals (95%CI), by year of survey.
A logistic regression model was used to identify characteristics associated with ZD, as adjusted by confounders: age, sex, geographical region, dwelling type, BMI, stunting and anemia. Statistical significance was set at alpha=0.05. The differential effect of CCT-POP over time was estimated based on the interaction term of “year of survey” and “CCT-POP beneficiary”, and significance was set at alpha=0.1 with a 95%CI. Statistical analyses were performed using the Stata SE v15 software.* All analyses considered the original multistage stratified sampling design of the surveys using the SVY module for complex samples.
Results
The descriptive characteristics of the child participants are shown in table I. Approximately 30% of children resided in rural areas in 1999 and 2018-19. In 2006, a higher proportion of children resided in rural areas, were within the lowest HWI tertile, and were CCT-POP beneficiaries, as previously documented.7 In 2018-19, as compared to 1999, a lower proportion of children were beneficiaries of any social program: only 6.3% received Liconsa, and 3.1%, CCT-POP (table I).
Table I: Descriptive characteristics of the subsample of children aged 1-4 y with serum zinc data, by year of survey. Mexico, ENN 1999, Ensanut 2006 and Ensanut 2018-19
|
ENN 1999 |
Ensanut 2006 |
Ensanut 2018-19 |
|||||||
|
n |
Expansion |
n |
Expansion |
n |
Expansion |
||||
|
N (thousands) |
Frequency % (95%CI) |
N (thousands) |
Frequency % (95%CI) |
N (thousands) |
Frequency % (95%CI) |
||||
|
Age group (years) |
|||||||||
|
1-2 |
30 |
791.6 |
20.2 (12.4-31.2) |
520 |
2 461.2 |
34.3 (31.0-37.9) |
426 |
2 343.2 |
40.6 (35.7-45.6) |
|
3-4 |
128 |
3 129.7 |
79.8 (68.8-87.6) |
915 |
4 703.9 |
65.7 (62.1-69.0) |
578 |
3 434.9 |
59.4 (54.4-64.3) |
|
Sex |
|||||||||
|
Female |
69 |
1 323.8 |
36.3 (26.3-47.7) |
674 |
3 419.4 |
47.7 (44.0-51.5) |
478 |
2 736.4 |
47.4 (42.2-52.6) |
|
BMI |
|||||||||
|
Overweight |
11 |
339.3 |
9.7 (4.5-19.6) |
117 |
467.7 |
6.9 (5.4-8.8) |
72 |
337.9 |
5.9 (4.3-8.2) |
|
Stunting |
|||||||||
|
Yes |
28 |
731.5 |
20.9 (13.4-31.1) |
203 |
1 378.6 |
20.5 (16.7-24.9) |
151 |
887.4 |
16.0 (12.2-20.7) |
|
Anemia |
|||||||||
|
Yes |
26 |
473.9 |
12.9 (7.3,21.8) |
297 |
1 529.3 |
21.6 (18.5-25.2) |
299 |
1 742.6 |
30.2 (26.0-34.7) |
|
Dwelling type |
|||||||||
|
Rural |
64 |
1 208.6 |
30.8 (22.4-40.8) |
776 |
3 477.7 |
48.5 (43.6-53.5) |
422 |
1 742.2 |
30.2 (26.1-34.5) |
|
Geographic region | |||||||||
|
North |
46 |
590.8 |
15.1 (9.9-22.3) |
224 |
973.5 |
13.6 (10.8-17.0) |
145 |
1 127.6 |
19.5 (16.4-23.1) |
|
Central and Mexico City |
57 |
1 656.1 |
42.2 (31.1-54.2) |
679 |
3 609.5 |
50.4 (44.5-56.3) |
352 |
2 705.1 |
46.8 (42.2-51.5) |
|
South |
55 |
1 674.4 |
42.7 (32.0-54.1) |
532 |
2 582.1 |
36 (30.7-41.7) |
507 |
1 945.3 |
33.7 (29.5-38.1) |
|
CCT-POP beneficiary | |||||||||
|
Yes |
15 |
407.5 |
10.5 (5.7-18.5) |
963 |
4 241.8 |
59.4 (54.5-64.2) |
46 |
176.1 |
3.1 (2.1-4.4) |
|
Liconsa beneficiary | |||||||||
|
Yes |
12 |
526.4 |
13.4 (5.5-29.4) |
171 |
1 332.7 |
18.6 (14.8-23.2) |
58 |
364.8 |
6.3 (4.2-9.3) |
|
Indigenous |
|||||||||
|
Yes |
11 |
233.7 |
6.0 (2.9-11.9) |
84 |
566.6 |
7.9 (5.0-12.2) |
35 |
142.0 |
4.1 (2.4-6.9) |
|
HWI tertile |
|||||||||
|
1 |
80 |
1 992.9 |
52.1 (40.4-63.7) |
843 |
4 057.5 |
56.9 (52.3-61.3) |
521 |
2 457.3 |
42.5 (37.9-47.3) |
|
2 |
53 |
1 008.6 |
26.4 (18.1-36.7) |
427 |
1 973.9 |
27.7 (24.2-31.4) |
319 |
2 079.3 |
36 (31.6-40.6) |
|
3 |
19 |
820.2 |
21.5 (11.8-35.8) |
159 |
1 105.3 |
15.5 (12.2-19.5) |
164 |
1 241.4 |
21.5 (17.8-25.7) |
ENN: Encuesta Nacional de Nutrición
Ensanut: Encuesta Nacional de Salud y Nutrición
CCT-POP: conditional cash transfer program Progresa/Oportunidades/Prospera
HWI: household wealth index
BMI: body mass index
ZD prevalence diminished over time, from 33.1% in 1999 to 10.8% in 2018-19. In 1999, higher ZD prevalence was observed in children with stunting (45.3%) within the lowest HWI tertile (40.6%), in children with anemia (35.8%), in CCT-POP beneficiaries (76.4%), and in children living in the South (50.3%) and in rural localities (51.4%). In 2018-19, higher ZD prevalence was registered in children within the highest HWI tertile (15.1%), residing in urban localities (12.6%), living in the North (14.4%), and who were CCT-POP beneficiaries (17%) (table II).
Table II: Comparison of zinc deficiency prevalence and mean of serum zinc, by descriptive characteristics of children aged 1-4 y. Mexico, ENN 1999, Ensanut 2006 and Ensanut 2018-19
|
ENN1999 |
Ensanut 2006 |
Ensanut 2018-19 |
||||||||||
|
n |
Expansion |
n |
Expansion |
n |
Expansion |
|||||||
|
N (thousands) |
% (95%CI) |
Mean(95%CI) |
N (thousands) |
% (95%CI) |
Mean(95%CI) |
N (thousands) |
% (95CI) |
Mean(95%CI) |
||||
|
National |
158 |
3 921.4 |
33.1 (24.0,43.7) |
72.9 (68.6,77.1) |
1 435 |
7 165.1 |
26.3 (22.9,30.1) |
92 (88.7,95.3) |
1 004 |
5 778.1 |
10.8 (7.6-15.1) |
86 (83.8-88.1) |
|
Age (months) |
||||||||||||
|
12-23 |
11 |
380.8 |
17.6 (3.9-52.9) |
73.3 (65.6-81.0) |
206 |
952.2 |
26.5 (19.3-35.4) |
97.5 (88.6-106.4) |
185 |
928.8 |
6.0 (3.4-10.1) |
85 (81.6-88.4) |
|
24-35 |
19 |
410.8 |
49.4 (23.7-75.5) |
65.6 (58.4-72.9) |
314 |
1 509.0 |
25.9 (19.8-33.1) |
92.2 (85.6-98.7) |
241 |
1 414.4 |
14.8 (7.0-28.7) |
83.7 (79.1-88.2) |
|
36-47 |
55 |
1 448.1 |
28.0 (14.1-48.0) |
76.0 (67.0-85.0) |
421 |
2 191.3 |
21.5 (16.4-27.8) |
93.5 (88.1-98.8) |
290 |
1 603.9 |
10.7 (6.3-17.4) |
86.7 (82.7-90.7) |
|
48-59 |
73 |
1 681.6 |
37.0 (24.3-51.9) |
71.8 (67.0-76.7) |
494 |
2 512.5 |
30.7 (24.8-37.3) |
88.6 (83.4-93.8) |
288 |
1 831.0 |
10.4 (5.6-18.4) |
87.6 (83.7-91.5) |
|
Age group (years) | ||||||||||||
|
1-2 |
30 |
791.6 |
34.1 (16.0-58.5) |
69.3 (63.3-75.4) |
520 |
2 461.2 |
26.1 (21.1-31.9) |
94.2 (88.7-99.7) |
426 |
2 343.2 |
11.3 (6.1-20.0) |
84.2 (81.1-87.3) |
|
3-4 |
128 |
3 129.7 |
32.9 (22.7-44.9) |
73.7 (68.7-78.8) |
915 |
4 703.9 |
26.4 (22.3-31.0) |
90.9 (87.1-94.7) |
578 |
3 434.9 |
10.5 (7.0-15.5) |
87.2 (84.3-90.0) |
|
Sex |
||||||||||||
|
Male |
77 |
2 318.3 |
29.9 (18.1-45.1) |
74.7 (68.4-81.0) |
761 |
3 745.7 |
26.9 (22.6-31.8) |
91.9 (87.7-96.1) |
526 |
3 041.6 |
11.9 (7.2-19.1) |
86.6 (83.7-89.5) |
|
Female |
69 |
1 323.8 |
38.1 (24.8-53.5) |
69.1 (63.8-74.4) |
674 |
3 419.4 |
25.7 (21.1-30.8) |
92.2 (87.5-96.8) |
478 |
2 736.4 |
9.6 (6.1-14.8) |
85.3 (82.0-88.5) |
|
BMI |
||||||||||||
|
Normal |
127 |
3 153.9 |
29.6 (20.0-41.4) |
73.5 (68.4-78.6) |
1 233 |
6 267.9 |
25.5 (21.9-29.6) |
92.2 (88.7-95.8) |
917 |
5 358.8 |
10.6 (7.3-15.2) |
86.3 (84.0-88.6) |
|
Overweight |
11 |
339.3 |
61.3 (25.0-88.3) |
66.2 (59.8-72.7) |
117 |
467.7 |
36.1 (23.9-50.5) |
90.3 (79.0-101.7) |
72 |
337.9 |
8.5 (2.9-22.1) |
82.4 (78.3-86.5) |
|
Stunting |
||||||||||||
|
No |
110 |
2 761.7 |
29.0 (18.3-42.6) |
74.4 (68.9-79.9) |
1 147 |
5 357.0 |
26.3 (22.7-30.3) |
92.1 (88.7-95.6) |
814 |
4 673.7 |
10 (6.9-14.4) |
86.3 (83.9-88.6) |
|
Yes |
28 |
731.5 |
46.5 (26.2-68.1) |
66.9 (59.5-74.3) |
203 |
1 378.6 |
26.1 (18.7-35.2) |
91.9 (83.4-100.5) |
151 |
887.4 |
12 (5.7-23.6) |
83.9 (78.9-88.9) |
|
Anemia | ||||||||||||
|
No |
121 |
3 196.1 |
35.8 (25.1-48.1) |
72.0 (66.8-77.2) |
1 115 |
5 536.5 |
26.0 (22.3-30.1) |
93.3(89.7-96.9) |
704 |
4 031.8 |
11.4 (7.9-16.3) |
85.0 (82.6-87.4) |
|
Yes |
26 |
473.9 |
11.3 (3.4-31.4) |
77.2 (71.9-82.6) |
297 |
1 529.3 |
26.8 (19.9-35.1) |
87.6 (81.4-93.8) |
299 |
1 742.6 |
9.5 (5.3-16.4) |
88.2 (84.3-92.0) |
|
Dwelling type |
||||||||||||
|
Urban |
94 |
2 712.7 |
25.0 (15.5-37.6) |
75.9 (70.6-81.2) |
659 |
3 687.4 |
24.6 (19.6-30.3) |
92.7 (87.7-97.6) |
582 |
4 035.8 |
12.6 (8.3-18.5) |
85.7 (82.8-88.6) |
|
Rural |
64 |
1 208.6 |
51.4 (35.4-67.1) |
66.1 (61.5-70.7) |
776 |
3 477.7 |
28.2 (23.6-33.2) |
91.4 (87.0-95.8) |
422 |
1 742.2 |
6.8 (4.1-11.3) |
86.6 (84.0-89.3) |
|
Geographic region | ||||||||||||
|
North |
46 |
590.8 |
20.2 (6.8-46.9) |
76.5 (69.1-83.9) |
224 |
973.5 |
27.4 (20.9-35.2) |
94.3 (87.9-100.7) |
145 |
1 127.6 |
14.4 (8.0-24.6) |
87.9 (82.0-93.7) |
|
Central and Mexico City |
57 |
1 656.1 |
20.4 (10.3-36.3) |
77.3 (69.9-84.7) |
618 |
2 528.0 |
27.7 (21.5-34.8) |
91 (86.2-95.8) |
352 |
2 705.1 |
12.5 (7.2-20.9) |
84 (80.4-87.5) |
|
South |
55 |
1 674.4 |
50.3 (34.6-65.9) |
67.2 (62.2-72.1) |
532 |
2 582.1 |
29.5 (24.1-35.6) |
92.6 (87.0-98.3) |
507 |
1 945.3 |
6.4 (4.2-9.7) |
87.7 (85.4-89.9) |
|
CCT-POP beneficiary | ||||||||||||
|
No |
141 |
3 479.7 |
27.9 (18.9-39.1) |
74.8 (70.4-79.2) |
1 195 |
6 024.2 |
26.9 (23.3-30.9) |
93.2 (87.9-98.5) |
957 |
5 594.8 |
10.6 (7.4-15.0) |
86.1 (83.9-88.4) |
|
Yes |
15 |
407.5 |
76.4 (47.7-92.0) |
57.8 (49.2-66.5) |
240 |
1 140.9 |
23.3 (16.6-31.6) |
90.9 (86.8-95.1) |
46 |
176.1 |
17.8 (6.3-41.3) |
82.1 (75.0-89.1) |
|
Liconsa beneficiary | ||||||||||||
|
No |
146 |
3 395.0 |
37.3 (27.6-48.1) |
70 (66.9-73.0) |
1 264 |
5 832.3 |
29 (25.2-33.1) |
92.2 (88.4-95.9) |
946 |
5 413.3 |
10.9 (7.5-15.4) |
86.1 (83.8-88.4) |
|
Yes |
12 |
526.4 |
6.1 (0.7-37.6) |
91.4 (81.9-100.9) |
171 |
1 332.7 |
14.6 (9.0-22.9) |
91.5 (85.0-98.0) |
58 |
364.8 |
10.3 (3.3-27.6) |
84 (78.4-89.7) |
|
Indigenous |
||||||||||||
|
No |
147 |
3 687.7 |
33 (23.3-44.5) |
72.8 (68.2-77.3) |
1 351 |
6 598.5 |
26.4 (22.8-30.3) |
91.7 (88.3-95.2) |
543 |
3 292.9 |
10.7 (7.1-15.9) |
87.4 (84.4-90.3) |
|
Yes |
11 |
233.7 |
34.3 (11.4-67.9) |
74.4 (62.0-86.9) |
84 |
566.6 |
25.6 (15.4-39.4) |
95.5 (84.6-106.5) |
35 |
142.0 |
5.6 (1.3-21.1) |
83.4 (75.9-90.9) |
|
HWI tertile |
||||||||||||
|
1 |
80 |
1 992.9 |
40.6 (27.7-54.9) |
68.3 (64.4-72.3) |
843 |
4 057.5 |
29.6 (24.7-34.9) |
90.2 (85.7-94.6) |
521 |
2 457.3 |
6.0 (4.0-8.9) |
87.9 (85.7-90.0) |
|
2 |
53 |
1 008.6 |
31.5 (17.0-50.8) |
76.3 (70.4-82.3) |
427 |
1 973.9 |
23.9 (18.8-30.0) |
92.3 (87.7-96.9) |
319 |
2 079.3 |
14.0 (8.9-21.2) |
86.7 (82.9-90.4) |
|
3 |
19 |
820.2 |
18.7 (5.0-50.0) |
79.7 (66.3-93.0) |
159 |
1 105.3 |
19.4 (12.5-29.0) |
97.2 (87.2-107.1) |
164 |
1 241.4 |
15.1 (7.5-28.0) |
81.1 (76.1-86.2) |
ENN: Encuesta Nacional de Nutrición
Ensanut: Encuesta Nacional de Salud y Nutrición
CCT-POP: conditional cash transfer program Progresa/Oportunidades/Prospera
HWI: household wealth index
BMI: body mass index
Compared to 1999, ZD was 47.2% lower in 2006 (OR=0.52, p=0.027 95%CI 0.30-0.92) and 76.8% lower in 2018-19 (OR=0.23, p<0.001, 95%CI 0.12-0.44), after considering confounders.
In the adjusted model (table III), the only child characteristic associated with ZD was overweight (OR=2.3, p=0.023), compared to children with normal BMI. A significant decline in the probability of ZD was observed among CCT-POP beneficiaries in subsequent surveys in relation to the ENN-1999 (p for interaction <0.01). ZD was statistically lower in 2018-19 among non-beneficiaries (OR=0.36, p=0.002) compared to 2006. Marginal significance was observed in the association of anemia with lower odds of ZD (OR=.071, p=0.083).
Table III: Logistic regression model of characteristics associated with zinc deficiency in Mexican children aged 1-4 y. Mexico, ENN 1999, Ensanut 2006 and Ensanut 2018-19
|
n |
2 018 |
||
|
N (thousands) |
13 312.65 |
||
|
OR |
95%CI |
p-value |
|
|
Survey |
|||
|
ENN 1999 |
1.0 |
Reference |
|
|
Ensanut 2006 |
0.88 |
(0.47-1.65) |
0.691 |
|
Ensanut 2018-19 |
0.29 |
(0.14-0.6) |
0.001 |
|
CCT-POP beneficiary (reference: non-beneficiary) | |||
|
Yes |
14.97 |
(2.57-87.29) |
0.003 |
|
Interaction |
|||
|
Ensanut 2006 and CCT-POP |
0.09 |
(0.02-0.54) |
0.008 |
|
Ensanut 2018-19 and CCT-POP |
0.14 |
(0.02-1.35) |
0.089 |
|
Sex (reference: male) |
|||
|
Female |
0.99 |
(0.7-1.4) |
0.973 |
|
Age (years) |
1.13 |
(0.94-1.36) |
0.187 |
|
Indigenous (reference: non-indigenous) | |||
|
Yes |
0.64 |
(0.34-1.2) |
0.164 |
|
Dwelling type (reference: urban) | |||
|
Rural |
1.07 |
(0.67-1.7) |
0.791 |
|
Geographic region (reference: North) | |||
|
Central and Mexico City |
0.85 |
(0.47-1.53) |
0.583 |
|
South |
1.15 |
(0.63-2.07) |
0.649 |
|
HWI tertile (reference: tertile 1) | |||
|
2 |
1.07 |
(0.68-1.69) |
0.775 |
|
3 |
0.65 |
(0.31-1.34) |
0.242 |
|
BMI (reference: normal) |
|||
|
Overweight |
2.18 |
(1.11-4.26) |
0.023 |
|
Anemia (reference: no anemia) |
0.71 |
(0.48-1.05) |
0.083 |
|
Intercept |
0.25 |
(0.48-1.05) |
0.011 |
ENN: Encuesta Nacional de Nutrición
Ensanut: Encuesta Nacional de Salud y Nutrición
CCT-POP: conditional cash transfer program Progresa/Oportunidades/Prospera
HWI: household wealth index
BMI: body mass index
Adjusted means of serum zinc concentration in the two latest surveys were statistically different among CCT-POP beneficiaries compared to 1999 (figure 1).
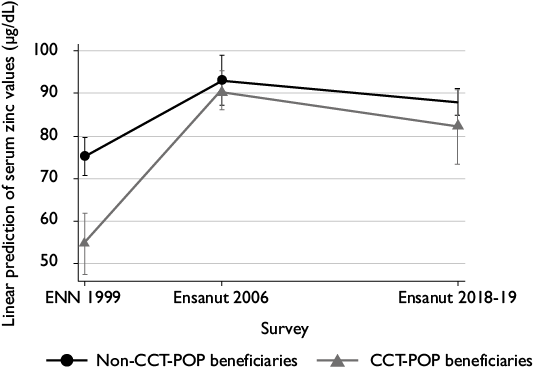
* Linear regression model adjusted by all variables listed in table IV. In the ENN 1999, information regarding blood sample measurements, including time of day and participant’s fasting state, was unavailable; serum zinc values were not adjusted for these variables in the model.
ENN: Encuesta Nacional de Nutrición
Ensanut: Encuesta Nacional de Salud y Nutrición
CCT-POP: conditional cash transfer program Progresa/Oportunidades/Prospera
Figure 1 Adjusted mean* of serum zinc in children aged 1-4 y, beneficiaries and non-beneficiaries of the social program CCT-POP. Mexico, ENN 1999, Ensanut 2006 and Ensanut 2018-19
Discussion
The results of this study highlight three main findings: 1) ZD in Mexican children aged 1-4 y has declined over the last 19 years by 22.3 percentage points (pp), currently affecting 1 out of every 10 children; 2) ZD decline was more pronounced among beneficiaries of the CCT-POP program (-58.6 pp) than among non-beneficiaries, and finally, 3) overweight was the only personal characteristic associated with higher probability of ZD.
In 2018-19, ZD affected 1 out of every 10 Mexican children aged 1-4 y: a lower prevalence than that reported among children living in localities with <100 000 inhabitants in Ensanut 100k-2018, where ZD was present in 18.6% and affected a larger proportion of one-year-old children (33%) and children within the lowest HWI (23.3%).22 Differences in ZD prevalence are mainly due to the personal characteristics of the child participants in Ensanut 100k-2018 and Ensanut 2018-19, including lower socioeconomic conditions, which are a main driver of micronutrient deficiencies among our population. In Latin American children under five years of age, low serum zinc levels have been reported, of 28.8% in Ecuador (2013), 34.9% Guatemala (2010),23 and 36.0% in Colombia (2015).24 In children under the age of 10 in the USA, the ZD prevalence was 3.8%.25
Serum zinc concentrations in Mexican children have exhibited an important improvement nationally over the last 19 years, partly due to social programs. When CCT-POP emerged, the program included a strategy to address undernutrition by focusing on the population living in poverty26 and providing a supplement containing vitamins and minerals (10 mg of zinc sulphate monohydrate and 10 mg of microencapsulated ferrous sulphate). However, despite the decrease in ZD, a high proportion of CCT-POP beneficiaries showed higher rates of ZD than of non-beneficiaries across all surveys, though the most notable reduction in ZD among CCT-POP beneficiaries was observed from 1999 to 2006. Even though CCT-POP was not designed to specifically address ZD, the effectiveness of the supplementation provided by the program showed a positive effect on linear growth: an outcome associated with micronutrient deficiencies.8 Nevertheless, program barriers have been identified -including inappropriate use of the supplement, and limited frequency and quantity of consumption-10 which may explain the differences in ZD between beneficiaries vs. non-beneficiaries. Despite its positive impact on the nutrition of the child beneficiaries of CCT-POP, the program was terminated in 2018 and remains absent from the Mexican government’s agenda.
A disruption to the normal linear growth pattern of a child may indicate zinc deprivation at early ages, and stunting can be an indirect indicator of the risk of zinc deficiency.27 Alongside the changes observed in the magnitude of ZD, stunting decreased around 7 pp nationally over the analysis period (1999-2018),28 which suggests that the latter may be related to zinc status. The higher rates of ZD observed in relatively younger children may have resulted from higher requirements and lower intake due to such factors as prematurity, weaning, and lack of dietary zinc.2,29 Breast milk is a good dietary zinc source in the first 5-6 months of life;30 however, recent data shows that only 28% of Mexican children are exclusively breastfed.31 The dietary zinc intake in children aged <5 years was adequate according to DRIs criteria in Ensanut 2012.32 Although this data was not adjusted for zinc bioavailability (including phytate and fiber), zinc absorption from corn intake in Guatemalan schoolchildren was observed not to differ between low vs. normal phytate content.33 Therefore, the high intake of dietary zinc reported in Ensanut 2012 may have improved serum zinc levels in Mexican children.
ZD secondary to low zinc intake may be a risk factor for diabetes,34 obesity3 and anemia.35 ZD, independently of iron deficiency, affects erythropoiesis by way of the GATA1 transcription factor involved in erythroid maturation and heme synthesis, which contains two zinc finger domains.36 Our data and those reported in Ensanut 100k-201822 have demonstrated an inverse association between ZD and anemia, which is difficult to explain using a cross-sectional study design; therefore, caution is recommended when interpreting this association.
Overweight was the only descriptive characteristic of child participants associated with higher probability of ZD. Although the potential to demonstrate causality within our study is limited, previous evidence shows that zinc metabolism affects and is affected by the excess of body fat. Lower zinc levels have been documented in obese children.37,38,39 In contrast, plasma zinc was not shown to correlate with body composition in overweight Chilean preschool-age children.40 Zinc is an essential component of several proteins involved in macronutrient metabolism and energy regulation. ZIP14 is a zinc influx transporter expressed in multiple bodily tissues, particularly in adipocytes, to maintain the homeostasis of intracellular zinc.41 ZIP14 is involved in the signalling of the insulin pathway and glucose metabolism.34 However, recent data shows that ZIP14 gene expression is lower in obese individuals, compared with non-obese controls,42 which may lead to enhanced fat deposition and reduced lean body mass.43 Alongside the adipokines secreted by adipocytes, ZD increases the inflammatory response in obese individuals. Reverse causality may also explain the association of overweight with ZD reported in this study.44
Our study has certain strengths and limitations. The methodology to determine zinc concentration varied between the three surveys analysed, potentially introducing measurement error in the variability of zinc levels. To allow comparison, the same NIST 3131a material was used as external quality control, and internal procedural validation was performed in all surveys. Serum zinc is considered a useful biomarker to assess ZD risk in populations, but it is not a reliable indicator of individual-level deficiency or of nutritional status of zinc, since zinc homeostasis is tightly controlled.21 Variations in serum zinc may be due to factors including infection, hypoalbuminemia, time of day of measurement, and recent intake.45 Unfortunately, this information was not available in all the surveys. Data on C-reactive protein (CRP) and diarrhea episodes was unavailable in the ENN 1999. Additional analysis of CRP and micronutrient supplement consumption in the Ensanut 2006 and Ensanut 2018-19 were not associated with ZD (data not shown). Finally, information on zinc supplement consumption and dietary sources of zinc was not analysed in the present study, which could partially explain the ZD reduction between survey periods. Further analysis of the major food sources of zinc in the Mexican population are necessary in order to understand the role of diet in zinc nutritional status.
Our findings have important public health implications, since ZD is a reversible condition. First, breastfeeding should be encouraged to assure optimal nutrition in early ages. Second, new social programs targeted towards populations at higher risk of micronutrient deficiencies should be implemented to tackle undernutrition at early ages. Finally, food fortification and biofortification of staple foods with zinc46 and iron should be promoted as a strategy to avoid mineral deficiencies in the Mexican population.
Conclusions
Zinc deficiency has declined significantly in preschool-age Mexican children during the last 19 years. Children who were beneficiaries of the social program CCT-POP exhibited the largest ZD reduction. New public health strategies are necessary to ensure adequate nutrition in children at high risk of undernutrition, either by creating new targeted social programs or by the fortification and biofortification of staple foods.

