


 nueva página del texto (beta)
 Inglés (pdf)
 Artículo en XML
 Referencias del artículo
 Enviar artículo por email
 Citado por SciELO
  Similares en
SciELO
Similares en
SciELO 
 Permalink
Introduction
Since 1980, the prevalence of obesity has doubled in more than 70 countries. Globally, a total of 107.7 million children and 603.7 million adults are obese.1 The Non-Communicable Diseases (NCDs) Risk Factor Collaboration estimated that if current trends continue, by 2025 the global obesity prevalence will reach 18% in men and surpass 21% in women; and severe obesity will surpass 6% in men and 9% in women.2 A large proportion of obesity, diabetes, and hypertension are NCDs that can be prevented and treated with a healthy diet; nevertheless, current actions to prevent and control these diseases are not enough.3 Currently, the tendency of processed food consumption is increasing globally.4,5,6 One of the population approaches to control and prevent NCDs is to include clear nutrition information in packaged foods. Nutrition labeling has been internationally recognized a as tool that helps consumers making better food choices.7,8 Since nutrition labeling gives information about energy and nutrients of concern; it has the potential to decrease the intake of such nutrients.9 For this reason, several countries in the world and recently in Latin America, have implemented mandatory labeling systems as part of their obesity prevention strategy, like the warning labels (WL) or the multiple traffic light (MTL).10,11,12 Previous studies have documented that a clear and easy to understand front of package labeling (FOPL) can help consumers making healthier food choices.11,13,14,15
Nutrition labeling systems have been a matter of public debate. For example WLs, implemented in Chile, have shown a higher impact in consumers’ choices compared to the Guideline Daily Amounts (GDA) and the MTL.13,14 Conversely, systems such as the GDA and the MTL, were systems proposed by the food industry and had less impact on accurate understanding among consumers.16,17,18,19 The GDA implemented in Mexico has been proven not understandable, an experimental study performed among nutrition students tested their comprehension; the result was that 68% were unable to understand labels.20
The Mexican National Health and Nutrition Survey of 2012 reported that the combined prevalence of overweight and obesity was (71.3%)21 and the prevalence of diabetes was (9.17%).22 In an effort to reduce the high burden of obesity and diabetes in Mexico, a National Strategy against Overweight, Obesity and Diabetes (ENPCSOD by its acronym in Spanish) was launched in 2013 in the wake of a new government taking office.23 In 2014, as part of the Strategy, the Mexican government implemented a mandatory FOPL system that included (figure 1): 1) A mandatory GDA in the front of the package, similar to a previous voluntary system, and 2) A voluntary logo for foods that comply with Ministry of Health nutrient criteria, called Nutritional Stamp (NS). The current mandatory nutrition labeling system launched in 2014 is regulated by the ENPCSOD and by the Official Mexican Act (Norm 051).23,24 Additionally, packaged foods in Mexico carry the Nutrition Facts Table (NFT) in the back of the package that is also regulated by the Norm 051 since 1994. Manufacturers can also add health or nutrition claims to the front of the package. Claims are defined as any representation which states, suggests or implies that a food has particular characteristics relating to its origin, nutritional properties, nature, production, processing, composition and any other quality.25 Before the FOPL became mandatory as part of the Strategy, the largest consortium of food manufacturers placed a GDA system voluntarily as a means of self-regulation.26 The GDA labeling system face a limitation: it uses a reference value higher than the World Health Organization (WHO) recommendation on sugar.27 Later, in 2016 the Minister of Health in Mexico declared an epidemiological alert due to the high incidence of obesity and diabetes in Mexico.28 The National Survey of 2016 reported that the combined prevalence of overweight and obesity was (72.5%), and the prevalence of diabetes was (9.4%).3 Two years later a national assessment showed that the nutrition labeling strategy implemented by the government was not effective among the population.29
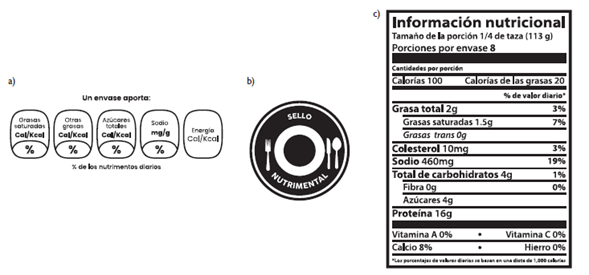
Figure 1 Nutrition labelling system implemented in Mexico: a) Guideline Daily Amount (GDA) displayed in the front of the package, b) Nutritional Stamp (NS) voluntary logo for foods that comply with nutrient criteria, c) Nutrition Facts Table (NFT) displayed in the back of packaged foods
Mexico is a country characterized by high rates of inequality hence different socioeconomic statuses (SES) coexist. It was estimated that almost 43.6% suffered from poverty in 2016.30 From the adult population 60.9% (25-64 years) had only completed middle school.31 Under this context, it is important to explore how people from different SES use and understand the nutrition labeling and claims. In Mexico some quantitative studies have explored the use and comprehension of food labeling;20,29,32 nevertheless, none of them qualitatively explore the reasons of the use and the reasons of the lack of comprehension among different SES, and least the perception of claims among different SES. This paper is part of a comprehensive process evaluation on the FOPL implementation in Mexico performed from 2013 to 2015. The aim of this qualitative study was to explore consumer’s perceptions towards of the use and comprehension of the nutrition labeling including GDA, NFT, NS and claims among different SES.
Materials and methods
Study desing and sampling
This qualitative study analyzed results of 12 focus groups performed between June and August of 2015 in the largest and most populated cities of Mexico (Guadalajara, Mexico City, Monterrey, and Querétaro). A purposive sampling of adults exiting supermarkets, who answered an in-site questionnaire (not reported in this paper), were invited to participate in focus groups. Three focus groups were conducted per city and were stratified by SES (low, medium, and high SES). We selected a sample from a list of all supermarkets in each city to stratify supermarkets, hypermarkets, membership food stores, and convenience stores by SES. Those supermarkets were mapped using a geo-reference system to determine the Basic Geostatistical Areas (AGEB by its acronym in Spanish) where they were located. AGEBs are a proxy-estimation of socio-demographic characteristics of the area in each city, they are specific and delimitate urban areas with 2 500 inhabitants or more, and are used to locate specific socio-demographic conditions such as living, commercial, and industrial usage, among others. They are a proxy estimation of the socio-economic characteristics of areas in each city.33 The supermarkets in each AGEB were randomly selected and proportional to the distribution of three levels of marginalization defined by the National Institutes of Statistics and Geography on a scale of low, middle, and high.34,35 Trained staff with health background (dietitians) recruited the participants and collected the data for the study. The training was conducted during a whole day session. From 9 am to 5 pm researchers instructed fieldworkers about how to approach subjects. They performed two exercises to practice before doing the fieldwork. Fieldworkers asked participants if they make their usual grocery shopping in that supermarket, if they answered that they did, and their self-reported family income (reported in quantitative survey not reported in this paper) matched the SES of the supermarket they were recruited to participate in the focus groups. We looked for a homogeneous sampling in each focus group in order to make comparisons between statuses and observe differences. Each focus group was integrated by 8 to 10 participants of similar characteristics (age, education, and SES).
Snowballing sampling technique was performed in three focus groups as some of the participants asked to attend with a family member or a friend. Participants were eligible for inclusion only if they were willing to participate, were literate, and were older than 18 years old. We excluded participants who did not shop in grocery stores, those who were older than 65 years old, and those who were visually impaired or blind. Nutrition researchers and nutrition students from the University of Guadalajara, the Mexican National Institute of Public Health, the Autonomous University of Nuevo Leon, and the Health Promotion Department of the Ministry of Health of Querétaro helped with sample recruiting, provided the venue, and transportation. Date and time of the sessions were given in a written format to potential participants outside supermarkets. Focus groups were performed in universities’ classrooms. In Mexico City they were performed in the Mexican National Institute of Public Health and in Querétaro they were performed in the meeting room of the health promotion department. Participants were offered food and beverages during the focus group session for their time and participation.
Ethical considerations
The study was approved by the Ethics and Biosafety Committees of the Mexican National Institute of Public Health (Approval number: 1153). Before starting the focus group session, oral informed consent was obtained from the participants, and was audio-recorded prior to participating in the research. Participants were informed that their identity and data would be anonymous; also, they were informed that they could stop participating at any time of the study.
Focus group guide and tools
A semistructured guide was developed a priori guided by the health belief model36 and the theory of planned behavior37,38 (supplementary appendix 1, Spanish version).39 The aim of the guide was to prompt questions and explore perceptions towards the use and comprehension of nutrition labeling including GDA, NFT, NS, and claims. Emergent themes during the thematic analysis were also included in results. The focus group guide was piloted with two focus groups. One with participants from high SES recruited in the waiting room of a medical doctor private practice. The other was helded with janitors of a primary school. The guide was revised and corrected accordingly using field notes taken by one researcher and by the moderator. Questions were revised one by one in a full-day meeting. Discussion were helded when the moderator and the assistant agreed that the question was not fully understood. Figure 2 shows the different labels visually presented to participants during the focus group sessions: 1) GDA, 2) Claims, and 3) NS. The real size of the labels was one page A4. Labels were presented in Spanish. Main themes included attitudes towards nutrition labeling, and beliefs and opinions of different labeling formats.
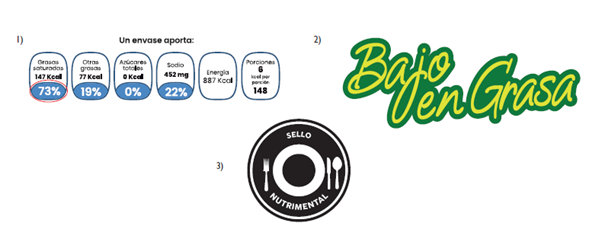
1) GDA: defined according to the Mexican regulation, NOM-051, which states that the mandatory front of the package labeling must display the following nutrients of concern per package: saturated fat, other fats, sugar, sodium and energy. 2) Claims: defined as any representation which states, suggests or implies that a food has particular characteristics relating to its origin, nutritional properties, nature, production, processing, composition and any other quality. 3) Nutritional Stamp: defined according to the Mexican regulation NOM-051. A packaged food will be able to carry the stamp if complies with the nutritional criteria established by the Ministry of Health.
Figure 2 Labels presented to participants during focus group sessions 1) Guideline Daily Amount (GDA), 2) Claims, and 3) Nutritional Stamp (NS)
Focus groups and data analysis
Three researchers moderated the focus groups (CM, CN, AC). They were trained to guide the focus group similarly and follow the same methodology in all the sessions. One is a medical doctor and the other two are dietitians. An observer was present at all times to help the moderator and take the corresponding field notes. All focus group sessions were audio-recorded with two devices, and lasted between one and two hours. The audiotapes were transcribed verbatim. Transcripts were checked against the recordings to ensure accurate reporting. Data was coded with an inductive approach.40 Three researchers coded and analyzed the data individually (CM, CN, AC). Coding decisions were made in a consensus meeting. At least two researchers had to agree on coding to make the decision. The key themes were determined before, but researches also took into account themes that emerged from the focus groups (table I). A thematic analysis based on a positivism perspective was conducted.41 We identified main key themes, within the main themes, several sub-topics emerged as perceptions of the use and comprehension of the different nutrition labeling systems and claims.
Table I: Definition of categories and subcategories defined prior and during the thematic analysis of the perception of the use and understanding of nutrition labels in 12 focus groups performed in Guadalajara, Mexico City, Monterrey, and Querétaro in 2015
|
Categories |
Subcategories |
||
|
Name |
Definition |
Name |
Definition |
|
Perception towards nutrition labeling |
This refers to the perception favorable or unfavorable towards using nutrition labels in general. It includes GDA, and NFT. |
Perceived advantages/favorable characteristics of nutrition labels. |
Answers about the factors that might improve use and understanding of labels, including GDA and NFT displayed in packaged foods. |
|
Perceived barriers when using nutrition labels. |
Answers about the factors that limit the use and understanding of nutrition labels, including claims displayed in the packaging. |
||
|
Perceptions about the claims on the FOPL |
Opinions and views about the claims and the accuracy of the information. |
Usefulness and perception.Accuracy of information. |
Perceptions about how useful and accurate claims are. |
|
Perceptions about the GDA in FOPL |
Perceptions about reliability of the GDA in the front of the package, usefulness and comprehension of the information displayed. |
Usefulness and comprehension |
Perception of the applicability and practicality of the GDA label when choosing foods and clear assimilation of the meaning of the GDA labels. |
|
Perceptions about the NS logo |
Perceptions on the usefulness and comprehension of the NS. |
Usefulness and comprehension |
Perception of the usefulness and comprehension of the NS if placed in packaged foods. |
GDA: Guideline Daily Amount
NFT: Nutrition Facts Table
FOPL: Front of Package Labeling
NS: Nutritional Stamp
Results
Participants’ characteristics
Each of the 12 focus groups had on average eight participants (min five, max 12). Table II shows the sociodemographic characteristics of participants stratified by SES. Most of the participants were female. Participants who reported less years of formal education were mainly in the low SES, while participants in the middle and high SES groups reported to attended high school, college or had a post-graduate degree.
Table II: Sociodemographic characteristics stratified by socioeconomic-status (SES) of the focus groups participants (N=78) from Guadalajara, Mexico City, Monterrey, and Querétaro in 2015
|
Socioeconomic status (%) |
|||
|
Low SES (n=26) % |
Medium SES (n=28) % |
High SES (n=24) % |
|
|
Age (mean±SD) |
38±20 |
41±18 |
50±15 |
|
Sex | |||
|
Male |
17 |
18 |
29 |
|
Female |
83 |
82 |
71 |
|
Education Level | |||
|
Elementary school |
33 |
7 |
0 |
|
Middle school |
28 |
7 |
6 |
|
High school |
39 |
43 |
43 |
|
College |
0 |
39 |
47 |
|
Postgraduate |
0 |
4 |
4 |
|
Occupation | |||
|
Housewife |
60 |
27 |
35 |
|
Student |
29 |
36 |
6 |
|
Employee |
11 |
37 |
59 |
%: percentage
SD: standard deviation
Perception towards nutrition labeling
In the present study, regardless of the participants SES an unfavorable perception emerged towards the current nutrition labels displayed in foods. In general, participants did not acknowledged any outcomes of reading the labels. They mostly reported not to read them because they do not understand them; nevertheless, some of them, acknowledged the importance of reading the “food you eat”.
Perceived advantages/favorable characteristics of nutrition labels
Despite participants’ background and negative perception of the current nutrition labeling system (GDA and NFT in the front and back of the package), participants acknowledged the relevance of having clear information on packaged foods to make healthier choices:
“It is important [to know what a product contains] because at certain age you begin to value more your health and taking care of what has the food you eat” (high SES).
“It is important to know what you are getting into your body” (medium SES).
“It tells you what to eat and the expiration date” (low SES).
Regardless their SES most of the participants mentioned that the information displayed is important due to several factors; some of them, mentioned the age and the concurrent presence of NCDs.
Perceived barriers when using nutrition labels
Regardless of the format, several barriers for using the nutritional labels (GDA and NFT) were identified by participants. These included the complex language used on the labels, the font size, the amount of information displayed on labels, and the lack of trust in the claims made on the package.
First, participants reported that the information is very technical, for example one participant mentioned: “I think most of the times they use other names, more technical names and then people gets confused and doesn’t know what it really is” (medium SES). In addition, participants reported that the font size is barely readable: “It is difficult to understand and the information has very small fonts” (high SES), “Only ants can read it” (low SES). This becomes an issue especially among older adults, as the main characteristics of the product could be difficult to read and to interpret by older population, and people with impaired vision.
Regardless the SES of participants, the opinion of any type of label on packaged foods was perceived as “confusing”, and “difficult to understand”. They also mentioned the lack of trust for claims a constraint for using nutrition labels. Participants perceived the nutrition labeling as a whole, including the GDA, the NFT, and the claims displayed on packaged foods. A member from a low SES focus group mentioned: “They [nutrition labels] are useless, we don’t understand them”. Particularly when referring to the GDA and the percentages displayed for each nutrient, a high SES participant mentioned “for me this percentage is confusing…it doesn’t says well, we don’t know percentage of what…”. A middle SES participant mentioned to partially understand the labels: “I only understand the calories” (medium SES). It was mentioned that some training or knowledge on the topic is needed to use the labels. For example, a participant reported: “If someone knows about this, maybe they can use it and understand it, but if not, it is very misleading” (high SES).
There are many constraints for the use and understanding of the labeling system implemented in Mexico, for both types of labeling, the GDA, and the NFT in the back of the package. Regardless of SES, participants made clear they do not understand the labeling; therefore, they find it useless to read.
Perceptions about the claims on the FOPL
Participants from medium SES and low SES consistently reported to mistrust the claims: “In reality we don’t know if the product has that characteristic or not…” (low SES), “Sometimes the information on the label might be accurate, but I think, most of the times is not reliable” (medium SES), “it might say it has cero fat, but it is obvious that any packaged food has something of that” (low SES).
Likewise, other participants from the high SES and medium SES are not sure that the information is accurate. Consumers from the high SES reported that they have no way to prove or verify the accuracy of such claims. “There is not a monitoring system implemented by the government to check if food products comply with claims they make on the front of the package” (high SES). Some other participants expressed that such claims are misleading: “People think that they can eat big amounts of that because it says light and they are eating fewer calories…” (medium SES). Also, among the high SES, the participants consistently mentioned: “They want to promote their product, with claims, cartoons, or bright colors. The information is about that, and not accurate (high SES)”.
Participants from the low and medium SES generally reported to mistrust the claims displayed in packaged foods. Data from the high SES suggest reliability of claims is compromised with marketing strategies. Participants tended to believe that the main driver for claims is marketing and promotion of a product.
Perceptions about the GDA in the FOPL
When participants were asked about their opinion of the GDA, high SES participants in general mentioned it as a better alternative than the NFT displayed on the back of the package. Nevertheless, they still mentioned it was difficult to understand, especially the percentages: “what I don’t like about them is the percentage; it doesn’t say anything and it is not standardized” (high SES). Participants from medium SES and low SES also believed it was easier to focus your attention and easier to read than the one in the back. In these two groups, their opinion changed when a GDA figure was bring into discussion (supplementary appendix 1),39 and participants were asked to explain it. Participants from the middle SES groups mentioned they understood how many calories the product had; however, they did not know how to interpret the information about sugar, fats and other fats. The term “other fats” caused confusion:
“Other fats content is that these aren’t natural or are more saturated?…” (medium SES).
Most of the participants from the low SES mentioned that the only thing they understand about the GDA is what portion means, but they defined it as “the total amount they should eat in one meal”. Some of the participants were aware of controlling their sugar intake by reading the GDA, mainly people who reported having diabetes, and consequently already attended workshops on diabetes care. Nevertheless, it was difficult for them to report how many grams the product contains, versus the amount of sugar they are allow to eat:
“One portion is the amount you can eat, more portion equals more sugar and more calories, but there is an established portion for diabetics, you cannot eat more than such portion, if you do, your glucose will rise” (low SES).
Participants from the high SES group reported to understand better the GDA labeling; nevertheless, they still found it confusing when looking at the GDA figure:
“Apparently it doesn’t have many calories but it says six portions…when it says calories per portion you may think that 6 is the whole package, or grams or I don’t know” (high SES).
Because of the confusion towards the GDA, participants do not consider this information drives their decision when buying foods. One participant from a low SES focus group declared “Sincerely, no [I don´t use it] because I don’t trust it I don’t use it” (low SES) and a high SES group participant mentioned: “Unless I fully understand [a nutritional label] I don´t use them” (high SES). Barriers to the use and understanding of the GDA were a common theme among all groups regardless their SES. Data show that the GDA in FOPL is not used nor comprehended as intended.
Perceptions about the “nutritional stamp” logo
The majority of participants across SES reported that the NS logo resembled a food plate. Most of them interpreted the stamp as a sign that the product “was healthy enough for you to put it in your plate”. Other examples for the perception of the stamp are:
“For me it means it is inside the nutritional plate, it is good” (low SES).
“I see it like something that is good and healthy” (high SES).
Some participants in the medium SES thought that the stamp resembles the signal of restaurants zones: “with the cutlery I think about restaurants” (medium SES).
Other participants in high SES and medium SES reported it was difficult to understand because the stamp does not say anything by itself.
“It’s easy but it doesn’t mean anything” (medium SES).
“It’s difficult; does not have any sense and says nothing” (high SES).
When asked about the kind of foods that could display this stamp, participants in high SES said prepared foods, canned foods and food for kids, while participants in medium SES and low SES said healthy foods. Some participants among all groups did not mention any foods because they did not know what the stamp actually meant. Researchers were unable to find an agreement among the different SES groups, participants simply do not agree about a meaning for the nutritional stamp.
Discussion
This paper explored the perceptions about the nutrition labeling system currently implemented in Mexico (GDA, NFT and NS) and also explored claims displayed in packaged foods. Our results suggest that although participants believed nutrition labeling is relevant and necessary, the current nutrition labeling system is not becoming a tool to make healthier food choices. Regardless participants’ SES, several problems to interpret the nutrition labeling were highlighted. These included the technicalities of the terms used, the format, the percentages, and partial understanding of the information. Our results mirror studies that reported technical information was a barrier to use and understand the GDA.20,42 When referring to claims, participants from all SES showed a general mistrust. Participants from the high SES perceived claims were a marketing strategy, more than a legit source of information to guide food decisions. These data is consistent with several studies that assess consumers trust.43,44,45,46
The GDA understanding had several barriers among participants regardless their SES. This is consistent with other studies performed in the country,20,29,42 Nevertheless, the high SES showed a better understanding compared to the low SES as it has been shown in a similar study.42 Participants from low and medium SES mentioned to only use the calorie section of the GDA and that understanding the portions was complicated. This can be explained by the fact that the GDA needs mathematical calculations.20,29
Additionally, the GDA has several limitations20,47 that might explain the lack of understanding. For example: 1) the lack of awareness among the population about the cut-off points of nutrients of concern, 2) it does not consider vulnerable population like children or illiterate population, 3) consumers have to make mathematical calculations to know their consumption, and 4) the cut-off points are not in line with the WHO recommendations.48,48,50 For example, the percentage of sugar in the Mexican GDA is calculated with the threshold of 90 gr of sugar a day not considering the sugar intake that comes from non-packaged foods.51 Other part of the current GDA that was not understood by most of the participants was the term “Other fats”, this misunderstanding might unable them when choosing for a healthier product with less content of fat.
Furthermore, some of the participants reported to only use and understand the calories displayed in the FOPL. This information is consistent with several studies that showed consumers only checked and understood the calories of a labeling or a menu.52,53,54 International evidence indicates that the population prefers an interpretive format, such format interpret the nutrition content with the help of symbols.19,49 Similarly, previous studies have shown that an interpretive format like the WLs have higher acceptance between minorities of the population.13,14,55 Other Latin American countries like Chile, Peru and Uruguay have implemented WLs, which are easier to understand and facilitate healthier food choices among the population.
Finally, the NS has not been evaluated before, but results show that participants’ perception towards the NS did not agree among different SES. The NS is voluntary in the Mexican market. Similar to the GDA the stamp’s cut off points are not in line with the World Health Organization recommendations.56 For all the reasons found, the stamp will not be a tool that could potentially help consumers make healthier food choices.
The present study was a convenience sampling but the fact that supermarkets were stratified by AGEB to identify the SES where participants do their shopping permits an accurate integration of homogenous participants in the focus groups. All focus groups by SES reached the saturation point by category at the second session. The results of this study cannot be extrapolated and is just representative of the population from which the data was collected, although transference is justified for the results of different SES. Our sample was limited to participants who were literate. We did not exclude participants that had chronic conditions, this might probably bias the results since they usually follow dietary advice to control their condition, which was reported in the sessions. For further investigation in case WLs are implemented in Mexico, it is recommended to perform a qualitative study to assess the reasons of use and understanding of such interpretive format.
Conclusion
In general participants have a negative perception towards the nutrition labels regardless their SES, they perceived several barriers to the use and understanding of the GDA; like the technicalities of the terms used, and the format. Also, claims are mistrusted especially among high SES. This data might call attention to policymakers in order to implement a simpler and easier to comprehend nutrition-labeling system that is understood across SES.

