


 nova página do texto(beta)
 Inglês (pdf)
 Artigo em XML
 Referências do artigo
 Enviar este artigo por email
 Citado por SciELO
  Similares em
SciELO
Similares em
SciELO 
 Permalink
Introduction
Nutrition labels on packaged food products have been introduced in many countries to help consumers improve their diet. As a health policy tool, nutrition labels provide the key nutrition information that consumers need in order to make informed food choices. Nutrition labelling is currently mandatory in Mexico and most countries in Latin America. A back-of-pack nutrition information panel declares the content of energy and the amount of protein, carbohydrate, sugars, fat, saturated fat, dietetic fibre, sodium per serving or per 100 g/100ml of food, vitamins and minerals.1 According to the Ensanut Survey (2016), in Mexico only 40% of the population read the nutritional labels, and almost 45% reported that they found them difficult to understand,2 whereas De la Cruz-Góngora, and colleagues3 estimate that 17% use nutritional labels to make decisions, but 49% do not understand them, and only 1% can provide correct answers to a simple nutrition label comprehension test.
However, the evidence of a positive link between label use and dietary outcomes is ambiguous. Some studies have found an association between nutrition label use and healthier diets.4 In contrast Drichoutis, Lazardis and Nayga,5 based on data from the 2005-2006. National Health and Nutrition Examination Survey, concluded that nutritional label use has no effect on the body mass index (BMI), while Variyam and Cawley6 found that the BMI of users of nutrition labels dropped significantly after the introduction of the 1990 Nutrition Labelling and Education Act. Studies of the impact of nutrition labels on food purchases by consumers have also produced conflicting results.7
One possible cause of the weak relationship between nutrition labels and dietary outcomes is the lack of robust measures of how consumers use and comprehend nutrition labels.8,9 Thus, accurate assessments of nutrition-related dimensions and dietary behavior relationships requires valid and reliable measures.10
On the other hand, most of what we know about how consumers use nutrition labels comes, disproportionately, from high-income Western countries, with the majority of studies originating in the United States, Canada and the United Kingdom. Therefore, it is unclear to what extent the findings of these studies apply to jurisdictions with different legal and cultural contexts.4 Studies in the context of Spanish speaking populations are scarce, with the exception of studies on nutrition literacy and healthy food choices among Latinos,11,12 Mexicans,3,13 and Spaniards.14,15,16
Nutrition labels are a health policy tool; as such, they are bound by legal considerations unique to every country. Although nutrition information displays and dietary recommendations are similar across countries, specific instruments may need adapting to account for differences in labels and consumers’ diet patterns.17 In addition, because of cultural variations in eating habits and population-specific dietary recommendations, instruments developed in other countries may not necessarily be valid for the Spanish speaking population. Given the alarming prevalence of overweight and obesity, especially in countries like Mexico,18,19,20,21 it is urgent to conduct more context-specific research on nutritional label use, employing appropriate and specific measures. This study helps to fill this gap by developing and validating a measure of consumer attitudes, use, and comprehension of back-of-pack nutrition labels of products by Spanish speaking adult consumers.
Materials and methods
Study design
Several studies were combined in order to build, test and validate the nutritional label scale we propose in this paper. In-depth interviews were conducted with both consumers (6) and experts (3) in qualitative research on uses and attitudes. A sample of 185 adults and undergraduate students answered the questionnaires that allow us to validate the scale. All studies were conducted in northeastern Mexico (Nuevo León, Coahuila, and Tamaulipas) during the fall of 2016. All the studies were approved by the Research and Ethics Committee of Hospital Metropolitano in Monterrey, Mexico (Protocol 17/723).
Identification of dimensions
Previous studies on nutrition labels have developed items to measure such constructs as perception of labels,22 attitudes towards labels,23,24 motivation to process label information,25 label comprehension,23,26,27,28,29,30,31 label knowledge,32 and behavioral intention and change.33 In addition, several studies have developed items that measure self-reported reading of labels22,24,30,33,34 and perceived understanding of labels.23,26,27
The review of the extant literature and a pilot qualitative inquiry conducted in the northeastern states of Mexico during 2016 suggested three important dimensions of the use of food labels by consumers. The first dimension is related to the consumers’ cognitive and affective evaluations of labels; we broadly refer to this dimension as “attitude towards labels”. The second dimension corresponds to the behavior related to utilization of nutrition labels by the consumers; we name this dimension “use of nutrition labels”. The third dimension involves the consumers’ ability to interpret and apply the information provided by nutrition labels; we refer to this dimension as “comprehension of nutrition labels”.
Following the literature, the attitude towards labels was operationalized in terms of interest, importance, value, and preference.4,35 Interest refers to the appeal that nutrition labels hold for consumers. Importance is related to the relevance which consumers assign to nutrition labels as sources of nutritional information. Value represents the utility that consumers derive from the information contained in nutrition labels. Finally, preference refers to the extent to which consumers would rather have a product with a nutrition label compared to one that does not have a label.
Comprehension refers to whether respondents interpret the information on the label correctly.31 Nutrition label comprehension was operationalized as consumers’ performance in nutrition label related tasks. Levy, Fein & Schucker28 define four basic label tasks regarding labels: comparing two products in order to find differences in nutrient levels, judging whether or not a nutrient claim is true, assessing the dietary implications of consuming a product, and estimating the contribution of a product to recommended daily intake levels.36 A fifth task -nutrition judgment, i.e. determining if consumers evaluate whether a product contains high or low levels of a particular nutrient- was also considered.26
Research suggests that consumer use is limited to looking at label information, with little further processing.37 Therefore, nutrition label use was operationalized as reading the nutrition label.
Qualitative phase
We developed the items for the nutrition label use scale based on a qualitative inquiry and the review of the extant literature on nutrition label use. For the exploratory, qualitative phase, we conducted in-depth interviews with a purposive sample38 of six adults in order to examine how consumers use nutrition labels. The sample was balanced between lay consumers and nutrition experts. All the studies were approved by the Research and Ethics Committee of Hospital Metropolitano in Monterrey, Mexico (Protocol 17/723).
In addition, we examined previous studies that had included items to measure related dimensions and selected and adapted relevant items. Since all of the previous studies that we reviewed were published in English, items were back-translated into Spanish.39,40 Finally, we constructed items to represent the conceptual domains described in the previous section. Special care was taken to avoid ambiguous, negatively phrased, double-barrelled, and excessively technical questions,41,42 keeping 53 items at this stage.
In order to test content validity, a panel of three nutrition experts conducted a review of the 53 items. Experts rated each item on relevance, appropriateness, and clarity, using a seven-point Likert-type scale anchored by ‘completely disagree/completely agree’.43 In addition, space for comments was provided next to each item. Quantitative ratings and qualitative evaluations of each item were analysed. As a result of this expert evaluation, the item pool was reduced to 33.
Quantitative phase
Using the pool of 33 items, we constructed the preliminary instrument in three main sections. The first section measured attitude towards nutrition labels using 13 items with seven-point Likert-type scales with ‘totally disagree/totally agree’ anchors. The second section measured nutrition label use and included seven items with seven-point Likert-type scales anchored by ‘never/ always.’ The third section included 13 multiple-choice items with a single correct answer; these measured the comprehension of nutrition label information by using nutrition tasks that required consumers to interpret and apply-i.e. to show understanding of- nutrition label data. A ‘don’t know’ category was included in the response choice set in order to discourage guessing.41 Finally, a number of demographic questions were included in the questionnaire with the purpose of classifying the respondents.
Finally, a pre-test was undertaken with 10 subjects in a paper based version, and 6 more in a computer administered version, using a probing technique to gain information from the respondents in regard to the questionnaire items.44 Readability was also assessed with the Flesch Reading Ease Score formula.45 According to this test, no further changes were necessary, and the readability obtained 76.4 out of 100 points, which indicates that the items were easy to read.
An online questionnaire was distributed to two samples. The first sample consisted of 125 adults, and the second, of 65 undergraduate students from a large university in northeastern Mexico.
Respondents from the second sample were informed that they would be required to complete a similar questionnaire five days later. 57 participants completed and submitted the questionnaire at this later time. The two repeated measures data from this second sample were used to assess the temporal stability of the measure.
An ANOVA revealed that there were no significant differences in the ratings of attitudes [F (1, 142) = 3.02, p = .08], use [F (1,142) = 2.30, p = .13], and comprehension assessment [F (1, 142) = .15, p = .69] between adults and students; therefore, the data were pooled. 52% of the final sample were female; 70% of these were aged 18 to 29 years, and 51% had college or higher education.
Results
The properties of the scales used to measure the attitudes and use section (interval scales) were substantially different from those utilized for the comprehension section (dichotomic items); therefore, their results were analysed separately.
An exploratory factor analysis conducted with the entire set of attitude and usage items resulted in a two factor structure that explained 71.60% of total variance. Table I shows the items loadings for these two factors.
Table I Factor loadings of the Nutritional Labels items for the pooled sample of adults and students
| Scale | Attitude | Use | ||||
| ACT5 | The information i get from nutrition labels is valuable to me | .843 | .258 | |||
| ACT6 | It is important for me to obtain information from nutrition labels | .840 | .299 | |||
| ACT3 | i am more interested in checking the nutrition labels of new products | .829 | .315 | |||
| ACT2 | Nutrition labels are important for me when i shop for food | .828 | .361 | |||
| ACT1 | i am interested in reading nutrition labels | .823 | .373 | |||
| ACT4 | I am more interested in checking the nutrition label of product i buy more often | .735 | .255 | |||
| ACT7 | I pay attention to whether a product has a nutrition label | .687 | .402 | |||
| ACT8 | I prefer to buy a product that has a nutrition label | .632 | .338 | |||
| USO2 | I read the nutrition label of products before i buy them | .347 | .843 | |||
| USO7 | I use the information on nutrition labels to compare products of different brands | .216 | .820 | |||
| USO5 | I read the nutrition label of products the first time i buy them | .399 | .772 | |||
| USO3 | I read the nutrition label of products before consuming them | .260 | .768 | |||
| USO1 | I read the nutrition label of products | .428 | .752 | |||
| USO4 | I read the nutrition label of products to check the amount of each nutrient | .319 | .678 | |||
Note: Estimated by the authors based on the information of the quantitative phase (Mexico, 2016)
Factor loading higher than 0.5 are marked in bold numbers
Internal consistency was evaluated using Cronbach alpha coefficients, resulting in an alpha of 0.943 for the attitude items, and 0.918 for the usage items; these coefficients are indicative of a very good internal consistency of these measures.
The longitudinal stability of the measure was evaluated through a test-retest procedure using data from the student subsample. Subjects answered the retest questionnaire five days after they had answered the initial questionnaire. The test-retest correlation coefficients were significant for the three dimensions -attitude (r = .837), usage (r = .858), and comprehension (r = .602)-, suggesting good temporal stability of the measures (figure 1).

We also employed confirmatory factor analysis to test convergent and divergent validity. Using the three criteria established by Fornell and Larcker,46 we calculated R2, average variance extracted (AVE), and construct reliability (CR) measures. As shown in table II, the AVE and CR coefficients are above 0.5 and 0.7, respectively. Therefore, we conclude that the attitude and use dimensions have convergent validity.
Table II Attitude and use dimensions convergent validity for the pooled sample of adults and students
| Variable | Item | Std Estimate | R2 | I-R2 | AVE | CR | ||||||
| Attitude | ACT1 | 0.901 | 0.812 | 0.188 | 0682 | 0.944 | ||||||
| ACT2 | 0.906 | 0.821 | 0.179 | |||||||||
| ACT3 | 0.873 | 0.762 | 0.238 | |||||||||
| ACT4 | 0.725 | 0.526 | 0.474 | |||||||||
| ACT5 | 0.868 | 0.753 | 0.247 | |||||||||
| ACT6 | 0.883 | 0.780 | 0.220 | |||||||||
| ACT7 | 0.746 | 0.557 | 0.443 | |||||||||
| ACT8 | 0.667 | 0.445 | 0.555 | |||||||||
| Use | USO7 | 0.771 | 0.594 | 0.406 | 0.660 | 0.920 | ||||||
| USO5 | 0.864 | 0.746 | 0.254 | |||||||||
| USO4 | 0.716 | 0.513 | 0.487 | |||||||||
| USO3 | 0.767 | 0.588 | 0.412 | |||||||||
| USO2 | 0.891 | 0.794 | 0.206 | |||||||||
| USO1 | 0.851 | 0.724 | 0.276 |
Note: Estimated by the authors based on the information of the quantitative phase (Mexico, 2016)
The divergent validity for attitude and use was calculated using Anderson’s and Gerbing’s criteria.47 The tests show that both dimensions represent different constructs (χ2=22.6, p=0.000). Divergent validity was also tested through the ad-hoc criterion. The squared correlation coefficient between attitude and use was 0.603, which is smaller than the 0.660 AVE coefficient of the usage construct. Thus, it can be concluded that these dimensions have divergent validity.
Regarding comprehension, the item difficulty index (p), or the proportion of respondents who answered the item correctly, was used to assess difficulty.48 The p-indices ranged between .38 and .98. It has been suggested that items should have p-indices between .2 and .8.49 Since the education level of our sample was higher than the mean education level of the general population, following Parmenter and Wardle,41 we adjusted these indices slightly upward. Items were considered for elimination if over 90% or under 30% answered them correctly. No item scored below .30, but three items had a p-index of over .90.
The point biserial correlation index was used to assess the ability of an item to differentiate between those with a better understanding and those with a lower level of comprehension.48 Item discrimination can be interpreted as a measure of consistency of the respondents’ performance on individual items and their overall score.50 The item-to-total score correlations were between .10 and .32. Items with discrimination indices below .20 were considered for elimination.49
In order to determine which items would need to be eliminated from the instrument, we considered difficulty and discrimination indices. Two items in the comprehension section scored low on both difficulty and discrimination, and were therefore eliminated from the final version of the instrument.
Finally, internal consistency for this section was assessed using the Kuder-Richardson internal consistency reliability index (KR-20). The KR-20 is appropriate for dichotomic data. The KR-20 of this section was .60. Carey50 suggests that values below .50 should be questioned.
Thus, the final version of the instrument contains 25 items divided into three sections: eight items for evaluating the consumers’ attitude towards nutrition labels, six items to assess consumers’ use of labels, and 11 items for assessing the consumers’ comprehension of nutrition label information. The final version of the instrument is shown in table III and table IV.
Table III Attitude and Use items of the Nutritional Labels Scale
| 1.Attitude items | 2.USe items | |
| I am interested in reading nutrition labels | I read nutrition labels of products | |
| Nutrition labels are important for when i shop for food | i read nutrition label of products before i buy them | |
| I am more interested in checking the nutrition labels of new products | I read the nutrition labels on products before consuming them | |
| I am more interested in in checking the nutrition label of product i buy more often | I read nutrition label... | |
| The information i get from nutrition labels is valuable to me | I read nutrition label of products the first time i buy them | |
| It is important for me to obtain information from nutrition labels | I use the information on nutrition labels to compare products of different brands | |
| I pay attention to whether a product has a nutrition label | ||
| I prefer to buy a product that has a nutrition label | ||
| Responses were collected on a seven-point scale, with the extremes being 1=Strongly Disagree and 7=Strongly Agree. 8=Do not remember | Responses were collected on a seven-point scale, with the extremes being, 1=Always and 7=Never |
Table IV Comprehension items of the Nutritional Label Scale
| 1. Wich of the following is included in nutrition labels? | ||||
| • Artificial flavors | ||||
| • Preservatives | ||||
| • Fiber | ||||
| • Ingredients | ||||
| 2. If a product has no fat, it means that it is good for my health. | ||||
| • False | ||||
| • True | ||||
| • I don’t know | ||||
| Product 1 | Product 2 | Product 3 | ||
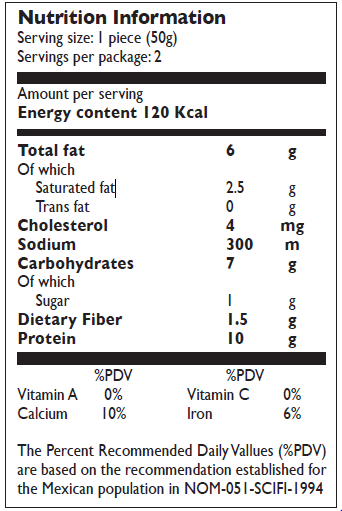
|

|

|
||
| 3. Look at the label. How many grams of fat are there in half a package? | 5. If 300g of carbohydrates is the recommended daily amount for a 2 000 calories diet, this product has a: | 10. Look at the label. If you ate three servings of this product a day, of which of these nutrients would you consume more than the recommended amount? | ||
| • 14g | • Low sugar content | • Fiber | ||
| • 8g | • Medium sugar content | • Carbohydrates | ||
| • 4g | • High sugar content | • Cholesterol | ||
| • 17g | • I don’t know | • Sodium | ||
| 4. If 65g of total fat is the recommended daily amount for a 2 000 calories diet, this product has a: | 11. Look at the label. If you ate three servings of this product a day, of which nutrients would you need to get more from other foods in order to get the recommended daily amount? | |||
| • Low fat content | • Saturated fat | |||
| • Medium fat content | • Protein | |||
| • High fat content | • Vitamin A | |||
| • I don’t know | • Iron | |||
| 6. If 25g of fiber is the recommended daily amount for a 2 000 calories diet, this product has a: | ||||
| • Low fiber content | ||||
| • Medium fiber content | ||||
| • High fiber content | ||||
| • I don’t know | ||||
| 7. Looking at the labels of products 1 and 2, which product has less saturated fat? | ||||
| • Product 1 | ||||
| • Product 2 | ||||
| • No difference | ||||
| • I don’t know | ||||
| 8. Which product would be the best option for someone trying to lose weight? | ||||
| • Product 1 | ||||
| • Product 2 | ||||
| • No difference | ||||
| • I don’t know | ||||
| 9. Which product would be the best option for someone trying to reduce their risk of high blood pressure by lowering their sodium intake? | ||||
| • Product 1 | ||||
| • Product 2 | ||||
| • No difference | ||||
| • I don’t know | ||||
Discussion
The purpose of this study was to develop and validate a measure of consumer use of nutritional labels on packaged products for Spanish speaking consumers. The results of the statistical analyses performed suggest that the final instrument is a reliable and valid measure that can be useful in the systematic study of nutrition labelling issues. To our knowledge, this is the first attempt to develop and validate an instrument to measure consumers’ use, comprehension and attitudes towards nutrition labels outside high-income countries.
In addition to being a valid and reliable measure, the instrument presented in this paper is particularly appealing due to its length and structure. It is relatively short, which makes it an attractive measure to be included in studies of nutrition information measuring multiple variables, and its modular design allows researchers to use the complete instrument or each of the three scales independently. The three sections of the instrument exhibit good psychometric characteristics.
The scale developed in this paper presents some advantages compared to possible alternatives. For example, the Spanish version of the Nutrition Literacy Scale (NLS) used in studies with Latinos11 comes from a translation from the original English Anglo-Saxon scale, and it focuses on nutrition knowledge. The scales employed by De Magistris and colleagues16, and by Barreiro and colleagues15, covered label use and knowledge, but with only three general items for each of these dimensions. Finally, the scale of Gonzalez-Roa & Calatrava-Requena14 covers nutrition knowledge in detail with nine items, but does not include attitude or use. In contrast to these few attempts, our scale is developed from qualitative inquiry and from a quantitative study with Spanish speaking population, and it covers all three dimensions of attitude, use and comprehension in detail, with eight, six, and eleven items.
Although limitations still remain, covering all nutrients in the comprehension questions would require an extremely large questionnaire that would produce carryover biases in the answers. Therefore, certain micronutrients, such a vitamin A, calcium and others, had to be excluded. It is likely that these omissions had little impact on the results. Following previous research, we operationalized and measured nutrition knowledge as performance in nutrition label tasks.26,34,24 Since these operations are not nutrient-specific, consumers who are able to perform a task with one nutrient should be able to perform the same task with another nutrient, minimizing the potential impact of using only one micronutrient in the scale. However, an interesting avenue of research in the future could be to confirm the generalizability of nutrition tasks across nutrients.
In addition, the scale was tested with an online survey, which may result in other problems, such as answering with help from others or from the internet, or self-selection biases. That is, the actual respondents of the survey may differ in some key attributes (e.g. nutritional knowledge) from those who filled it, and there may be an overrepresentation of subjects with higher education. These conditions may lead us to overestimate our results regarding the incidence of use and knowledge of nutrition labels. These problems call for a larger project with face-to-face interviews and random sampling in representative populations.
As previous studies suggest, social desirability bias should be considered when studying consumer use of nutrition labels. For this reason, we conducted a post hoc analysis using the short form version of the Balanced Inventory of Desirable Responding in Spanish51, which indicated low but significant correlations between social desirability and the attitude and use dimensions of the scale (a = 0.68; rSocDes-Attitude = .21; rSocDes-Use = .21). This suggests that social desirability probably had a minor impact on our results. Still, future research may focus on different data collection methods than the one chosen in this study to explore alternatives for reducing social desirability bias, for example: complementing information gathered by our instrument with experiments in which researchers observe how consumers behave at the point of purchase.
In practice, government organizations and agencies in charge of regulating labelling information regulations can benefit from the use of this instrument. For instance, any attempt to make nutritional labels more appealing to use and easy to read might employ this nutritional scale in between experiments across the considered alternative labels. Additionally, the scale might be employed to measure the impact on consumers’ attitudes, use and comprehension of interventions designed to help them follow a healthier diet, such as nutrition courses, or official websites that provide nutrition tips for everyone and for specific categories of consumers.

