


 nova página do texto(beta)
 Inglês (pdf)
 Artigo em XML
 Referências do artigo
 Enviar este artigo por email
 Citado por SciELO
  Similares em
SciELO
Similares em
SciELO 
 Permalink
Nutritional epidemiology research has traditionally adopted a reductionist approach1,2 focusing on relationships between individual nutrients or foods and disease.3 However, that approach has some important limitations. It fails to account for interactions among nutrients3,4 and cannot explain the synergistic effects of recognized or unrecognized constituents of daily food consumption.3,5,6 Further, intercorrelation between some nutrients makes it complicated to evaluate their effects independently.4 Finally, single nutrient assessment may be confounded by the effect of dietary patterns, with which consumption of specific nutrients is normally associated.7,8 Thus, dietary pattern analysis has been proposed to account for the cumulative and complex effects of simultaneous consumption of multiple nutrients or foods on a daily basis,4,9,10 and to understand the role whole diets play in disease occurrence.11,12
Dietary patterns can be assessed with different statistical techniques: a priori techniques using score-based approaches, like the Mediterranean diet score or healthy eating index,13,14 or a posteriori methods; implemented with data-driven techniques such as factor analysis, cluster analysis, or, more recently, reduced rank regression.3,9,15,16 Factor analysis, a data reduction method which creates linear combinations of foods or food groups to identify the principal factors behind the largest variation in food consumption, is one of the most commonly used of these a posteriori techniques. Factors can be rotated (usually orthogonally) to enhance interpretability, and factor scores are computed for each individual.10,17
Assessment of dietary patterns by factor analysis involves subjective judgment in classification of food items, determination of the number of factors to retain, method of rotation, and labeling of dietary patterns.18 Furthermore, dietary patterns may vary across populations with respect to food availability, socioeconomic status, resident area, ethnic group, and culture. For those reasons, it is useful to evaluate the validity of the food frequency questionnaire (FFQ) for assessing identification of dietary patterns in a particular study population.7
While studies have evaluated the reproducibility and validity of dietary patterns in various adult populations,6,7,19-21 the validity of a semi-quantitative food frequency questionnaire (SFFQ) to derive dietary patterns in the Mexican population has not been evaluated. Therefore, we assessed the relative validity of a semi-quantitative food frequency questionnaire to identify dietary patterns in an adult Mexican population.
Materials and methods
Design and study population
The present analysis was done with data from the Mexican National Health and Nutrition Survey 2012 (Ensanut 2012, for its acronym in Spanish). The Ensanut 2012 is a probabilistic population-based survey with multi-stage stratified sampling, designed to be representative of the nation, its three main regions (North, Center, and South), and rural and urban areas. The survey design and sampling procedures have been described in detail previously.22 Briefly, the Ensanut 2012 aims to monitor health and nutrition conditions, health program coverage, and access to health services. The survey obtained information from 50 528 households, with a response rate of 87%; 46 303 interviews with adults (≥ 20 y) were conducted. We include information from a subsample of adults aged ≥ 20 y, randomly selected for a validity study of the semi-quantitative food frequency questionnaire (SFFQ) used in the Ensanut 2012. The present analysis used data from 264 adults who completed one SFFQ and two 24-hour dietary recalls (24DRs). Participants with outlier energy intake values (n=21) were eliminated using the standard deviation method suggested by Rosner.23 Consequently, our final analysis included 243 participants (148 women and 95 men). This study was managed according to Declaration of Helsinki guidelines, and written informed consent was obtained from all participants. Research Ethics Committee at the National Institute of Public Health (INSP, for its acronym in Spanish) approved the study protocol (Number 13CEI1700736).
The semi-quantitative food frequency questionnaire
The SFFQ used in the Ensanut 2012 is an adapted version of the questionnaire employed in the Ensanut 2006.24 This questionnaire includes consumption of 140 foods during seven days prior to the date of the interview. Frequency of food items could be characterised by set categories ranging from never to six times a day. Participants also designated the portion size of the food items ingested, using predefined categories. These data were converted to portions per day. To calculate the consumption of energy (kcal/day), the daily frequency of consumption (portions/day) of each food was multiplied by the food's energy content (using the food composition tables compiled by the INSP)25 and the contributions of all foods were totaled using Microsoft Visual FoxPro 7.0. The SFFQ was managed by personnel trained in standardized data collection and entry procedures.
24-hour dietary recall
Participants in the validity study completed two 24DRs 2 days apart, distributed over all days of the week, with approximately 50% of them obtained in weekend days. Personnel trained in standardized methods collected all the required information through face-to-face interviews, using 24DR automated multiple pass method (24DR-AMPM) software originally developed by the US Department of Agriculture and adapted (24DR-AMPM software version 1.0) by a group of INSP researchers to the Mexican population.26 For each 24DR, participants were asked about their food consumption during the previous day in detail. In brief, at the beginning of the interview, participants listed the food items they had consumed during the previous day, with prompts from the interviewer about different possible eating occasions. A list of foods that are often forgotten was also used to elicit recall. Subsequently, detailed information on each food item was collected (including brand name, recipe, preparation method, time, occasion and amount eaten). Following data collection, we matched the 552 unique food reported in the 24DRs to food items in the SFFQ to ensure that the food intakes quantified by each were comparable.
Food grouping
The energy intake from each food was converted to percentage of total energy intake per day and standardized by Z-score.27 Foods and beverages from the FFQ and the 24DRs were categorized into 29 food groups (Table I) used to derive dietary patterns via factor analysis of principal components. Details of the food groupings used to derive the dietary patterns are described elsewhere.28,29 Briefly, as explained in Denova and colleagues,28 the basis for placing a food item in a certain food group was the similarity of nutrients. Some groups were defined according to the amount of sugar added (e.g. sweetened beverages). Other groups were defined according to their lipid profile (e.g. seeds). Finally, some food items were considered individually as a food group, because their nutrient profiles were unique, they were consumed especially frequently, or they had unique culinary use (e.g. tortillas, eggs, and orange juice).

To derive dietary patterns and to determine factor loadings for each of the 29 groups, a factor analysis of the main components was performed.30 The factors were orthogonally rotated (varimax rotation) to keep them uncorrelated and to improve their interpretation. Factors above with Eigenvalues >1.5 were retained after graphic analysis, including scree plots31 and consideration of interpretability. Each factor was defined by a subset of at least five food groups with absolute loadings ≥0.2.27-29 Factor scores for each dietary pattern were estimated by adding the consumption of the food groups weighted by their loading, and each participant received a factor score for each identified dietary pattern.
Other participant characteristics
Sociodemographic characteristics (age, sex and socioeconomic status) were obtained with predefined questionnaires. Localities with less than 2 500 residents were considered rural, and areas with 2 500 or more residents were considered urban. A household wealth index (HWI) was created using principal components analysis with household characteristics and family assets. This index was divided into tertiles, with 1 being the lowest category.
Anthropometric measures (weight and height) were collected with validated and standardized methods.32 Body weight was measured with a previously calibrated electronic scale, with participants wearing minimal clothing and no shoes. Height was measured with a stadiometer with barefoot participants standing with their shoulders in a normal position; measurements were taken with the tape in a horizontal plane perpendicular to the vertical scale, touching the top of the head at the moment of inspiration. Body mass index (BMI) was computed as a ratio of weight in kilograms divided by the height in meters squared. The definition for normal weight was BMI ≥ 18.5 and < 25.0, participants with BMI ≥ 25.0 - < 30.0 were classified as overweight, and those with a BMI ≥ 30.0 were categorized as obese.
Statistical analysis
We performed descriptive analysis of the main characteristics of interest by sex. Mean daily intakes, in g/day, of the 29 food groups determined from the SFFQ and from the average of the two 24DRs, were calculated. We assessed intraclass correlation coefficients (ICC) comparing daily intakes between SFFQ and an average of two 24DRs of the food groups. Pearson correlation coefficients were also used to evaluate the validity of dietary patterns derived from dietary data collected with the SFFQ and the two 24DRs. To reduce within-person variation in food intake obtained from the 24DRs, we conducted factor analysis using the average consumption for each food group across the two days.
All statistical analyses were performed with STATA statistical software version 13.0. A value of p <0.05 was considered to be statistically significant.
Results
This analysis included data from a sample of 243 adults older than 20 years. Of these participants, 61% were women and 39% men. The majority of women (71.4%) were between 20 and 49 years old, 39.8% lived in central Mexico, and approximately 80% were overweight/ obese. Of the men, 54.2% lived in urban areas, 61.7% were between 20 and 49 years of age, and 70.6% were overweight or obese (Table II).
Table II Distribution of characteristics of interest in the validation sample data from the Mexican National Health and Nutrition Survey of 2012. Mexico, Ensanut 2012
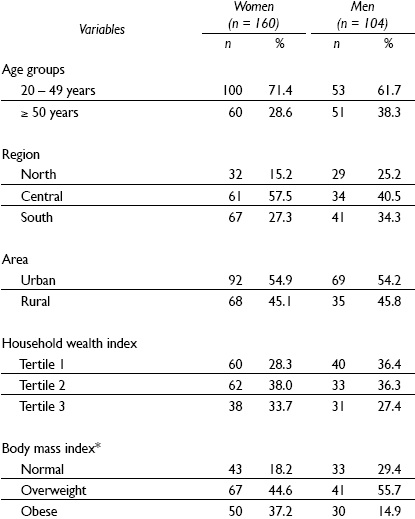
* Body mass index: Normal (< 25.0 kg/m2), overweight (≥ 25 kg/m2 - < 30.0 kg/m2), obese (≥ 30.0 kg/m2)
Factor analysis identified three major dietary patterns that we termed "pattern 1", "pattern 2" and "pattern 3." These dietary patterns accounted for approximately 20% of the total variance; 20.4% in the SFFQ and 19.5% in the 24DRs. The greater the loading of a given food or food group to the factor, the higher the contribution of that food or food group to that specific factor.7 Pattern 1, which reflected correlated intakes of foods commonly considered to be unhealthy, was loaded heavily with snacks, fast food, soft drinks, processed meat and refined grains. Pattern 2 emphasized consumption of fresh vegetables, fresh fruit, and high fat dairy products. Finally, legumes, eggs and sweetened foods and sugars contributed heavily to pattern 3. In general, the first two dietary patterns derived from the SFFQ and the 24DRs were similar. However, the third pattern was less consistent across the two sources of data. Of the 29 food groups examined with the SFFQ and the two 24DRs, eight were identified as significant contributors for the dietary pattern 1, with six of them positively associated and two inversely associated. Of these, only five food groups (corn tortilla, snacks, fast foods, soft drinks, and sweetened foods and sugars) were similar when comparing pattern 1 derived with both instruments. The dietary pattern 2 originated from the SFFQ had nine food groups, while the dietary pattern 2 derived with the two 24DRs has ten. Of them, food groups that positively matched were whole grains, fresh vegetables, fresh fruits, red meat, and high fat dairy products; whereas, soft drinks matched but negatively. Lastly, for the third dietary pattern, four out of the seven and eight food groups derived with the SFFQ and the two 24DRs respectively, were similar (eggs, legumes, sweetened foods and sugars, and tea and coffee) (Table III).
Table III Factor loading matrix for the three major dietary patterns identified from the SFFQ and the average of two 24DRs. Mexico, Ensanut 2012
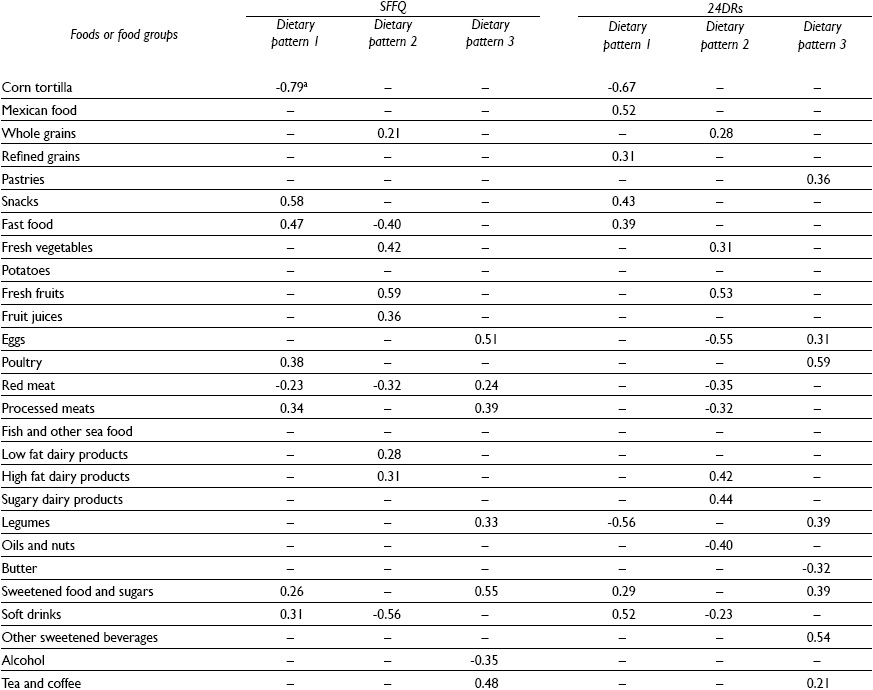
a Absolute values <0.20 were excluded for simplicity
Mean daily consumption of foods or food groups (g/day) was overestimated by the SFFQ compared with the 24DRs (considered the gold standard) for corn tortilla, fast food, fresh vegetables, fresh fruit, fruit juice, fish and other sea food, soft drinks and low calorie drinks. In contrast, Mexican foods, refined grains, potatoes, red meat, processed meat, legumes and sugary dairy products appeared to be underestimated by the SFFQ. The energy-adjusted ICCs between SFFQ and the average of the 24DRs were calculated to assess the relative validity of the SFFQ (Table IV). Most foods or food groups were moderately correlated. The energy adjusted ICCs ranged between 0.08 (low energy drinks) to 0.64 (soft drinks). In particular, intakes of corn tortilla, pastries, fruit juices, and soft drinks showed high (>0.50) intraclass correlation coefficients. Whereas, whole grains, fresh vegetables, poultry, low-energy drinks, oils and nuts presented low (<0.20) ICCs.
Table IV Daily mean intakes and energy-adjusted intraclass correlation coefficients For Food group intakes, estimated by the SFFQ and the average of two 24DRs in the National Health and Nutrition Survey 2012. Mexico, Ensanut 2012
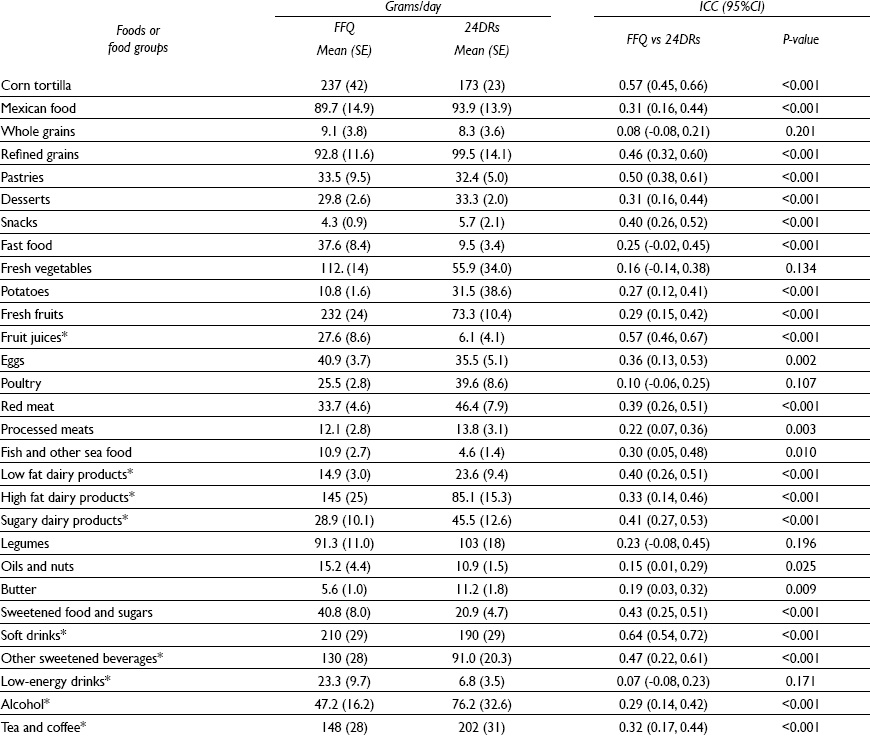
* Intakes are presented in mL/day
ICC: energy-adjusted Intraclass correlation coefficients
The correlation between the SFFQ and the 24DRs was 0.66 (p <0.001) for dietary pattern 1 and 0.41 (p <0.001) for pattern 2. However, the correlation for dietary pattern 3 was less consistent and not statistically significant (r = 0.29; p = 0.19) (data not shown).
Discussion
There has recently been increased interest in dietary pattern analysis as a method to examine diet-disease relationships, as this approach offers several advantages over single nutrient or food methodologies.17 Dietary patterns represent a combination of nutrients or foods and other dietary components that can reflect the eating habits of the population. Few epidemiological studies, however, have evaluated the validity of dietary patterns.6,7,19-21 The aim of the present work was to evaluate relative validity of a semi-quantitative food frequency questionnaire compared to 24DRs to identify dietary patterns in an adult Mexican population. We derived three major dietary patterns in this study of the adult Mexican population, which were qualitatively similar across the two sources of dietary data. However, the patterns derived from the SFFQ and 24DRs did differ in some aspects, possibly because of methodological dissimilarities between the two dietary assessment methods33 and random statistical variation. However, the correlation coefficients for patterns between the SFFQ and the 24DRs ranged from 0.29 to 0.66, suggesting reasonable comparability across the two methods in typifying dietary patterns, and supporting the utility of the SFFQ in assessing dietary patterns.
The dietary patterns derived in the present analysis are similar to patterns identified in other studies using factor analysis methodology to dietary data from different populations. Such studies have found vegetable rich patterns, similar to our pattern 2, generally labeled as "healthy" or "prudent",7,19,21,34 and "western" patterns resembling those in our dietary patterns 1 and 3.7,19 For example, in the Health Professionals Follow-up Study, Hu and colleagues7 evaluated the reproducibility and validity of dietary patterns using dietary data collected by SFFQ and dietary records. In that study, "prudent" and "western" dietary patterns were identified. The correlation coefficients in the validity analysis between each of the patterns based on SFFQ and dietary records were 0.45-0.74, comparable with the correlation coefficients that we observed (0.41 - 0.66). A similar analysis of data from the Swedish Cohort Study19 identified three dietary patterns, including "healthy" and "western" patterns similar to our patterns 2 and 1. The correlation coefficients between the patterns derived from SFFQ and dietary records in that study were 0.50-0.59.
We observed that factor loadings for patterns from the 24DRs were more weakly correlated with factor loadings from the SFFQ than factor scores overall. This most likely reveals methodological differences between the FFQ and 24DRs. The SFFQ asks for information on usual dietary intake, in our case during the past seven days, whereas the 24DRs measures food consumed the previous day, and therefore includes a smaller range of foods than are likely to be reported by SFFQ. Additionally, as factor solutions are influenced by the correlation matrix, some discrepancies may be expected between factor loading matrixes from different dietary assessment methodologies.
There are some limitations in our study. First, dietary pattern analysis should be interpreted with caution because, although at least two major patterns ("healthy" or "prudent" and "unhealthy or "western") have commonly emerged in different populations,7,19,28,29,34 their specific composition depends on geographical, cultural, socioeconomic and ethnic status, and is influenced by methodological variation (including sampling, food grouping, number of variables used in factor analysis, number of factors and the rotation employed). Further, the three major dietary patterns identified in our study explained only 20.4% of the total variance in the SFFQ and 19.5% in the 24DRs, suggesting the existence of other eating pattern dimensions, although remaining patterns were less interpretable in our analysis. Dietary patterns aside from the "western" and "prudent", have been shown to be highly variable across various dietary assessment methods, and may not be reproducible across populations.7 In the present study, two 24DRs were used as comparison method; therefore, the estimate of intake may have been closer to true intake if we had collected more days of food consumption. However, other findings suggested the possibility of using only a small number of replicate measures for the reference method combined with a statistical adjustment to remove the effects of within-person variation.35 At this respect, some authors have proposed that the greatest statistical efficiency is obtained with only two, and at the most five, duplicates per subject.36,37 In this context, to validate our SFFQ against two 24DRs seems to be adequate. Furthermore, in order to account for the week and weekend day variation, approximately 50% of the 24DRs were obtained in weekend days. Finally, measurement errors may have occurred. Although the 24DR is the current gold standard for evaluating food consumption, it is nevertheless susceptible to measurement error due to inaccurate recording.33 In addition, as we did not administer a second SFFQ in the validity study, we cannot assess the reproducibility of the instrument. Future work needs to be done to evaluate the reproducibility of this SFFQ.
In conclusion, our data indicate reasonable validity of the SFFQ, using factor analysis, to derive major dietary patterns in comparison with two 24DR. These results suggest the potential use of SFFQ using factor analysis-based dietary pattern identification in epidemiological studies as an alternative dietary assessment method suitable for studying diet-disease relationships.

