


 nueva página del texto (beta)
 Inglés (pdf)
 Artículo en XML
 Referencias del artículo
 Enviar artículo por email
 Citado por SciELO
  Similares en
SciELO
Similares en
SciELO 
 Permalink
Prostate cancer (CP) is the second most common type of cancer in men (31.6 cases per 100 000 men) and represents the 5th highest cause of cancer-related death worldwide (7.8 deaths per 100 000 men), with large between-country differences.1 In more developed countries, the incidence of PC is 5 times greater than that observed in less developed countries. However, the associated mortality is only 1.5 times greater.2
The observed differences by country in PC incidence according to the level of development can be partially explained by the use of the prostate-specific antigen (PSA) and other screening tests, which allows more cases to be detected, including an over-diagnosis of indolent cases.3 However, there is no evidence that PSA alone or combined with other tests has had a significant effect on associated mortality.3,4 The factor that is considered to be related to a lower mortality in developed countries is timely diagnosis and treatment access. This factor could explain the fact that a 5-year survival in developed countries is almost 100%, whereas in developing countries is only 40%.5
Within countries in the Americas, Mexico presents one of the lowest PC incidences (27.3 cases per 100 000 men) and mortality rates (11.3 deaths per 100 000 men). However, PC is the leading cause of cancer-related morbidity and mortality nationwide, and it occurs principally among men aged 50 to 74 years.1 According to histological classifications at the time of diagnosis, a high proportion (~80%) of cases at the time of diagnosis are classified as aggressive and have a poor prognosis (Gleason≥7).6,7 With regard to mortality, the few studies that exist report a significant increase between the 1970s and the 1990s,8,9 followed by a constant 2% annual increase.10
At least seven socioeconomic regions have been identified in Mexico based on geography, economic activities and other social well-being indicators.11,12 From a health standpoint, this regional distribution could be associated with differences in the timeliness of diagnostic and treatment services. As such, the objective of this analysis was to determine trends in PC mortality using the state marginalization index as a proxy for the timeliness of diagnostic and treatment services in Mexico from 1980 to 2013.
Materials and methods
Trends in PC mortality in Mexico from 1980 to 2013 were evaluated using the national death certificate database. This database is validated by the National Statistics and Geography Institute (Instituto Nacional de Estadística y Geografía, INEGI) and is available on the SSa's National Health Information System (Sistema Nacional de Información en Salud) webpage.13 Deaths from PC between 1980 and 1997 were identified as those that were registered with the code 185 from the ninth revision of the International Classification of Diseases (ICD-IX).14 For subsequent years, the code C-61, corresponding to the tenth revision (ICD-X), was used.15 To evaluate the quality of the registry throughout the study, malignant cancer deaths from poorly defined and unspecified sites were also analyzed (ICD-IX: 195, 199 and 239 and ICD-X: C80 and C76).
PC mortality rates were estimated using 5-year age groups from the male population midway through the year of each year under study as a denominator, according to the national and state population projections available on the 2013 National Population Census (Consejo Nacional de Población, Conapo) webpage.16 Deaths and the population at risk were restricted to individuals 40 years and older. PC mortality rates were Age-adjusted using direct standardization17 based on the age distribution of the male population ≥40 years old from the 2010 national census.16
According to the Conapo 2010 state marginalization index,18 the 32 official states of residence in Mexico were grouped into 5 different regions as follows: very high marginalization - Chiapas, Guerrero and Oaxaca; high marginalization - Campeche, Hidalgo, Michoacán, Puebla, San Luis Potosí, Tabasco, Veracruz and Yucatán; medium marginalization - Durango, Guanajuato, Morelos, Nayarit, Querétaro, Quintana Roo, Sinaloa, Tlaxcala and Zacatecas; low marginalization - Aguascalientes, Baja California Sur, Colima, Chihuahua, Jalisco, México, Sonora and Tamaulipas; and very low marginalization - Baja California, Coahuila, Distrito Federal and Nuevo León.
The national and state PC trends in mortality were analyzed according to 5-calendar year intervals from 1980 to 2013. Finally, to determine the significant changes in PC mortality over time (increase or decrease), the annual percent change (APC) was obtained using a joinpoint analysis.19 It was assumed that the age-adjusted mortality rates followed a Poisson distribution, and a p-level of <0.05 was considered statistically significant. To estimate age-period-cohort effects, a Poisson regression model proposed by Holford was used20 that was founded on curvature and deviations from linearity.
The analysis was performed with the Joinpoint Regression Program 4.0.4-May 201321 and the R program (R Development Core Team 2007).
Results
From 1980 to 2013, 114 616 PC deaths were identified, with a mean age at the time of death of 76.5 ± 10 years. From 1980 to present, there was a mean increase of ~3 years of age at death, independent of the level of marginalization (p <0.05) (data not shown in tables).
The risk of dying from PC during the study period was 16.0 deaths per 10 000 men 40 years or older. The states with the highest 5-year mortality rates throughout the period were Sonora, Baja California Sur and Sinaloa. However, for the period of 2005-2009, the highest risk of death from PC was observed in Nayarit and Jalisco with a rate of 24 deaths per 10 000 men 40 years or older. Chiapas, Guerrero and Oaxaca were the states that presented the lowest 5-year PC mortality rates during the period of 1980-1984, but they also showed an increase in PC mortality throughout the period (table I).
Table 1 Age adjusted prostate cancer mortality rates (per 10 000 men ≥ 40 years old) at national level and according to marginalization index of residence state. Mexico, 1980 to 2013
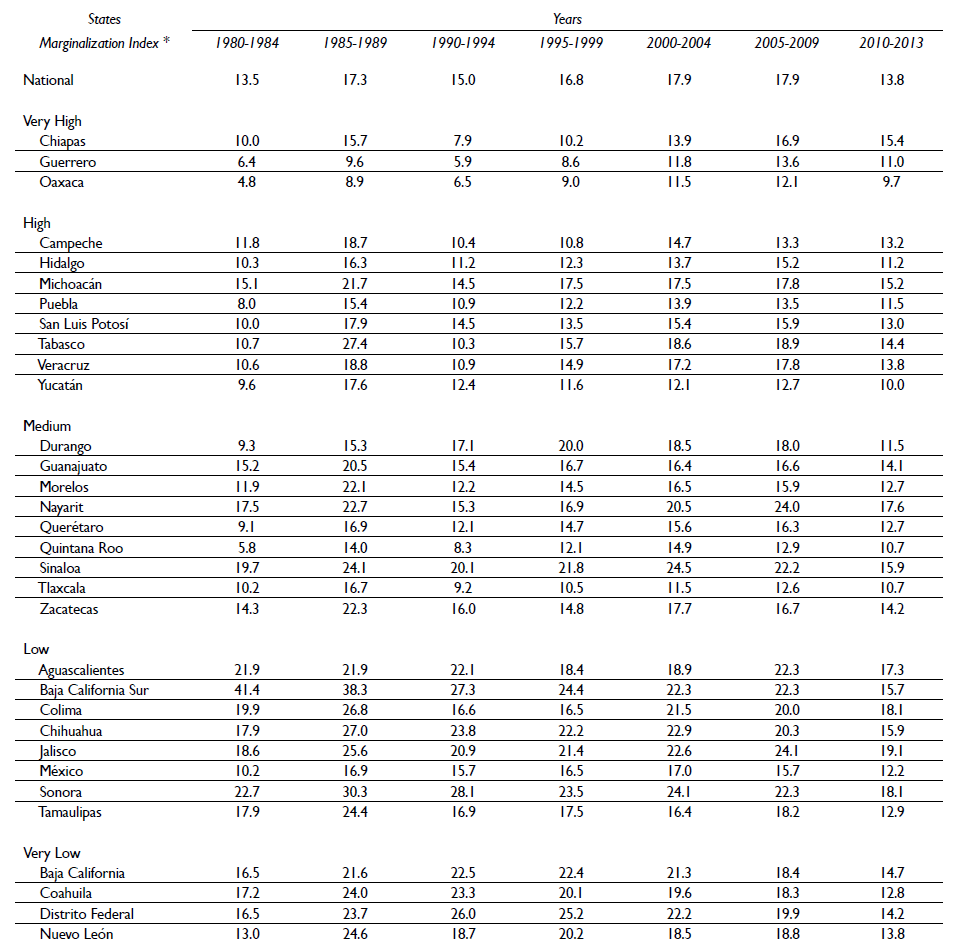
* Marginalization index, (Conapo, 2010)
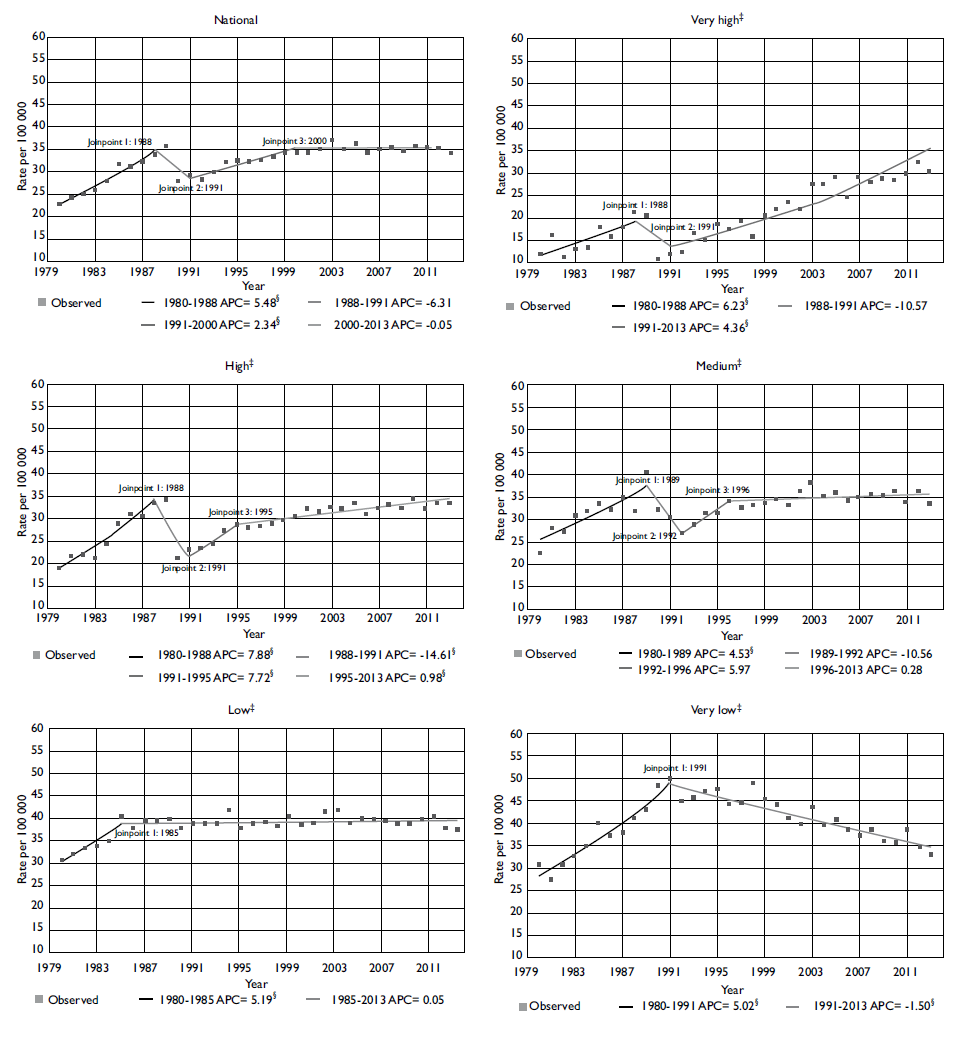
There was an increasing trend in PC mortality nationally with two significant changes observed. First, there was a 5.5% annual increase between 1980 and 1988; second, there was a 2.3% annual increase between 1991 and 2000, and this did not change significantly over the last 13 years. During the 1980's, all of the marginalization strata presented a change similar to that observed nationwide. However, the highest increase was observed in states with very high (6.2%) and high marginalization (7.9%). At the end of the 1980's and the beginning of the 1990's, a decreasing trend was observed in all of the regions. However, this reduction was significant only in very low marginalization states (-1.5%) and remained constant throughout the period. Between 1988 and 1991, the high marginalization states showed a significant reduction in PC mortality on a scale of 14.6% per year. However, beginning in 1991, a significant annual increase of 7.7% was observed. PC mortality also increased in high marginalization states, but the magnitude of the change was less (4.4%) (table II; figure 1).
Table II Joinpoint analysis for prostate cancer mortality (per 100 000 men ≥ 40 years old) at national level and by marginalization index of residence state. Mexico, 1980 to 2013

* Average annual percent change (APC) significantly different from 0 (p ≤ 0.05)
‡ Marginalization index (Conapo, 2010). Very high: Chiapas, Guerrero, Oaxaca. High: Campeche, Hidalgo, Michoacán, Puebla, San Luis Potosí, Tabasco, Veracruz, Yucatán. Medium: Durango, Guanajuato, Morelos, Nayarit, Querétaro, Quintana Roo, Sinaloa, Tlaxcala, Zacatecas. Low: Aguascalientes, Baja California Sur, Colima, Chihuahua, Jalisco, México, Sonora, Tamaulipas. Very low: Baja California, Coahuila, Distrito Federal, Nuevo León.
* Rates per 100 000 men ≥40 years old.
‡ Marginalization index (Conapo, 2010). Very high: Chiapas, Guerrero, Oaxaca. High: Campeche, Hidalgo, Michoacán, Puebla, San Luis Potosí, Tabasco, Veracruz, Yucatán. Medium: Durango, Guanajuato, Morelos, Nayarit, Querétaro, Quintana Roo, Sinaloa, Tlaxcala, Zacatecas. Low: Aguascalientes, Baja California Sur, Colima, Chihuahua, Jalisco, México, Sonora, Tamaulipas. Very low: Baja California, Coahuila, Distrito Federal, Nuevo León.
§ p<0.05
Figure I Joinpoint analysis for prostate cancer mortality* (per 100 000 men) at national level and by marginalization index. Mexico, 1980 to 2013
The increase in the risk of dying from PC associated with an increase in age was similar in all marginalization strata, independent of the cohort and the period (figure 2-A). Nationally, the cohorts that suffered from the principle changes in PC mortality were the 1945-1950 birth year cohorts. Compared to the 1920 birth year cohort, the cohorts of men born during 1945-1950 presented a two-time greater risk of dying from this cause without any marked changes according to the level of marginalization, except for the very low marginalization states, in which these same cohorts presented only half the risk (figure 2-B). The later cohorts remained more or less constant.

* Rates per 100 000 men ≥ 40 years old.
‡ Marginalization index (Conapo, 2010). Very high: Chiapas, Guerrero, Oaxaca. High: Campeche, Hidalgo, Michoacán, Puebla, San Luis Potosí, Tabasco, Veracruz, Yucatán. Medium: Durango, Guanajuato, Morelos, Nayarit, Querétaro, Quintana Roo, Sinaloa, Tlaxcala, Zacatecas. Low: Aguascalientes, Baja California Sur, Colima, Chihuahua, Jalisco, México, Sonora, Tamaulipas. Very low: Baja California, Coahuila, Distrito Federal, Nuevo León.
Figure 2 Age (A), cohort (B) and period effect (C) of prostate cancer mortality* at national level and according to Marginalization index of residence state.‡ Mexico, 1980 to 2013
Mortality trends over these years were similar in all strata of marginalization except in the very high marginalization strata in which a significant increase in PC mortality was observed beginning in 1995. Consequently, the mortality for 2013 was two times greater than that observed in 1995 (figure 2-C).
Discussion
Independent of the state marginalization level, the mean age at the time of PC death increased by approximately three years over the study period. Meanwhile, the PC mortality trend in Mexico showed a sustained increase of 2.3% annually, which was more evident in the states with high and very high marginalization, whereas a decreasing trend was observed in the very low marginalization states.
The trend of increasing PC mortality observed in this study is consistent with what has been observed in countries such as Brazil22-23 or Serbia,24 in which increases of 2.8 and 2.2% were reported during the same study period, respectively. In contrast, between 2000 and 2011 in Panama25 and beginning in 1997 in the city of Cali in Colombia,26 PC mortality showed an annual decrease of approximately 2.6 and 1.5%, respectively. The principal reasons for the previously described reductions are related to improvements in access to medical services and timely diagnosis and treatment. In Brazil and Serbia, although improvements in diagnosis and in mortality registries have been observed, there is still a need to improve timely diagnosis and treatment.
Only one of the studies carried out in Brazil23 analyzed PC mortality trends according to primary socioeconomic regions in the country. They found that the more economically developed regions (South and Southwest) were those that presented the smallest percent change in PC mortality throughout the study period. No correlation with PSA demand was observed in any of the regions. These differences according to socioeconomic level have also been observed in countries with a significant reduction in PC mortality and with a well-established screening program, such as the United States, and in countries where men with PC residing in very low socioeconomic level communities were at a 40% higher risk of dying of PC.27
Mortality is directly related to disease incidence, but it is also an indirect indicator of access to care for timely diagnosis and treatment. The Gleason scale at the time of diagnosis was considered to be a prognostic factor for the development of PC. This scale defines tumor aggressiveness according to histological patterns categorized as well differentiated and low grade of aggressiveness (Gleason 2-4), moderately differentiated and intermediate aggressiveness (Gleason 5-7) and poorly differentiated and high grade of aggressiveness (Gleason 8-10).28 The 5-year survival of PC varies from 98.4% in the ≤6 group to 69.9% in those with a Gleason score of 8-10.29
The lack of a national cancer registry and related information does not allow for examination of prognostic factors such as the time of diagnosis, the type of treatment and duration from time of diagnosis to death. The results from two recent studies (one in Monterrey City (93%)6 and one in Mexico City (75%))7 suggest that in Mexico, a high proportion of cancers at the time of diagnosis are classified as high-grade or poor prognosis (Gleason ≥7) and consequently could be associated with lower survival.
It is unlikely that the changes observed according to marginalization status are only a consequence of changes in the PC incidence or in the prevalence of its risk factors. The fact that the federal states with very low marginalization present a significant reduction in PC mortality, principally among the most recent cohorts, can be a consequence of the increase in institutional capacity and cultural changes evident among the youngest men, which can promote more timely diagnosis and treatment. In some of these states, a high proportion of health technology resources are centralized, both for its inhabitants and for the neighboring states.30 In particular, for Baja California, Coahuila and Nuevo León, in addition to having a more timely diagnosis and treatment, it is also possible that the inhabitants of these states, which border the United States, have better access to care and treatment in border cities.
By contrast, in states with greater marginalization, in addition to having fewer health technology resources, there are economic, geographical and cultural factors that may reduce timely diagnosis and treatment, principally among men older than 65 years. A lower level of education, less geographic accessibility and a greater proportion of indigenous population can be associated with cultural factors or beliefs that hinder medical care uptake and the acceptability of diagnostic methods, consequently delaying diagnosis and treatment.
Additionally, the lower mortality rates observed at the beginning of the period among very high marginalization states and the significant reduction that was observed at the end of the eighties and beginning of the nineties in the high marginalization strata could be a consequence of registry information problems, and, in particular, an error in classifying the cause of death. A complementary analysis of trends in cancer mortality of poorly defined and unspecified sites in men as a proxy of the quality of the information showed a reduction nationally and by the strata of marginalization (appendix 1 and 2).* The greatest proportion of change was observed between 1996 and 1999 in high marginalization states (APC: -21.6; 95% CI: -33.1, -8.1) and between 1995 and 1998 in very high marginalization states (APC: -18.4; 95% CI: -42.2, 15.3). Although this last finding can be an explanation for the period effect that was observed in the strata of marginalization beginning from 1995, we cannot dismiss the possibility that the period effect is just an artifact of the data as a consequence of the lower proportion of deaths reported in this strata throughout the study (8.2%).
The principle advantage of this analysis is the national representativeness and availability of PC information over a period of three decades, which allows us, together with the two analysis methodologies: 1) to identify the significant changes in temporal trends with greater precision, and 2) to propose hypotheses in regard to potential determinants of PC mortality trends in Mexico. In contrast, the principle limitation of this study is the level of aggregation, which assumes that the level of state marginalization is homogenous and does not discriminate differences that may exist within the states or the individual determinants of health service access. This last limitation is attributed to the lack of a national cancer registry and highlights the need to determine the prevalence of PC risk factors and to evaluate which economic, cultural and institutional factors could be limiting timely diagnosis and treatment to be able to act on them.
In general, the well-established risk factors for PC are limited to three, non-modifiable characteristics (age, ethnicity and family history). Because in Mexico, the information about this topic and other potential risk factors is scarce, further studies are needed on an individual level, to provide a greater understanding of other prevalent and potential modifiable risk factors for PC that affect the national population. These studies could help plan interventions to reduce or control the incidence of PC and, to an extent, to reduce mortality as well. Thus, it is necessary to design a national cancer registry that takes into account the experience from other countries,31 and considers certain relevant characteristics for each type of cancer which could permit to evaluate incidence trends, timely diagnosis, prevention and treatment. In this particular case, the registry should therefore include information on the date, Gleason scale and clinical stage at the time of diagnosis, as well as the type of treatment indicated. An identifier should also be included (most likely a unique population registry code) that allows this information to be linked with mortality databases.
Finally, in this study, we documented the differences in PC mortality according to the level of marginalization in Mexico. These findings suggest that although changes that promote timely diagnosis of the disease have occurred in regions with greater marginalization, important deficiencies in this system remain, including options for and the ability to provide timely treatment. As such, the challenge for the health system is to determine deficiencies in material and human resources and to evaluate the best organizational and cost-effective strategies that will close gaps in access to diagnostic and treatment services, which can be a determinant of differences in PC mortality.

