


Services on Demand
Journal
Article
 English (pdf)
 Article in xml format
 Article references
 Send this article by e-mail
Indicators
-
 Cited by SciELO
 -
 Access statistics
Related links
-
 Similars in
SciELO
Similars in
SciELO
Share

 Permalink
Salud Pública de México
Print version ISSN 0036-3634
Salud pública Méx vol.57 suppl.1 Cuernavaca 2015
Artículo original
Adult obesity, disease and longevity in Mexico
Obesidad, enfermedad y longevidad en adultos mexicanos
Alberto Palloni, PhD,(1) Hiram Beltrán-Sánchez, PhD,(1) Beatriz Novak, PhD,(2) Guido Pinto, PhD,(2) Rebeca Wong, PhD.(3)
(1) University of Wisconsin-Madison. Wisconsin, USA.
(2) Colegio de México. Ciudad de México, México.
(3) University of Texas at Galveston. Galveston, Texas, USA.
Abstract
Objective. To obtain estimates of the effects of overweight and obesity on the incidence of type 2 diabetes (T2D) and adult mortality.
Materials and methods. We use three waves (2000, 2002, 2012) of the Mexican Health and Aging Survey (MHAS).We employ parametric hazard models to estimate mortality and conventional logistic models to estimate incidence of T2D.
Results. Obesity and overweight have a strong effect on the incidence of T2D;this, combined with the large impact of diabetes on adult mortality, generates increases in mortality that translate into losses of 2 to 3 years of life expectancy at age 50.
Conclusions. If increasing trends in obesity in Mexico continue as in the past, progress in adult survival may be slowed down considerably and the incidence of T2D will continue to increase.
Key words: mortality; obesity; type I diabetes; type II diabetes; cancer; heart disease; Mexico.
Resumen
Objetivo. Estimar los efectos de sobrepeso y obesidad en edad adulta en la incidencia de diabetes tipo 2 y en la mortalidad.
Material y métodos. Se emplearon tres paneles (2000, 2002, 2012) de la Encuesta Nacional de Salud y Envejecimiento en México (Enasem), junto a modelos de sobrevivencia y logísticos convencionales para estimar la mortalidad y la incidencia de diabetes, respectivamente.
Resultados. El sobrepeso y la obesidad tienen un impacto poderoso en la incidencia de diabetes tipo 2, lo que en combinación con el incremento del riesgo de mortalidad asociado con la diabetes de tipo 2, se traduce en pérdidas de 2 a 3 años de vida a la edad de 50 años.
Conclusiones. Si la tasa de crecimiento de la prevalencia de sobrepeso y obesidad en edad adulta mantiene el ritmo que ha tenido recientemente, las mejoras en sobrevivencia adulta se verán comprometidas y la incidencia de diabetes tipo 2 continuará en aumento.
Palabras clave: mortalidad; obesidad; diabetes tipo I; diabetes tipo II; cáncer; enfermedad del corazón; México.
As of 2012, the prevalence of adult obesity in Mexico was of the order of 33%1 placing the country in the first quintile of the obesity distribution in Latin American, Caribbean (LAC) and North American countries. Because child obesity continues to increase and is a precursor of adult obesity,2 future increases in adult obesity prevalence are likely.3 Overweight and obesity have been associated with elevated risks of prediabetes and type 2 diabetes (T2D), dyslipidemia, coronary heart disease, sleep apnea, cognitive dysfunction, cancer, and liver and kidney disease.4-8 However, while the impact on chronic conditions and disability is not questioned, there is still controversy about whether or not obesity increases mortality risks at least at older ages. Indeed, some research findings suggest deleterious effects, others show a neutral impact and, in some cases, they demonstrate a beneficial influence. In a very recent metaanalysis of more than one hundred studies it was found that normal and overweight individuals share similar mortality risks and that excess mortality is concentrated among those classified as obese (grades 2 and 3).9-10
In this paper we show that at least in the adult Mexican population, the indirect effects of overweight and obesity on mortality, namely, those operating through measured chronic conditions, are large and negative and that they are mostly accounted for by diabetes, most likely T2D. The total excess mortality associated with obesity is large, of similar magnitude to those associated with smoking. We estimate that older Mexican adults lose about 1.4-2.2 years of residual life at age 50 (about 5 - 8%) over a period of ten years, that is, close to 0.2 years per year.
Materials and methods
Data sources
We use the Mexican Health and Aging Study (MHAS) modeled after the US Health and Retirement Study (HRS). MHAS followed a representative sample of Mexican adults 50 and older and their spouses since 2001. In this paper we include information from the first (2001), second (2003) and third (2012) waves. MHAS is one of the most comprehensive longitudinal studies of elderly persons ever carried out in a low to middle income country. It provides micro-level data on multiple domains, such as demographic traits including migration history, various health outcomes and mortality, anthropometric measures, functional and cognitive status, lifetime behaviors, work history, income assets and pensions, transfers, household assets, and community characteristics. The baseline sample consists of 15 402 interviews carried out during 2001 among target sample individuals and their spouses. Target respondents were selected following the National Employment Study sampling scheme, conducted by the Instituto Nacional de Estadística, Geografía e Informática (INEGI), and included coverage of both urban and rural residents in all 32 Mexican states. States with high emigration rates to the US were oversampled. Interviews were conducted in-personby INEGI professional interviewers who were trained by MHAS personnel and INEGI supervisors to secure appropriate follow-up. Specially trained field supervisors also administered various anthropometric measures, including height, weight, knee height, hip, and waist circumference, to a 20% random subsample.
Two follow-up interviews with surviving respondents were conducted during 2003 and 2012. New spouses/partners were also included in subsequent waves. The second wave consists of 14 386 respondents and a sample of 220 new spouses while the third wave includes 12 569 respondents and a refreshment sample of 5 896 new subjects and their spouses. Next-of-kin proxy respondents reported 546 deceased respondents from the 2001 baseline and 2 742 deceased from the 2003 wave.
We only use targets interviewed in the first MHAS wave and follow them through the second and third waves. We retrieve information on dates of death, attrition and for those who survive aninterwave period, on changes in conditions and self-reported anthropometry. Table I describes basic characteristics of the sample in 2001, including information on response rates, attrition and mortality.

Study variables
The most important variables used in this study are the following:
• Self-reported diabetes, cancer, and heart disease. These are coded from responses to a question of the following form: "Has a doctor or medical personnel ever told you that you have...?" Although self-reports are very complete, the information for diabetes is probably more reliable than for heart disease and cancer. Comparisons of self-responses among survivors across waves show a very high degree of agreement, suggesting strong reliability. Due to lack of access to medical care, it is most likely that self-reports understate the prevalence of some illnesses, particularly cancer and heart disease. If so, it will lead to underestimates of effects in models where the condition is either the dependent or the independent variable. Thus, if anything, our results may be biased on the conservative side and our estimates should be considered lower bounds. A caveat regarding diabetes is in order. The survey question that retrieves information about diabetes is not designed to distinguish (nor could it) T1D and T2D. For this reason in what follows, we use the term "diabetes" to refer to cases in MHAS on the understanding that most of these are T2D cases. We continue to us the term T2D when referring to the disease itself rather than to observed cases.
• Education. We use education as an indicator of socioeconomic status. Other indicators, like income and rural-urban residence, were considered as well but were dismissed. Income is not only a somewhat volatile indicator of well-being, particularly in low to middle income countries, but the information retrieved in MHAS contains high levels of missingness. Using income as a variable would have compromised sample size and prompted validity concerns if standard imputation methods had been used. Rural-urban residence is highly correlated with education and in our preliminary tests its inclusion in models did not add discriminating power. We only define two educational groups: one for individuals less than six years of schooling (elementary or less), and one including individuals with six or more years of schooling. Alternative specifications of this variable, such as a continuous version of years of schooling (including a quadratic formulation) as well as dummies based on alternative cutting points, produced results and inferences that are no different from those reported here.
• Anthropometry. To assess body mass we use two sets of measures. The first is based on self-reported height and weight and the second on objective measures retrieved in wave 1 by specially trained personnel. Objective assessments are available for 1 950 individuals interviewed in wave 1 or about 15% of the total initial sample of targets and spouses. MHAS's objective measures include height, weight, hip, and waist circumference as well as a number of physical performance tests. In this paper we use objective measures of weight and height only to verify results obtained with the much larger sample with self-reported weight and height. Models including effects of hip and waist circumference were also estimated in the smaller sample with objective anthropometry. Results obtained with these measures are reported elsewhere and lead to conclusions about obesity and overweight that are consistent with those reported here using self-reported height and weight. We define three dummy variables to reflect underweight, overweight and obese. Throughout, the residual category is normal weight. Unless otherwise noted we use standard categories: underweight are those with BMI < 18.5; normal are those with 18.5 ≤ BMI < 25; overweight are those with 25 ≤ BMI < 30 and obese are those with BMI ≥ 30.
• Control variables. In addition to the variables defined above our models include a dichotomous variable for person's sex and, unless otherwise stated, age or log of age at first wave. Sex enters as an additive variable since the magnitude of interaction effects and goodness of fit statistics from sex-specific models suggest that pooled models are the most parsimonious formulation. Some models control for 'ever smoking' to minimize confounding of obesity with other unhealthy behaviors that may be correlated with limited physical activity and poor diets.
The categorical variables for BMI and self-reported conditions are time dependent covariates, e.g., they reflect changes between waves 1 and 2. Information on health changes that took place after wave 2 cannot be used in our mortality analysis since it is only available for individuals who survived to the last panel. However, we use this information in the analysis of diabetes incidence.
Non-response and interwave attrition
MHAS stands together with a handful of multiple wave surveys as having remarkably low non-response in each wave and very low losses to follow-up (table I). As a consequence, we opt to work with the case completed data set, to use multiple imputation methods sparingly (see below), and to adjust for selective attrition using standard inverse weighting.11 Weighted and unweighted estimates are similar, confirming that attrition is not only low but also likely ignorable.
Missing data
Item missigness for age, sex, education and self-reported conditions is very low (table I) and we ignore it dropping these cases. We gave special consideration to BMI based on weight and height self-reports, an indicator that exhibits about 25% missingness. We used variants of standard multiple imputation procedures to impute the BMI category to which an individual with missing information on either height or weight belongs (box I).
Relations between obesity, chronic illnesses, and mortality
Figure 1 is a stylized representation of the relations of interest. The figure identifies both direct (γ) and indirect (α,β) effects of obesity on the risk of dying. An indirect effect represents a mediating path whereby obesity/ overweight influences the risk of onset of a chronic condition (α) and the latter has a direct impact on mortality risks (β). The direct path (γ) may seem odd. We justify it only as a representation of effects of obesity attributable to either obesity per se (e.g., increased risks of accidents and injuries), to unmeasured/ unknown chronic conditions or, alternatively, to other morbid processes, including infectious diseases, that are triggered by obesity and could result in fatalities.

Although figure 1 is a useful representation of relations of interest, it shows more than the observational data can reveal to us. In particular, we cannot directly estimate all the parameters involved because the study design is not strictly longitudinal but is instead a limited panel with reduced retrospective recall. As we discuss elsewhere, optimal estimates of relations in figure 1 require the use of multistate models with detailed information on state occupancy and sojourn times.
In this paper we choose to estimate the parameters in figure 1 in a piecemeal fashion through a combination of models. First, we estimate γ and β using Gompertz proportional hazard models. Second, we separately estimate the parameter a using a conventional logistic model for diabetes incidence between waves. We describe these below.
• Hazard model. To identify effects of obesity on the risk of dying between 2001 and 2012 we estimate a fully parametric proportional hazard model with a Gompertz baseline hazard. The model for mortality over age 50 takes on the following form:

where xo is age at first wave (2001), t is the duration since first wave, λ is the Gompertz level parameter and γ is Gompertz's slope. The Gompertz function is a good approximation to mortality at ages over 50. We rescale age to be the difference between age at first wave and 50. From (1) it is clear that the regression coefficient associated with the rescaled age variable, e.g., (x -50) in the proportional hazard formulation must be constrained to equal the slope, γ. The parameter λ (an estimate of mortality at age 50) was modeled as a function of covariates, including controls for sex and (a dummy for) education, in addition to the variables of interest to us namely, obesity/overweight indicators and self-reported conditions, particularly diabetes, cancer and heart diseases. We also estimated models in which the slope is defined as a function of covariates. Because of space limitations, these models are described elsewhere and are available on request. Results from these models illuminate other aspects of the relations of interested and confirm inferences contained here.
• Logistic model for diabetes incidence. We first define the exposed population as the subset of individuals who in the first wave of the study reported never having been diagnosed with diabetes. New cases are those who either in wave 2 or 3 reported to have been diagnosed with diabetes and had not in wave 1. We model the effects of initial obesity using a simple logistic model for the cumulated probability of becoming a new case during the interwave period. This is tantamount to modeling via a logit functional transform the integrated hazard of diabetes, where integration is between age at wave 1 and age at last wave. As controls we use the log of age at wave 1, education and sex. It is important to note that, due to lack of suitable retrospective information in the second and third wave, we do not know diabetes incidence among individuals who contract diabetes in one of the interwave periods but die before the following wave.
Excluding these individuals from our analysis will bias downward the overall exposure to the risk. Including them in our models will bias downward the average estimated risk since these individuals will contribute to exposure but not to the number of events. We opt to use a conservative strategy and report results from models including these cases, e.g., biasing downward the overall incidence.
Results
Total and direct effects of obesity on mortality
Table II displays estimates of parameters for four different specifications of the main model. First (model 1), the baseline model yields Gompertz parameters that are remarkably consistent with national life tables for Mexican adults. Estimates of the constant and slope imply life expectancies at age 50 of 25 and 29 years for males and females, respectively. Estimates from Mexican vital statistics for the period 2000-2012 are 24.4 and 28.9 for males and females, respectively.12 Second, the effects of education on mortality are as expected, negative, and in models not controlling for chronic conditions, statistically significant. Males experience significantly higher mortality than females and the excess risks are, as in observed life tables, of the order of 23 to 33% (exp(.21) to exp(.29)). Third, estimated effects of obesity/overweight in the absence of control for chronic conditions (model 2) are consistent with those obtained in some of the literature as they imply absence of negative impact of either overweight or obesity. While the underweight category experiences mortality risks 1.23 (exp(.21)) times as high as normal weight, individuals who are overweight and obese experience mortality risks that are between 94% (exp(-.06) and 95% (exp(-.05)) as high as those of normal weight, that is virtually the same levels as normal weight. These small numerical differences are also statistically insignificant even at very liberal significance levels.

Introducing the presence of diabetes (model 3), and then other chronic conditions (model 4) leads to two findings. First, and as expected, the effect of each chronic condition considered here is very large: on average, their presence more than doubles mortality risks. Second, the effect of overweight retains its negative sign, its magnitude increases almost twofold, and becomes statistically significant. Instead, the effect of obesity remains small and statistically insignificant. This is, indeed, the unexpected favorable effect of overweight uncovered elsewhere in the literature.9'10 This favorable effect is masked in model 2 by the negative role played by chronic illnesses. Once these effects are removed, overweight individuals appear to experience lower mortality risks than those of normal weight.
One may quibble that BMI assessment is based on self-reported measures and that estimates may be altogether different if BMI was objectively assessed. To test this possibility we estimated a model identical to model 4 but using objective BMI in the smaller sub-sample. The estimates are displayed in the last column of table II. These results are nothing short of remarkable. Asides from differences in quantities that are scalable (dependent on sample size) such as the standard errors, log likelihood, and associated statistics, the value of the coefficients are virtually the same as in the larger sample. The only two exceptions to this are the rather larger (negative) effects of education and the significantly smaller effect of heart disease. The magnitude of effects of BMI categories does not change at all but in all three cases they become statistically insignificant and suggest that overweight and obesity even if not benign they are at least neutral. We take this similarity of results between the subsample with objective measures and the much larger sample of targets to be a sign of the robustness of our previous estimates to vagaries of BMI measurement via self-reports.
Accepting the results from model 4 poses an important problem since, as anticipated at the outset, the interpretation of direct effect of overweight (or obesity) on mortality risks is cumbersome. It is even more so to explain direct negative effects without invoking the existence of unmeasured protective traits associated with overweight. However, elsewhere we show that the apparently favorable and protective (direct) effect may have a different source, namely, statistical artifacts and model misspecification. In this paper we do not discuss this issue any further. Instead we propose to uncritically accept the existence of protective effects of overweight on mortality (from model 4) but focus on the assessment of the overall (gross) effects of the population distribution by BMI on population average mortality risks. This is a reasonable quest since a heavier BMI distribution by implying a higher chronic diseases load (see above), inevitably will translate into excess mortality, regardless of protective effects. As a consequence, the overall impact of a right skewed BMI population distribution may be, on average, highly unfavorable, even acknowledging the plausibility of protective effects among overweight individuals, whatever its source may be.
We pursue this strategy after an assessment of the impact of overweight and obesity on the incidence of diabetes, one of the three chronic conditions considered here and related to obesity.
The effects of obesity on diabetes
Table III, models 1 and 2, display estimates of logistic models for the incidence of diabetes (waves 1 to 2; 1 to 3; 2 to 3) using the entire sample and the subsample with objective anthropometric measures, respectively. Since the relation with age is curvilinear we use the quadratic of (log) age in addition to the usual controls. According to estimates in the entire sample, the cumulated risks of developing diabetes increase sharply with age (although the rate of increase turns negative at older ages), are lower for males than for females, and for those in the higher education group. The estimated effects imply that, on average, the cumulated (integrated) risk of contracting diabetes between 2001 and 2012 is 1.8 and 2.6 times higher among overweight and obese people at baseline, respectively. Both these effects are statistically significant. A more conservative but still sizeable set of estimates applies to the smaller subsample with objective measures (model 2): the cumulated risks of contracting diabetes are 1.54 and 3.0 times higher among overweight and obese individuals respectively but the estimated effect of overweight is significant only, with p<10. Here again, the fact that we obtain similar results in both the entire sample of targets and in the much reduced subsample with objective measures is an indication of the robustness of findings. And these are unambiguous: overweight and obesity conditions get close to double the cumulated risks of contracting diabetes in a ten-year period. If we ignore diabetes incidence among individuals who are underweight at the outset, these estimates imply that over a period of 10 years the population of diabetics above age 50 will increase by about 1% (.0093) per year. Overall, and irrespective of its mortality implications, these are large impacts that may be consequential for health care costs and expenditures.13,14

The effects of chronic conditions on mortality
To generate estimates of the total effects of overweight and obesity on average mortality, we combine the estimate of the unfavorable impact of obesity on diabetes' incidence (represented by □ in figure 1), the estimated excess mortality due to diabetes (represented by □ in figure 1), and offset both of these by the estimated (but unexplained) favorable effect of overweight and obesity (□ in figure 1). The result is an estimate of the total gross effects of the BMI distribution on average mortality levels.
The computations assume a cohort of individuals aged 50 with the same BMI distribution observed in the MHAS sample of targets. Throughout, we ignore the category underweight. For subpopulations in cells resulting from the cross-classification of sex and education we calculate expected mortality over aperiod of 10 years by projecting forward BMI-specific subpopulations withBMI-specific diabetes incidence and mortality. Thus, for example, the subpopulation of females of low education is divided into a fraction assigned to the overweight / obese category and the remainder to the normal weight category. Each of these two subpopulations is survived ten years taking into account (a) diabetes incidence, and (b) mortality risks associated with individuals' obesity and diabetes status. The total number of deaths over the ten year period of the projection is then compared to the total number of deaths that results if all the population is of normal weight but preserving the diabetes incidence and mortality rates associated with normal weight. The ratio of the former quantity to the latter is what we refer to as the 'excess mortality ratio' (EMR) associated with overweight and obesity. The expression for the numerator of the ratio (EMR ) and denominator (EMR. ) are as follows:
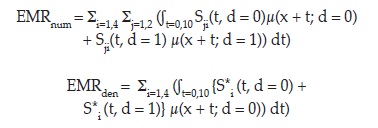
where i is the index for obesity status, j the index for sub-populations resulting from cross classifying gender and education, Sji (t, d = 0) and Sji (t, d = 1) are, respectively, the probabilities of surviving up to age 50 + t as non-diabetic and diabetic in the presence of obesity, S*ji (t, d = 0) and S*ji (t, d = 0) are the same functions in the absence of obesity, and the μ'S are the forces of mortality for non-diabetic (d = 0) and diabetic (d = 1). The values of the S functions are dependent on the past incidence of mortality and diabetes.
The value of EMR associated with current conditions in Mexico (sample of targets) is of the order of 1.21, suggesting a 21% excess mortality associated with obesity. The value of EMR under conditions of higher prevalence of overweight/obesity (.50 instead of .38) jumps to 1.32. If Mexico's mortality follows the Coale-Demeny West pattern, shifts of this magnitude in EMR translate into potential losses of life expectancy at age 50 of about 1.4-2.2 years (5 to 8%) of residual life at age 50 over a period of ten years, that is, close to .2 years per year. These quantities are sizeable: they are about one third of years of life lost at age 50 due to smoking in many countries in LAC.15
These estimated 'losses' are, of course, not real, observed losses. They represent gains foregone associated with prevalence of overweight/ obese and the associated risks of diabetes and mortality. Equivalently, they could be thought of as the losses in life expectancy at age 50 one would observe over a ten year period if no shift beneficial to survival were to be experienced in the next ten years, including improvements in the treatment of diseases, whether or not they are related to obesity.
We believe the numbers computed above are underestimates. First, they ignore the effects of heart disease and cancer, both related to obesity. Second, it is likely that there is at least some underreporting of chronic conditions. This should attenuate all estimates of effects of obesity. Third, throughout we use self-reported conditions either in wave 1 or wave 2 and ignore cause of death (reported by a relative) among those individuals who die between waves. Thus, if an individual who did not report diabetes in 2003 dies between 2003 and 2012 and a spouse identifies diabetes as the cause of death we do not recode the 2003 self-report. And, finally, the calculations include the protective effects of obesity and overweight, thus dampening the overall impact on mortality. We believe this is incorrect since, at least in the MHAS sample, protective effects are the product of artifacts and misspecified models. However, the results presented above should temper statements suggesting that obesity may have ambiguous or even beneficial effect on survival at older ages. As smoking has done in the past and will continue to do so in the future, obesity has had and will continue to have a strong impact on health status, health care, health costs, and could gradually erode future improvements in longevity.
Discussion
In this paper we use a new data set on Mexican older adults (MHAS) who were followed for a period of ten years and estimate with some precision the total, direct and indirect effects of obesity on mortality. An important result of our analysis is that inferences drawn from models that include anthropometry remain unchanged regardless of whether we use objective or self-reported measures. Elsewhere it has been shown that there is significant agreement between self-reported height and weight and objective measures reported in MHAS,16-18 and although consistency varies by age and sex, the overall concordance of measures is high enough to secure valid inferences. This general agreement between self-reports and objective measures is confirmed in this paper, where the analysis of mortality and diabetes incidence produce highly consistent estimates in the total sample and in the smaller subsample with objective measures.
Our results show that the total effects of obesity on mortality are powerful and consequential. The three diseases whose incidences are more closely connected to obesity are T2D, heart disease and cancer and, in the case of Mexican adults, diabetes is the most dominant and influential of these conditions. Even if one accepts small and direct protective effects of overweight/ obesity, the condition can induce excess mortality simply by augmenting the incidence of diabetes, a chronic disease that, in Mexico at least, is accompanied by relatively large excess mortality risks. We estimate that under current conditions of overweight/ obesity prevalence, diabetes incidence and related mortality the adult Mexican population aged 50 stands to experience losses of between 1 to 2 years of life expectancy at age 50, somewhat less than the losses associated with smoking prevalence in some countries of the region. These losses are important, but they are likely to be lower bound estimates.17 Furthermore, these estimated losses represent the impact of obesity on mortality only and ignore potential increases in illness and disability loads and associated healthy life expectancy losses, decrease in labor productivity, and excess burden of health care and health expenditures.
Acknowledgment
The research on which this paper is based was supported by the National Institute on Aging via research project grants (RO1 AG016209 [PREHCO], R03 AG015673, R01 AG018016, and MERIT award R37 AG025216), and by a Fogarty International Center award for Global Research Training in Population Health (D43 TW001586). The University of Wisconsin-Madison researchers are supported by core grants to the Center for Demography and Ecology, University of Wisconsin (R24 HD047873) and to the Center for Demography of Health and Aging, University of Wisconsin (P30 AG017266).
References
1. Food and Agriculture Organization of the United Nations.The state of food and agriculture. Rome: FAO, 2013. [ Links ]
2. Brisbois TD, Farmer AP, McCargar LJ. Early markers of adult obesity: a review. Obes Rev 2012; 13:347-336. [ Links ]
3. Biro FM, Wien M. Childhood obesity and adult morbidities. Am J Clin Nutr 2010;91 (5): 1499S-1505S. [ Links ]
4. Guh DP, Zhang W, Bansback N. Amarsi Z, Birmingham CL, Anis AH. The incidence of co-morbidities related to obesity and overweight: a systematic review and meta-analysis. BMC Public Health 2009;9:88. doi:10.1186/1471-2458-9-88. [ Links ]
5. Ix H, Sharma K. Mechanisms linking obesity, chronic kidney disease, and fatty liver disease: the roles of fetuin-A adiponectin, and AMPK.J Am Soc Nephrol 2010;21:406-412. [ Links ]
6. Peppard PE, Ward NR, Morrell MJ. The Impact of obesity on oxygen desaturation during sleep-disordered breathing. Am J Respir Crit Care Med 2009;180:788-793. [ Links ]
7. Pérez CM, Sánchez H, Ortiz AP. Prevalence of overweight and obesity and their cardiometabolic comorbidities in Hispanic adults living in Puerto Rico. J Community Health 20l3.doi: 10.1007/s 10900-013-9726-5. [ Links ]
8. Smith E, Hay R Campbell L, Trollor JN. A review of the association between obesity and cognitive function across the lifespan: implications for novel approaches to prevention and treatment. Obesity Rev 2011; 12:740-755. [ Links ]
9. Flegal KM, Kit BK, Orpana H, Graubard BI.Association of all-cause mortality with overweight and obesity using standard Body Mass Index categories: a systematic review and meta-analysis. JAMA 2013;309(1):71 -82. [ Links ]
10. Flegal KM, Graubard BI, Williamson DF, Gail MH. Excess deaths associated with underweight, overweight, and obesity. JAMA 2005;93(15):1861-1867 [ Links ]
11. Wolldridge J. Inverse probability weighting for general missing data problems. J Econom 2007; 141 (2): 1281 -1301. [ Links ]
12. Palloni A Pinto G, Beltrán-Sánchez, H. Latin American Mortality Database (LABdA). Center of Demography and Health of Aging, University ofWisconsin-Madison 2014 [accessed on September 2013]. Available at: https://www.ssc.wisc.edu/cdha/latinmortality/. [ Links ]
13. Barceló A, Aedo C, Rajpathak S, Robles S.The cost of diabetes in Latin America and the Caribbean. Bull World Health Organ 2003;81 (I): 19-27. [ Links ]
14. Abegunde DO, Mathers CD, Adam T, Ortegon M, Strong K. The burden and costs of chronic diseases in low-income and middle-income countries. Lancet 2007;370(9603): 1929-1938. [ Links ]
15. Palloni A Novak B, Pinto G.The enduring effects of smoking in Latin America: a losing battle? Working series paper No 2013-07 [internet document]. Center for Demography and Ecology, University of Wisconsin-Madison, 2013 [accessed on: September 2014]. Available at: http://www.ssc.wisc.edu/cde/cdewp/home.php. [ Links ]
16. Klipstein-Grobusch K, GeorgT, Boeing H. Interviewer variability in anthropometric measurements and estimates of body composition. Int J Epidemiol 1997;26(1):S 174-S180. [ Links ]
17. Palloni A Soldo B,Wong R.The accuracy of self-reported anthropometric: obesity and older Mexicans. Population Association of America Meetings, Minneapolis: May 1-3, 2003. Center for Demography and Ecology, University ofWisconsin-Madison.CDEWorking Paper No.2004-23: 1-33 [internet document] [accesed on: September 2013]. Available at: http://www.ssc.wisc.edu/cde/cdewp/2004papers.php. [ Links ]
18. Ávila-Funes JA Gutiérrez-Robledo LM, Ponce De León-Rosales S. Validity of height and weight self-report in Mexican adults: results from the National Health and Aging Study. J Nutr Health Aging 2004;8(5):355-361. [ Links ]
Received on: December 9, 2013
Accepted on: December 9, 2014
 Corresponding author:
Dr. Alberto Palloni.
Center for Demography of Health and Aging University of Wisconsin-Madison.
4412 Sewell Social Sciences Bldg, 1180 Observatory Drive.
53706-1393 Madison. Wisconsin, USA.
E-mail: palloni@ssc.wisc.edu.
Declaration of conflict of interests. The authors declare that they have no conflict of interests.
