


Servicios Personalizados
Revista
Articulo
 Inglés (pdf)
 Artículo en XML
 Referencias del artículo
 Enviar artículo por email
Indicadores
-
 Citado por SciELO
 -
 Accesos
Links relacionados
-
 Similares en
SciELO
Similares en
SciELO
Compartir

 Permalink
Salud Pública de México
versión impresa ISSN 0036-3634
Salud pública Méx vol.56 no.4 Cuernavaca jul./ago. 2014
Artículo original
Scale and scope economies in Mexican private medical units
Economías de escala y alcance en unidades médicas privadas en México
Jorge Keith, M Sc,(1) Diego Prior, PhD.(1)
(1) Universidad Autónoma de Barcelona. España.
Abstract
Objective. To evaluate technical efficiency and potential presence of scale and scope economies in Mexican private medical units (PMU) that will improve management decisions.
Materials and methods. We used data envelopment analysis methods with inputs and outputs for 2 105 Mexican PMU published in 2010 by the Instituto Nacional de Estadística y Geografía from the "Estadística de Unidades Médicas Privadas con Servicio de Hospitalización (PEC-6-20-A)" questionnaire.
Results. The application of the models used in the paper found that there is a marginal presence of economies of scale and scope in Mexican PMU.
Conclusions. PMU in Mexico must focus to deliver their services on a diversified structure to achieve technical efficiency.
Key words: efficiency; scale economies; scope economies; private medical units; data envelopment analysis (DEA); Mexico.
Resumen
Objetivo. Evaluar la eficiencia técnica y la presencia de potenciales economías de escala y alcance en unidades médicas privadas (UMP) mexicanas, de forma que sea posible establecer planes para la mejora de su gestión.
Material y métodos. Se utilizó el método de Análisis Envolvente de Datos con información de insumos y productos para 2 105 UMP del año 2010 publicada por el Instituto Nacional de Estadística y Geografía a través del cuestionario denominado "Estadística de Unidades Médicas Privadas con Servicio de Hospitalización (PEC-6-20-A)".
Resultados. La aplicación de los modelos encuentra una presencia marginal de economías de escala y alcance en las UMP mexicanas.
Conclusiones. La operación de las UMP en México debe enfocarse a prestar servicios bajo un modelo diversificado para alcanzar mejores niveles de eficiencia técnica.
Palabras clave: eficiencia; economías de escala; economías de alcance; unidades médicas privadas; análisis envolvente de datos (AED); México.
Public and private hospitals, as well as the healthcare industry, face great pressure to control continuously growing costs, even more so when governments have a major stake in this sector, driven primarily by maintaining the population health welfare and the correct allocation of scarce resources.
The increasing demand for health services has led Mexico to take innovative steps to improve their performance. Over recent decades, the country has experienced remarkable improvements in life expectancy and a steady decline in infant mortality rates. However, life expectancy remains the fourth lowest among the Organisation for Economic Cooperation and Development (OECD) countries. There is a need to find additional funding and improve the efficiency of supply in the public health sector and to encourage private investment.1 From 2000 to 2010, public medical units have grown by 12.6% and available beds by 3.0%. For the same period, investments in private medical units (PMU) have grown by 41.0 and 28.6% respectively. At the end of 2010, Mexico had 3 976 hospital units, of which 66.4% were private.2 The above information highlights the importance of the private hospital sector in recent years due to the lack of public infrastructure that supports quality public services.
There is a large body of literature on the efficiency and productivity of hospitals which has been summarized by several authors.3-5 Most studies focus on the effects of environmental pressures on hospital efficiency, such as payment system and property rights.6-8 Other studies pinpoint economic phenomena, such as economies of scale, economies of scope, economic behavior, and expense preference,9,10 as well as market structure and competition.11,12 The main objective of this paper is to measure technical efficiency in two subgroups of medical units: diversified and specialized, in order to determine the presence of scale and scope economics for managerial purposes based on a conceptual framework.
Production function. Mckay and Deily13 present a conceptual framework indicating that the standard economic theory of the firm posits a production function, in which a production process transforms inputs into outputs, and assumes that, for a given set of input prices, the firm chooses the set of inputs that will minimize the cost of producing a given amount of output at a given level of quality. The production process itself is taken as a given, with no description of how inputs are transformed into output. In this approach, any inefficiency occurs only temporarily and randomly, as the firm adjusts toward optimization.
Efficiency measurement, whether at the level of the individual physician, the hospital or the healthcare system as a whole, is a topic of continuing interest in the health economics literature, with an extensive discussion about the appropriate efficiency concept and measurements. The ability to measure efficiency continues to be of interest to analysts and decision-makers at all levels of government who are in charge of the responsibility to allocate scarce healthcare resources across competing needs.14
Theories of economies of scale and scope are considered part of production theory, therefore their analysis as a framework is important to understand the factors affecting efficiency in the healthcare sector. In general terms, these two economic concepts describe what happens to production or costs when the size and/or the diversification of the firm changes (increases).
Scale economics. According to Stigler,15 the theory of the economies of scale is that of the relationship between the scale of use of a properly chosen combination of all productive services and the rate of output of the enterprise. Economies of scale exist if the average costs of producing a product or service decline as the volume of production increases. Scale effects are potentially relevant for hospital efficiency, given the nature of the production process and the substantial size differences between hospitals.16
To assess the potential role of scale economies in specialty hospitals' efficiency, scale economies for specific services in specialty hospitals versus general hospitals would need to be compared. For many specific surgical procedures, the volume of specific services performed at specialty hospitals typically exceeds those performed in general hospitals within the same market area.17,18 Thus, given the higher procedural volume in some services, to the extent economies of scale exist in these specific procedures they are likely to be realized to a greater degree in specialty hospitals compared with general hospitals with lower procedural volume.9
Scope economies. Panzar and Willig19,20 coined the term "economies of scope" to describe a basic and intuitively appealing property of production: cost savings as a result of the scope rather than the scale. There are economies of scope where it is less costly to combine two or more product lines in one firm than to produce them separately. This is often the case when production relies on common resources, such as technology, workers, inputs and general overhead.
The decision to specialize will depend in part on the extent to which a firm's existing scope of products and services exhibit diseconomies of scope (i.e., where joint production is more costly than separate production). Conversely, the decision to diversify will in part be based on the extent to which joint production costs are less than separate production costs.9
Materials and methods
Hospital efficiency analysis is an important issue within the field of health economics. There are two contemporary approaches to measure hospital efficiency: the parametric approach (stochastic frontier analysis) and the non-parametric approach (free disposal hull and data envelopment analysis). Farrell21 first operationalized a frontier method to estimate the efficiency of a decision-making unit (DMU) with the distance between the DMU's observed level of outputs and inputs and the best practice production frontier. This measure was later formulated into a data envelopment analysis (DEA) model that uses linear programming to locate the best practice production frontier introduced by Charnes, Cooper and Rhodes.22 Each DMU can select its own input and output weights to show the best score of efficiency, subject to the condition that the corresponding ratio of every DMU be less than or equal to unity.22
DEA could use constant returns of scale (CRS) or variable returns of scale (VRS). If CRS cannot reasonably be assumed in the hospital sector for efficiency analysis, the most common alternative is to assume VRS. This can mean increasing or decreasing returns to scale, such that outputs rise more or less than proportionally with respect to changes in inputs used.16 The main limitations of DEA are the sensitivity to outliers and zero tolerance to data errors.23
This paper uses the methodology proposed by Prior and Sola,24 using the programming model developed by Banker, Charnes and Cooper,25 corresponding to the envelopment version in radial input orientation and VRS:

subject to:

Where:
ym,j: quantity of output m obtained by unit j,
xn,j: quantity of input n consumed by unit j,
I: total number of units,
M: total number of outputs,
N: total number of inputs,
zi: coefficient of intensity that determines the weights with which the observation "i" is used in determining the frontier corresponding to unit j,
αj: radial coefficient of technical efficiency corresponding to unit j.
The units I in model (1) consider simultaneously both specialized and diversified firms. This procedure implies there are cases presenting economies (or diseconomies) of diversification. This factor appears aggregated in αi and is treated as a component of technical efficiency, without the possibility of separating it from other factors.
The following step is to separate diversified units (D) and specialized units (S) in two groups. The notation on model (2) evaluates only diversified units with reference to the diversified frontier:

subject to:

Where:
ym,d: quantity of output m obtained by the diversified unit d,
xn,d: quantity of input n consumed by the diversified unit d,
D: total number of diversified units,
βd: radial coefficient of technical efficiency corresponding to the diversified unit d.
Model (3) evaluates the D diversified units with reference to the specialized frontier (formed with the S specialized DMUs):

subject to:

Where:
ym,i: quantity of output m obtained by the specialized unit s,
ym,d: quantity of output m obtained by the diversified unit d the DMU under analysis,
xn,i: quantity of input n consumed by the specialized unit s,
xn,d: quantity of input n consumed by the diversified unit d (the DMU under analysis),
S: total number of specialized units,
γd: radial coefficient of technical efficiency corresponding to the diversified unit d,
The objective to have two separate models (2) and (3) is to obtain a double frontier reference (the frontier of diversified and specialized units), and compare these frontiers to establish whether diversification economies exists (figure 1). The coefficient βd indicates the proportion in inputs (0 < βd ≤ 1) that unit d requires in order to reach the diversified frontier, and γd indicates the proportion in inputs (0 < γd ≤ 1) that unit d requires in order to arrive at the specialized frontier. The existing relation between the values of the coefficients βd and γd indicates the presence of diversification economies (when βd< γd), or of diversification diseconomies (when βd > γd).24
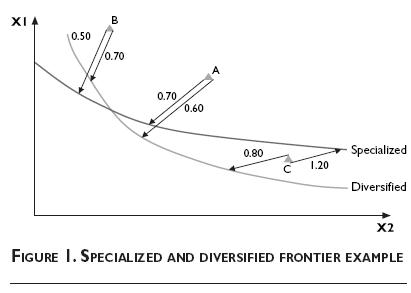
For a specialized unit d1, it appears to be diversification economies when the following coefficient, obtained by combining these two frontiers, has the expected value:

But otherwise, for another unit d2, if the input and output mixes produce a situation of diversification diseconomies, the coefficient shows another value:

Managerial implications from the models above can be observed using information of three
DMUs: A, B and C (table I).
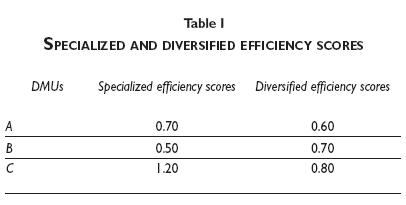
Figure 1 graphically shows the specialized and diversified frontiers. By applying the previous models we can determine that: (1) unit A exhibits economies of scope (as [0.7/0.6]=1.16 >1) because in this dimension the diversified frontier is more efficient than the specialized; (2) unit B represents a diversified unit exhibiting diseconomies of scope (as [0.5/0.7]=0.71<1), this situation indicates that, in this dimension, the specialized frontier is more efficient than the diversified frontier; and (3) unit C, being in the same sector than A, is in the subsample of DMUs exhibiting economies of scope (as [1.2/0.8]=1.5>1), with the particularity that, being inefficient for the diversified frontier, this unit is characterized as superefficient when compared with the specialized frontier (γd>1).
The data employed was obtained from a national database created and collected annually by Instituto Nacional de Estadística y Geografía (Inegi)26 in Mexico through a questionnaire called "Estadística de unidades médicas privadas con servicio de hospitalización (form PEC-6-20-1A)". The total sample for this study consists of 3 079 private medical units (PMUs) that include general and specialty hospitals, nursing homes, clinics and maternity units with 183 variables for year 2010, limiting the study to one year.
From the original database, it was necessary to eliminate some observations: 13 that corresponded to psychiatric hospitals, 480 due to its lack of medical procedures and 481 due to lack of consistency between surgical procedures and operating rooms. The total PMUs remaining, with an acceptable level of data quality for this analysis, consisted of 2105 observations: 1 990 diversified and 115 specialized.
The specific definition of outputs variables selected, according to the literature review and variable availability from the database, were:
y1: Surgical medical procedures. Joint systematized and aseptic surgical procedures carried out on patients with diagnostic or therapeutic purposes and which, by their nature, may be performed within or outside of an operating room.
y2: Total medical consultations. Attention where by questioning and examination of the patient a diagnosis is reached.
y3: Days of stay. The number of days since the patient entered the hospital until discharge. The patient going in and out the same day generates one day stay.
Input variables were defined as follows:
x1: Physicians. Lawfully authorized personnel with a professional title, whether general or a specialty or personnel in undergraduate and postgraduate training.
x2: Staff (physicians and non-physicians). Medical personnel that play technical support work, teaching and administrative staff in the medical units, paramedical, administrative and other staff.
x3: Hospital beds. Is a bed on service installed for regular use of inpatients.
x4: Operating rooms. Hospital's area, furniture, equipment and facilities, in order to perform surgical procedures.
Descriptive statistics for variables considered above are on table II, presented in three sections: all PMUs, only diversified units, and only specialized units. A wide margin in data can be observed between minimum and maximum in each output and input, which is related to different PMU sizes on the database used. It is also noteworthy that surgical procedures and operating rooms were considered as long as both have a value of zero, as part of database quality control. Specialized PMUs have a lower value on average against diversified, but this is not maintained on total medical consultations output, due perhaps to demand for specialized treatments that a diversified PMU cannot cover.
Results
The first step is to calculate efficiency scores with DEA for all observations in the database, determining a first efficiency frontier and evaluating if scale economies are present. On table III descriptive statistics are shown for the results using the standard DEA in radial input orientation from model (1) by using constant returns of scale (CRS), variable returns of scale (VRS) and a scale efficiency ratio calculation (meaning, dividing the efficiency score of CRS by the efficiency score of VRS).
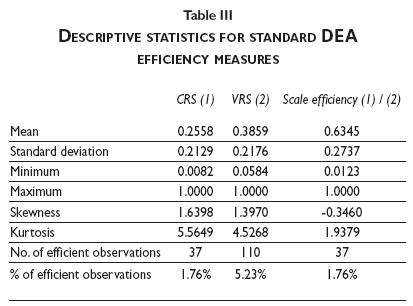
Results obtained using a CRS model indicate 37 efficient PMUs representing 1.76% of the total database, whereas this number increased to 110 efficient PMUs when a VRS model is considered, representing a 5.23%. This increase is expected because the VRS model considers any efficient units that are on the edge of the efficient frontier. An economy of scale is obtained by dividing CRS efficiency scores between VRS efficiency scores.24 The results indicate that only 1.76% of the database used show the presence of economies of scale. Distributions using CRS and VRS are positively skewed, presenting long right tails, and have positive kurtosis, indicating that their distributions have fat tails relative to the normal distributions. Results for scale efficient coefficients exhibit negative skew and positive kurtosis.
In order to corroborate whether there are important differences between efficiency scale scores for diversified and specialized PMU groups, it was necessary to perform a Mann–Whitney U test. The results suggest that there is a statistically significant difference between efficiency scores for diversified units and specialized units (z = 3.8777; p = 0.001). The sum of the diversified efficiency scores ranks was higher, while the sum of the specialized efficiency scores ranks was lower.
To determine economies of scope, table IV contains the results using the two-stage model from models (2) and (3). On average, the coefficient of diversification is 0.6399, with presence of diversification economies in 1.80% of them. The distributions are negatively skewed, presenting long left tails, and have positive kurtosis, indicating that their distributions have fat tails relative to the normal distributions.
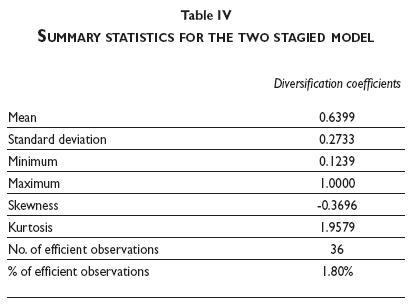
Considering the observations available, managerial implications from above indicate that most Mexican PMUs have improvement areas to move to efficiency. On average, there is 36.01% (1 - 0.6399) opportunity to increase in input consumption to reach for technical efficiency. The results show lack of economies of scope in Mexican PMUs.
Conclusions
Efficiency has been a major concern in healthcare industry for governments but also for private managers, due to pressures from general public and investors, respectively. The private sector has increased its investment in healthcare in recent years in Mexico, as the opportunity arises to provide quality health services with respect to the public sector, influenced by an increase of population and government budget constraints.
Considering the impact of scale and scope economics over technical efficiency in Mexican private medical units (PMUs), results show that there is a large variability in the efficiency scores among PMUs from 0.0584 to 1 using a VRS model. The efficiency results indicate that within Mexican PMUs there is a marginal presence of scale and scope economics (with only 1.76 and 1.80%, respectively). We did not find any similar study in Mexico and international comparison is limited due to differences in variables and methods selected. We point out the convenience to expand the size of Mexican PMUs through mergers, acquisitions, strategic partnerships or using organic growth, all of which will be important in the near future to achieve technical efficiency, and also to incorporate more health services.
The growing need for medical services in Mexico presents an important opportunity for academic research with managerial implications within the public and private healthcare. Future research should include: 1) allocative efficiency using economic data: revenues and costs; 2) comparison between private and public units using cross-sectional data; and, 3) to perform efficiency analysis in specific regions of Mexico (like Estado de Mexico and Distrito Federal) where the presence of PMUs are important.
References
1. Organization for Economic Cooperation and Development 2010. [Accessed January 28, 2013]. Available at: http://www.oecd.org/eco/healthcaresystemsefficiencyandpolicysettings.htm/ [ Links ]
2. Dirección General de Información en Salud 2013. [Accessed February 15, 2013]. Available at: http://www.sinais.salud.gob.mx/basesdedatos/cubos.html/ [ Links ]
3. Hollingsworth B. Non-parametric and parametric applications measuring efficiency in health care. Health Care Manag Sci 2003;6:203-218. [ Links ]
4. Worthington A. Frontier efficiency measurement in health care: A review of empirical techniques and selected applications. Med Care Res Rev 2004;61:135-170. [ Links ]
5. Hollingsworth B. The measurement of efficiency and productivity of health care delivery. Health Econ 2008;17:1107-1128. [ Links ]
6. Farsi M, Filippini M. Effects of ownership, subsidization and teaching activities on hospital costs in Switzerland. Health Econ 2008;17:335-350. [ Links ]
7. Daidone S, D'Amico F. Technical efficiency, specialization and ownership from: evidence for a pooling in Italian hospitals. J Prod Anal 2009;32:203-216. [ Links ]
8. Rego G, Nunes R, Costa J. The challenge of corporatisation: The experience of Portuguese public hospitals. Eur J Health Econ 2010;11:367-381. [ Links ]
9. Schneider J, Miller T, Ohsfeldt R, Morrisey M, Zelner B, Pi P. The economics of specialty hospitals. Med Care Res Rev 2008;65:531-553. [ Links ]
10. Blank J, Van Hulst B. Productive innovations in hospitals: An empirical research on the relation between technology and productivity in the Dutch hospital industry. Health Econ 2009;18:665-679. [ Links ]
11. Gaynor M. What do we know about competition and quality in health care markets? NBER 2006:12301. Available at: http://www.nber.org/papers/w12301 [ Links ]
12. Bloom N, Proper C, Seiler S, Van Reenen J. The impact of competition on management quality: Evidence from public hospitals NBER 2010:16032. Available at: http://www.nber.org/papers/w16032 [ Links ]
13. Mckay N, Deily M. Cost efficiency and hospital health outcomes. Health Econ 2008;17:833-848. [ Links ]
14. Liu C, Laporte A, Ferguson B. The quantile regression approach to efficiency measurements: Insights from Monte Carlo simulations. Health Econ 2008;17:1073-1087. [ Links ]
15. Stigler G. The economies of scale. J Law Econ 1958;1:54-71. [ Links ]
16. Asmild M, Hollingsworth B, Birch S. The scale of hospital production in different settings: One size does not fit all. J Prod Anal 2013;40:197-206. [ Links ]
17. Cram P, Rosenthal G, Vaughan-Sarrazin M. Cardiac revascularization in specialty and general hospital. New Engl J Med 2005;352:1454-1462. [ Links ]
18. Mitchell J. Effects of physician-owned limited service hospitals: Evidence from Arizona. Health Affair 2005:481-490. [ Links ]
19. Panzar J, Willig R. Economies of scale in multi-output production. Q J Econ 1977;91:481-493. [ Links ]
20. Panzar J, Willig R. Economies of scope. Am Econ Rev 1981;71:268-272. [ Links ]
21. Farrell M. The measurement of productive efficiency. J Roy Statist Soc Ser A 1957;120:253-281. [ Links ]
22. Charnes A, Cooper W, Rhodes E. Measuring the efficiency of decision making units. Eur J Oper Res 1978;26:429-444. [ Links ]
23. Cooper W, Seiford L, Tone K. Data envelopment analysis. A comprehensive text with applications, references and DEA-Solver Software, 2nd. edition. New York: Springer, 2007. [ Links ]
24. Prior D, Solá M. Technical efficiency and economies of diversification in health care. Health Care Manag Sci 2000;3:299-207. [ Links ]
25. Banker R, Charnes A, Cooper W. Models for estimation of technical and scale inefficiencies in Data Envelopment Analysis. Manage Sci 1984;30:1078-1092. [ Links ]
26. Instituto Nacional de Geografía y Estadística [Accessed February 5, 2013]. Available at: http://www.inegi.org.mx/est/contenidos/proyectos/registros/sociales/salud/presentacion.aspx/ [ Links ]
Received on: October 31, 2013
Accepted on: June 2, 2014
 Corresponding author:
MSc. Jorge Keith.
Tecnológico de Monterrey.
Sonora Norte,
Boulevard Enrique Mazón López 965,
Hermosillo, Sonora, México
E-mail: jkeith@itesm.mx
Declaration of conflict of interests. The authors declare that they have no conflict of interests.
