


Servicios Personalizados
Revista
Articulo
 Inglés (pdf)
 Artículo en XML
 Referencias del artículo
 Enviar artículo por email
Indicadores
-
 Citado por SciELO
 -
 Accesos
Links relacionados
-
 Similares en
SciELO
Similares en
SciELO
Compartir

 Permalink
Salud Pública de México
versión impresa ISSN 0036-3634
Salud pública Méx vol.54 no.4 Cuernavaca jul./ago. 2012
ORIGINAL ARTICLE
Neighborhood socio-environmental vulnerability and infant mortality in Hermosillo, Sonora
Vulnerabilidad socioambiental y mortalidad infantil en barrios de Hermosillo, Sonora
Francisco Lara-Valencia, PhDI; Gerardo Álvarez-Hernández, PhDII; Siobán D Harlow, PhDIII; Catalina Denman, PhDIV; Hilda García-Pérez, PhDI
ISchool of Transborder Studies, Arizona State University. Tempe, USA
IIDepartamento de Medicina y Ciencias de la Salud. Universidad de Sonora. Hermosillo, Sonora, México
IIISchool of Public Health, University of Michigan. Ann Arbor Michigan, USA
IVEl Colegio de Sonora. Hermosillo, Sonora México
ABSTRACT
OBJECTIVE: This paper explores the impact of contextual variables at the neighborhood level on a health marker in the city of Hermosillo, Mexico and discusses the importance of collaboration between planners and health professional to minimize the negative effect of contextual factors on urban health.
MATERIALS AND METHODS: Few studies in Mexico have assessed health outcomes at the intra-urban scale and their interaction with neighborhood-level contextual variables. Using spatial analysis and geographical information systems, the paper explores the association between infant mortality and an index of socio-environmental vulnerability used to measure urban contextual factors.
RESULTS: Two high infant mortality clusters were detected within neighborhoods characterized by relatively good environmental conditions and one in a neighborhood with a poor environment.
CONCLUSIONS: Our results show the clustering of high infant mortality areas and some association with built environment factors in Hermosillo. The results support the need to reconnect public health and urban planning as a way to create healthier environments in Mexican cities.
Key words: urban health; infant mortality; health disparities; city planning; geographic information systems; Mexico
RESUMEN
OBJETIVO: Este artículo explora el papel de factores contextuales a nivel de colonia sobre un marcador de salud en la ciudad de Hermosillo, México y discute la importancia de la colaboración entre planificadores urbanos y profesionales de la salud para minimizar el impacto negativo de factores contextuales sobre la salud de la población urbana.
MATERIAL Y MÉTODOS: Pocos estudios en México han evaluado las condiciones de salud a escala intra-urbana y su interacción con variables contextuales a nivel de colonia. Utilizando análisis espacial y sistemas de información geográfica, el artículo explora la relación entre mortalidad infantil y un índice de vulnerabilidad socio-ambiental construido para medir factores contextuales urbanos.
RESULTADOS: Dos conglomerados de alta mortalidad infantil fueron detectados dentro de colonias caracterizadas por condiciones ambientales relativamente buenas y uno en una colonia con un ambiente pobre.
CONCLUSIONES: Los resultados indican la formación de conglomerados de alta mortalidad infantil y una conexión moderada con factores del medio ambiente construido en Hermosillo. Estos resultados apoyan la necesidad de reconectar la salud pública y la planeación urbana como un método para crear ambientes más sanos en las ciudades de México.
Palabras clave: salud urbana; mortalidad infantil; disparidades de salud; planificación de ciudades; sistemas de información geográfica; México
While epidemiologists and other health experts have made considerable progress in understanding the impact of individual-level characteristics on infant mortality, considerably less is known about how social and material context at the neighborhood level affect children's survival chances within urban areas. As evidence of the effects of neighborhood context on health outcomes piles up, especially that of the built environment, the need to close this research gap grows in urgency.1-3 The built environment refers to the physical settings for human activity ranging in scale from homes to neighborhoods and cities, including their supporting infrastructure, such as transportation systems, open space, buildings, sanitation and derived patterns of human activity that "can plausibly be considered determinants of population health."4
Calls in favor of this theoretical expansion also emphasize the need to use "true area data" that reflects the social and physical qualities of place rather than compositional measurements.5-7 Compositional measurements usually rely on aggregation of individual socioeconomic characteristics to construct composite indices that are later used to characterize places in terms of social deprivation or exclusion.8,9 Instances of these measurements include summaries of the attributes of individuals occupying an area, for example, the percentage of unemployed workers in a neighborhood. In contrast, contextual approaches characterize places using dimensions that are not reducible to the individual level because they are part of the built environment. Some of these dimensions relate to the physical properties of places where people live, work or play (e.g. number of neighborhood parks and distance to nearest grocery store) and some other relate to intangible attributes of a place resulting from the social interactions occurring within it (e.g. population density and land use). Elements of the built environment are not evenly distributed within cities and are constantly changing, so levels of exposure vary in space and time creating neighborhoods which are more health damaging or health promoting.10-12 Therefore, the built environment contributes directly to intraurban health disparities, an area of growing concern for public health professionals.
In fact, several studies have shown that proximity to care facilities is correlated with a reduction in infant mortality rates, both in urban and rural settings.13-15 Recent studies exploring the connection between the built environment and urban health have found a positive correlation between green space and different health outcomes.16-18 These studies link access to urban parks and community amenities with the increased engagement of children and adults in outdoor activities and the formation of stronger social ties in urban neighborhoods.19,20 Furthermore, current planning theories suggest that through urban design, mixed land use patterns, and adequate transportation systems, it is feasible to increase walking and other forms of physical activity, protective factors against obesity and comorbidities like diabetes and heart disease.21,22 The results of these studies highlights the need to reconnect public health and urban planning as a way to address many of the health needs of city residents.
By using a multi-scale set of contextual factors as explanatory variables, this research aims to explore the role of material contextual variables at the neighborhood level in explaining the spatial distribution of infant mortality rates in the Mexican city of Hermosillo. The analysis is not intended to make inferences about the individual-level impacts of these variables but to explore their spatial association at the neighborhood level.23 It is hypothesized that unplanned neighborhoods present adverse environmental conditions and generally have worse health indicators, and conversely, planned neighborhoods contain better environmental conditions and are healthier. Therefore, it is not expected that the health-built environment gradient will be homogeneous for all the variables across Hermosillo's neighborhoods. Consequently, the objectives of this research are threefold: a) to develop evidence for a material based explanation of public health in midsize Mexican cities, b) to identify the contribution of the built environment to urban health disparities, and c) to reflect on the role that a partnership between urban planners and health professionals could play reducing health disparities through the creation of healthier neighborhoods.
Materials and methods
Study area
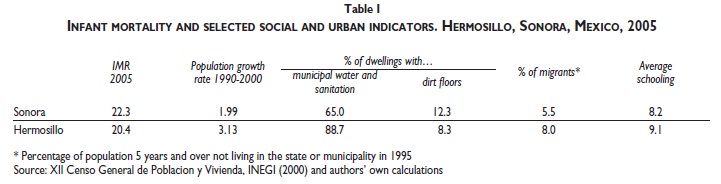
The city of Hermosillo, Mexico is located in the northwest portion of United States-Mexico border region. Hermosillo is a growing regional hub for trade, transportation, and specialized services, with a growing industrial base that includes an automotive assembly plant and approximately 30 maquiladora plants* that produce for the global market. During the last decade, the population of Hermosillo grew 3% annually, above the annual state and national averages. In 2010, Hermosillo has 784 322 inhabitants, up from 176 600 in 1970.
Estimating contextual factors
In order to characterize the spatial pattern of contextual factors, we derived a composite built environment vulnerability index (BEVI), which is aggregated by areal unit. In conceptualizing the index, we adopted a definition of vulnerability comprising risk and risk exposure on the one hand and adaptive behaviors on the other.26 Adaptive capacity is seen as a key concept from a planning and public policy perspective because highlights vulnerability as a social construct that can be modified through social, technological, institutional and cultural adaptive mechanisms. A composite index like this can be a valuable planning and public policy tool due to its capacity to summarize, contrast, and evaluate complex realities.
The index comprises the three dimensions that are often associated with the concept of the built environment: shelter conditions, neighborhood quality, and city connectivity. The final selection of components and data indicators for each dimension was based on conceptual relevance as indicated in the literature and as well on availability of appropriate data at the local level.11-12 Final calculations were performed using a set of variables extracted from the 2000 Mexican census and fieldwork conducted in 2004, as outlined in table II.
In constructing the BEVI, observations for each variable within the index were standardized to permit averaging as the items are measured in different units. Using a commonly utilized approach,27 we adjusted the observation for each item to take a value between 0 and 1 using the formula:
Cij= [Xij-minXi]/[maxXi-minXi]
where: Cij stands for the standardized observation associated with the ith component for census tract j; Xij stands for the value of the ith component in the index for census tract j; MaxXi and MinXi stand for the maximum and minimum values of the ith component for all census tracts in the city. If a given census tract presents a value for i equal to the minimum value in city j, the value for Cij would be zero. On the other hand, the greater the difference between a particular census tract and the minimum value of that same component in city j, the higher will be the value of Cij. Therefore, the value of Cij would range between 0 and 1. Once standardized values for each individual variable were obtained, we calculated the summary score corresponding to each dimension by averaging the value of the relevant individual indicators. In this analysis, we explore contextual impact using unweighted values. The composite index estimates the overall environmental context of the different census tracts as follows:
BEVIij = w1Shelterij + w2Communityij + w3Cityij,
where BEVIij is the degree of built environment vulnerability index for census tract i in city j with the requirement that âWi= 1.00, where wi represents weights assigned to each of the three dimension included in the index.
Identifying infant mortality hotspots
Records of infant deaths reported between 2000 and 2003 (n= 673) were obtained from the Health Department of the State of Sonora. Data on live births during the same period were obtained from the Sonora's civil registry (n= 46 105). All the information was integrated into a geographical information system, using boundary maps from the 2000 national housing and population census (INEGI). The research protocol was reviewed and approved by the Institutional Review Board of the University of Michigan and by the Bioethics Committee of El Colegio de Sonora.
A well-known difficulty with small geographical units such as census tracts is that they typically generate a low frequency of events such as births and deaths. As a result of this small area rates can be unstable, often producing disproportionately high figures.28,29 The problem of small areas can be overcome by adding time and/or enlarging geographical area units.29,30 The first strategy, named periodization, aggregates 2–5 years of data. The second, regionalization, consists of building larger areas from smaller ones based on physical adjacency and socioeconomic similarity. In this analysis, we used a combination of both strategies to calculate infant mortality rates at the neighborhood scale. Infant mortality rates were calculated by dividing the number of deaths of children under one year of age by the number of live births in the period of study.
Spatial analysis
The spatial analysis of infant mortality, as well as the analysis of the index of vulnerability, is based in two commonly used test statistics for spatial clusters, Moran's I (global and local) and the Gi* statistic proposed by Ord and Getis.31 These two statistics complement each other and preferably are used in combination. The Moran's I is a test for spatial autocorrelation and tells us if high and low infant mortality rates (IMR) are more clustered that would be expected by pure chance. To establish a significance test for the local Moran index, we used the method proposed by Anselin,32 a pseudo distribution simulation by permutation of the attribute values among the areas. Based on this pseudodistribution, statistical tests are used to indicate local index values with alpha 0.05, 0.01, and 0.001. The Gi* statistic complements the Moran's I because it indicates whether the clusters are resulting from the lumping of census tracts with high IMR or the lumping of census tracts with low IMR and reveals where the clusters are located. Hence, the combination of these two tests improve the analysis in that the Gi* statistics shows the location of high mortality clusters that often are referred in the literature as hot spots.33
Results
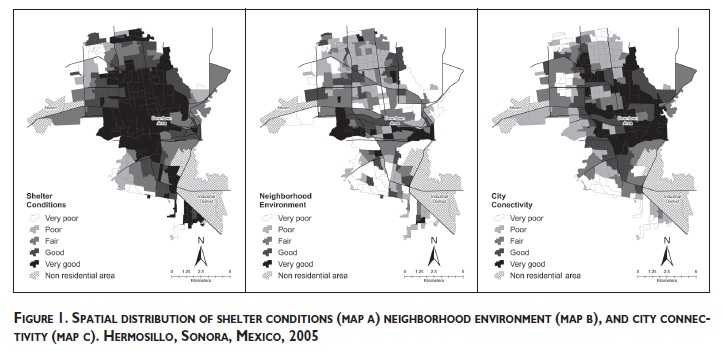
Maps representing the distribution of each dimension in the composite index of vulnerability were created and examined to assess whether there is any observable spatial pattern. As can be seen in figure 1, Hermosillo is a city of contrasts with neighborhoods in the central part showing better environmental conditions in terms of shelter (map A) and integration to the urban structure (map C) than peripheral neighborhoods. However, some central neighborhoods also face a lack of urban amenities and integration to the city, probably as a result of poor planning during its creation and/or chronic neglect by municipal authorities.
The composite index of vulnerability showed a significant spatial autocorrelation (Global Moran's I= 0.62, with significance of 99%), indicating substantial clustering. The Local Moran's I significance map (not shown) indicated four clusters, two of them related to low values of vulnerability (located at the center and northwest section of the city), and two related to high values of vulnerability (southeast and northeast sections).
The values of the Local Moran's I correlated very well with observable intraurban disparities in Hermosillo. The southeast section of the city had an explosive growth in recent times and corresponds to an area of non-regulated settlements that are occupied by migrant workers and poor families and have limited public investment and substandard housing. The northeast section is also an area comprised of irregular settlements, a high concentration of poor families, and precarious environmental conditions due to low quality housing, a lack of urban services, and a peripheral location. Because of their informal character, these neighborhoods were poorly planned and their physical conditions have improved slowly probably as a consequence of the limited fiscal and technical resources characteristic of most Mexican cities.
In contrasts, at the center of Hermosillo, the map showed a significant cluster of well-urbanized and wellserved neighborhoods inhabited mostly by middle class families. The cluster formed in the northwest area of the city has similar environmental characteristics and is comprised by neighborhoods where the wealthiest part of the population of Hermosillo lives. So far, local indicators of spatial autocorrelation were able to distinguish the intense intraurban disparities in the concentrations of wealth and poverty in Hermosillo.
The nature of these clusters was explored using Gi*, as presented in figure 2. Areas marked in dark gray indicate significant clusters with low values for IMR and BEVI, while areas marked in black indicate significant clusters with high IMR and BEVI1. Census tracts that did not form any type of cluster are marked in light gray.
Map A in figure 2 shows three significant clusters of high infant mortality; the first in the southwest fringe of the city, the second at the periphery of downtown, and the third in the northwest central section. These clusters are formed where census tracts with infant mortality rates exceed the city average by a factor of two or three. The cluster at the southwest section had the highest rates in the city. This map also displays several clusters with low infant mortality rates scattered throughout the city, though any of these clusters was statistically significant.
The distribution of environmental vulnerability can be seen in map B in figure 2. The central and northeast sections of Hermosillo host two large clusters with low vulnerability levels. These clusters contain most of the upper-class residential areas in the city, as well as downtown and other centrally located neighborhoods. Two large clusters of high vulnerability are apparent in the southwest and northwest corners of the city. As indicated earlier, most of the neighborhoods within these clusters are newly created settlements and even some keep a few semi-rural characteristics. High vulnerability is concentrated along the edge of the city where urban expansion adopts the form of unplanned growth.
A comparison of both maps shows that high levels of vulnerability and high mortality rates coincide spatially in the southeast corner of the city. The high mortality cluster in this location is contained completely within the high vulnerability cluster in the same section. However, this type of co-location is not valid for the two other high mortality clusters identified in the city, which coincide partially with a cluster of low vulnerability.
Discussion
Exploratory and confirmatory data analysis methods were used to assess the link between exposure to area vulnerability and infant mortality in neighborhoods of Hermosillo. Univariate and bivariate Moran's I were calculated for all the explanatory variables, the composite index of vulnerability and the dependent variable. All the explanatory variables were characterized by positive spatial autocorrelation, as well as the index. On the other hand, infant mortality rates, the dependent variable, displayed low levels of statistically significant spatial autocorrelation, indicating some degree of randomness in its spatial distribution. Overall, we found that the link between environmental conditions and health status remains elusive, suggesting in part, than a better model of this relation is probably complex and multifaceted.
Although the results obtained fail to confirm the expected association between vulnerability and infant mortality, the study identified hot spots of infant mortality within the city of Hermosillo. Two of the high infant mortality clusters are located within neighborhoods characterized by relative good environmental conditions and one in a neighborhood with a quite precarious environment.
Indeed, the cluster with the highest infant mortality rates in the city overlaps the cluster with the highest environmental vulnerability. The neighborhoods within this cluster have no parks, lack adequate public transportation, are far from medical facilities, housing is of poor quality and overcrowded, and basic sanitation and water are not available for most families. All of these conditions are clearly related to socioeconomic status and are well known predictors of poor health status. For example, poorly designed housing, constructed with low quality materials is associated with dampness, mold, allergens, and inefficient energy use. In turn, those are associated with poor respiratory health among infant and young children.34 In developing countries, the lack of transport and poor road conditions are closely related to many negative health outcomes.35 Transport cost and travel time can be a strong deterrent in the use of health services, even when care and treatment are desired.36 For many residents of the neighborhoods included in the cluster, walking can be the primary mode of transportation, especially during the night when the bus service is interrupted.
These results also underscore that exploratory analytical methods, such as univariate Moran's I and bivariate Moran's I, can provide an indication of the potential effect of contextual factors on health outcomes and the formation of risk areas within cities. As indicated earlier, there is increasing evidence that neighborhood context affect the health of individuals living therein and based in our results, it is not unreasonable to assume that through better data and more comprehensive models it can be possible to monitor neighborhoods material transformation and its impact on health. The primary advantage of this type of analysis is that spatial variations in morbidity and mortality can be spotted fairly quickly and correlated with such conditions. Caution is necessary, however, since the implementation of this type of analysis face substantial challenges.
First, a major challenge in studying the link between the built environment and community health is to have access to data on the built environment that are spatially matched and sufficiently detailed to connect with specific health outcomes. As suggested by Cummins,7 specific health outcomes are connected with specific physical and social features of neighborhoods, and only through the connection of this specificity is it possible to reconstruct the causal pathway between health and context. As this study has shown, the advances in the use of GIS to derive measures of the built environment from a variety of existing data sources are making it easier to spatially tie detailed health data with specific data on the built environment. Still, the datasets available in Mexico are generally limited to a few basic elements which not necessarily relate to factors conceptually and practically relevant from a social epidemiology perspective. The high mortality rates observed in some middle class neighborhoods in Hermosillo could be the reflection of the exposure to other environmental factors that were not included in the construction of BEVI, such as closeness to industrial facilities, availability of safe water, or air pollution.
Finally, the use of census tracts as neighborhood surrogates and the lack of alternate geographies (e.g. urban blocks) to conduct sensitivity analysis let unsolved the so called modifiable areal unit problem (MAUP). The MAUP refers to sensitivity of results to the size and form of the areal units for which data was collected and that is common to ecological studies focusing on spatial variations of disease and mortality.33 Despite the advances observed in recent years, datasets featuring information on exposure and outcome variable still limited in Mexico. In our case, this difficulty limited our ability to perform such analysis. It is possible that the spatial pattern of infant mortality in Hermosillo reflects a mixed residential development, with households of lower social status located within census tract above the city average, as noted elsewhere.37 Moreover, it is likely that using smaller units, such as urban blocks, we could have detected stronger associations and patterns not easily detected at the census tract scale.38
Conclusions
This study provides some evidence of the link between neighborhood material conditions and community health in Hermosillo. As indicated above, city neighborhoods reporting high infant mortality prevalence are more likely to be low income residential areas formed in recent times. They also tend to be poorly planned and lack basic urban services such as running water and sanitation. Current urbanization trends in Hermosillo, including urban sprawl and fragmentation, induce levels of geographical isolation that might increase the difficulties of the poor to benefit from the advantages of urban living. This evidence also underscores the need to reconnect public health and city planning. After all, the slum-dwelling conditions created by rapid industrialization and urbanization in some Hermosillo's neighborhoods are not too distant from the conditions that gave rise to the close connection between urban planning and public health at the end of the 19th century.39
Urban planners and public health professional must collaborate again to improve current and future health outcomes in Hermosillo through the design and planning of healthier neighborhoods including adequate housing, parks, community health centers, and, in general, decent living conditions. Ultimately, this will require a long-term effort toward the creation of a transdisciplinary conceptual framework allowing planners and public health professionals to embrace the concept that health and social and material environments are closely linked.4,23,39
Acknowledgements
The authors acknowledge the support of the National Council for Science and Technology (CONACYT) in Mexico and the National Institute of Health (Grant #TW006489) funded by the Fogarty International Center and the Office of Behavioral and Social Sciences Research in the United States.
References
1. Coen S, Ross N. Exploring the material basis for health: characteristics of parks in Montreal Neighborhoods with contrasting health outcomes. Health Place 2006;12:361-371. [ Links ]
2. Freudenberg N, Galea S, Vlahov D. Beyond urban penalty and urban sprawl: back to living conditions as the focus of urban health. J Community Health 2005;30 (1):1-11. [ Links ]
3. Diez-Roux A. Bringing context back into epidemiology: variables and fallacies in multilevel analysis. Am J Public Health 1998;88:216-222. [ Links ]
4. Northridge M, Sclar E. A joint urban planning and public health framework: contributions to health impact assessment. Am J Public Health 2003;93(1):118-121. [ Links ]
5. Cummins S, Macintyre SA, Davidson S, Ellaway A. Measuring neighborhood social and material context: generation and interpretation of ecological data from routine and non-routine sources. Health Place 2005;11:249-260. [ Links ]
6. Macintyre S, Ellaway A, Cumming S. Place effects on heath: how can we conceptualize, operationalize and measure them? Soc Sci Med 2002;55:125-139. [ Links ]
7. Macintyre S, Maciver S, Sooman A. Area, class and health: should be focusing on place or people? J Soc Policy 1993;22(2):213-234. [ Links ]
8. Diez-Roux A. A glossary for multilevel analysis. Epid Bull 2003;24(3). [ Links ]
9. Morgenstern H. Ecologic studies in epidemiology: concepts, principles, and methods. A Rev of Public Health 1995;16:61-81. [ Links ]
10. Diez-Roux A. Investigating neighborhood and area effects on health. Am J Public Health 2001;91(11):1783-1789. [ Links ]
11. Hillemeier M, Lynch J, Harper S, Casper M. Measuring contextual characteristics for community health. Health Services Research 2003;38:6 [ Links ]
12. Yen I, Kaplan G. Poverty area residence and changes in depression and perceived health status: evidence from the Alameda County Study. Int J Epidemiol 1999;28(1):90-94. [ Links ]
13. Frankenberg E. The effects of access to health care on infant mortality in Indonesia. Health Trans Rev 1995;5:143-163 [ Links ]
14. Rip M, Keen C, Woods D. Intra-urban variations of neonatal and postneonatal mortality in a developing city. Soc Sci Med 1987;25:889-894. [ Links ]
15. Fayissa B. The determinants of infant and child mortality in developing countries: The case of Sub-Sahara Africa. Rev Black Polit Econ 2001;29(3):83-89 [ Links ]
16. Maas J, Verheij RA, Groenewegen PP, de Vries S, Spreewenberg P. Green space, urbanity and health: how strong is the relation? J Epidemiol Community Health 2006;60:587-592 [ Links ]
17. Sick-Nielsen T, Bruun-Hansten K. Do green areas affect health? Results from a Danish survey on the use of green areas and health indicators. Health and Place 2007;13(4):839-850 [ Links ]
18. van den Berg AE, Maas J, Verheij RA, Groenewegen PP. Green space as a buffer between stressful life events and health. Soc Sci Med 2010;70(8):1203-1210. [ Links ]
19. Walker C. The public value of urban parks. The Urban Institute, The Wallace Foundation 2004: 1-8. [Accessed February 15, 2011] Available at: http://www.urban.org/uploadedPDF/311011_urban_parks.pdf. [ Links ]
20. Baylina M, Prats M, Ortiz A. Espacios de juego como escenarios educativos urbanos. Ciudades 2005;67:20-24. [ Links ]
21. Handy SL, Boarnet MG, Ewing R, Killingsworth RE. How the built environment affects physical activity: views from urban planning. Am J Prev Med 2002; 23(2 Suppl):64-73. [ Links ]
22. Booth KM, Pinkston MM, Carlos-Poston WS. Obesity and the built environment. J Am Diet Assoc 2005;105:S110-S117. [ Links ]
23. Idrovo A. Three criteria for ecological fallacy. Environmental Health Perspective 2011; 119:a332-a332. [Accessed 2011 December] Available at: http://dx.doi.org/10.1289/ehp.1103768 [ Links ]
24. Instituto Nacional de Estadística y Geografía (INEGI). Censo de Población y Vivienda 2010. Resultados preliminares. México: INEGI, 2010. [ Links ]
25. Consejo Nacional de Población. Índices de Desarrollo Humano, 2000. México: CONAPO, 2001. [ Links ]
26. Bohle H, Downing T, Watts M. Climate change and social vulnerability: the sociology and geography of food insecurity. Global Environmental Change 1994;4:37-48. [ Links ]
27. Briguglio L. Preliminary study on the construction of an index for ranking countries according to their economic vulnerability. Geneva, Switzerland: UNCTAD/LDC/Misc, 1992:4. [ Links ]
28. Whitman S, Silva A, Shah A, Ansell D. Diversity and disparity: GIS and small-area analysis in six Chicago neighborhoods. J Medical Syst 2004;28:397-411. [ Links ]
29. Auffrey C. Mapping disparity in infant mortality: using technology to describe local dimensions of infant deaths. Illn Crises Loss 1999;7:64-76. [ Links ]
30. Coulton CJ. Vital records: a source for neighborhood indicators. The Urban Institute. [Accessed July 31, 2006] Available at: http://www2.urban.org/nnip/pdf/vitalrec.pdf [ Links ]
31. Ord JK, Getis A. Local spatial autocorrelation statistics: distribution issues and an Application. Geographical Analysis 1995;27(4):286-306. [ Links ]
32. Anselin L. Local indicators of spatial association. Geogr Anal 1995;27(2):93-115 [ Links ]
33. Wang, F. Quantitative methods and application in GIS. Boca Raton: Taylor and Francis, 2006. [ Links ]
34. Matte T, Jacobs D. Housing and health: current issues and implications for research and progress. J Urban Health 2000;77:7-25. [ Links ]
35. Dora C, Phillips M (Ed). Transport, environment and health. World Health Organization. Regional Office for Europe. 2000. [Accessed February 20, 2011] Available at: http://www.euro.who.int/data/assets/pdf_file/0003/87573/E72015.pdf. [ Links ]
36. Lule G, Ssembatya M. Intention to deliver and pregnancy outcomes, International Development Research Center, [Accesed February 20, 2011] Available at: http://www.idrc.ca/en/ev-28387-201-1-DO_TOPIC.html. [ Links ]
37. Alvarez-Hernandez G, Lara-Valencia F, Castro-Reyes PA, RascónPacheco RA. An analysis of spatial and socio-economic determinants of tuberculosis in Hermosillo, Sonora. 2000-2006. Int J Tuberc Lung Diseas 2010;14(6):708-713 [ Links ]
38. Krieger N, Waterman PD, Chen JT, Soobader MJ, Subramanian SV. Monitoring socioeconomic inequalities in sexually transmitted infections, tuberculosis, and violence: geocoding and choice of area-based socioeconomic measures—The Public Health Disparities Geocoding Project (US). Pub Health Rep 2003;118:240-260. [ Links ]
39. Corburn J. Confronting the challenges is reconnecting urban planning and public health. Am J Public Health 2004;94(4):541-545. [ Links ]
 Corresponding author:
Francisco Lara-Valencia.
School of Transborder Studies, Arizona State University, Tempe, USA.
E-mail: francisco.lara@asu.edu
Received on: July 19, 2011
Accepted on: February 23, 2012
Declaration of conflict of interests: The authors declare that they have no conflict of interests.
* A maquiladora is a foreign owned/operated factory or assembly plant established in Mexico under preferential tariff programs created to encourage the development of industry in Mexico.
1 Although the normality of Gi* depends partially on the number of neighborhoods, following the convention, it is assumed that index is normally distributed. Significant census tracts are those with zvalues of 1.96 or greater, the 95% significant level for a two-tailed distribution.

