


Servicios Personalizados
Revista
Articulo
 Inglés (pdf)
 Artículo en XML
 Referencias del artículo
 Enviar artículo por email
Indicadores
-
 Citado por SciELO
 -
 Accesos
Links relacionados
-
 Similares en
SciELO
Similares en
SciELO
Compartir

 Permalink
Salud Pública de México
versión impresa ISSN 0036-3634
Salud pública Méx vol.53 supl.2 Cuernavaca ene. 2011
ARTÍCULO ORIGINAL
Household catastrophic health expenditures: a comparative analysis of twelve Latin American and Caribbean Countries
Gastos catastróficos en salud de los hogares: un análisis comparativo de doce países en América Latina y el Caribe
Felicia Marie Knaul, PhD EconI, III; Rebeca Wong, PhD EconIV; Héctor Arreola-Ornelas, M Health EconII, III; Oscar Méndez, AnalisII, III; Ricardo Bitran, PhD EconV, VI, XVII; Antonio Carlos Campino, PhD EconVII, XVII; Carmen Elisa Flórez Nieto, PhD EconVIII, XVII; Roberto lunes Fontes, PhD EconVII, IX, XVII; Ursula Giedion, PhD EconIX, XVII; Daniel Maceira, PhD EconX, XVII; Magdalena Rathe, PhD EconXI, XVII; Martin Valdivia PhD EconXII, XVII; Juan Rafael Vargas, PhD EconXIII, XVII; Juan José Díaz, PhD EconXII, XVII; María Dolores Montoya Díaz, PhD EconVII, XVII; Werner Valdes, BA EconXIV, XVII; Ricardo Valladares Carmona, BA EconXV, XVII; Maria Paola Zuniga, PhD EconXIII, XVII; Liv Lafontaine, BA EconII, III, XVII; Rodrigo Muñoz, EngV, VI, XVII; Renata Pardo, M Econ,XVI, XVII; Ana María Reynoso, M EconX, XVII; María Isabel Santana, BA EconXI, XVII; Rosa Vidarte, BA EconXII, XVII
IHarvard Global Equity Initiative, Harvard University, USA
IICompetitividad y Salud, Fundación Mexicana para la Salud, Mexico
IIIObservatorio de la Salud, Instituto Carlos Slim de la Salud y Fundación Mexicana para la Salud, Mexico
IVUniversity of Texas Medical Branch, USA
VBitran y Asociados, Chile
VIFederación Interamericana de Economía de la Salud, Chile
VIIUniversidad de Sao Paulo, Brazil
VIIIUniversidad de los Andes, Colombia
IXBanco Interamericano de Desarrollo, USA
XCentro de Estudios de Estado y Sociedad, Argentina
XIFundación Plenitud, Dominican Republic
XIIGrupo de Análisis para el Desarrollo, Peru
XIIIUniversidad de Costa Rica, Costa Rica
XIVMinisterio de Salud, Bolivia
XVIndependent Consultant, Guatemala
XVIDirección General de Planeación del Ministerio de la Protección Social, Colombia
XVIINetwork on Health Financing and Social Protection in Latin America and the Caribbean (LANET)
RESUMEN
OBJETIVO: Comparar los patrones de gastos catastróficos en salud en 12 países de América Latina y el Caribe.
MATERIAL Y MÉTODOS: Se estimó la prevalencia de gastos catastróficos de manera uniforme para doce países usando encuestas de hogares. Se emplearon dos tipos de indicadores para medir la prevalencia basados en el gasto de bolsillo en salud: a) en relación con una línea de pobreza internacional; y b) en relación con la capacidad de pago del hogar en términos de su propia canasta alimentaria. Se estimaron razones para comparar el nivel de gastos catastróficos entre subgrupos poblacionales definidos por variables económicas y sociales.
RESULTADOS: El porcentaje de hogares con gastos catastróficos variaron de 1 a 25% en los 12 países. En general, la residencia rural, el bajo nivel de ingresos, la presencia de adultos mayores, y la carencia de aseguramiento en salud de los hogares se asocian con mayor propensión a sufrir gastos catastróficos en salud. Sin embargo, existe una marcada heterogeneidad por país.
CONCLUSIONES: Los estudios comparativos entre países pueden servir para examinar cómo los sistemas de salud contribuyen a la protección social de los hogares en América Latina.
Palabras clave: gastos en salud; protección social en salud; salud; América Latina
ABSTRACT
OBJECTIVE: Compare patterns of catastrophic health expenditures in 12 countries in Latin America and the Caribbean.
MATERIAL AND METHODS: Prevalence of catastrophic expenses was estimated uniformly at the household level using household surveys. Two types of prevalence indicators were used based on out-of-pocket health expense: a) relative to an international poverty line, and b) relative to the household's ability to pay net of their food basket. Ratios of catastrophic expenditures were estimated across subgroups defined by economic and social variables.
RESULTS: The percent of households with catastrophic health expenditures ranged from 1 to 25% in the twelve countries. In general, rural residence, lowest quintile of income, presence of older adults, and lack of health insurance in the household are associated with higher propensity of catastrophic health expenditures. However, there is vast heterogeneity by country.
CONCLUSIONS: Cross national studies may serve to examine how health systems contribute to the social protection of Latin American households.
Key words: Health expenditures; social policy; health; Latin America
Lack of financial protection in health is a widespread problem plaguing most of the Latin America and Caribbean (LAC) region. The effect of this lack of protection is that families can suffer the burden of the illness but also the economic ruin and impoverishment of financing their care, yielding increased poverty in the short and long run. International recognition of this challenge to health systems has been growing, spurred by the World Health Report 2000.1 Academic work and national and international policy efforts increasingly recognize the importance of evaluating health system performance and financing to achieve greater financial protection.2-22
Direct, out-of-pocket (OOP) payment for health at point of service is considered the most inefficient and inequitable means of financing a health system1. In these systems there is little room for risk pooling, competition among providers is reduced, and patients pay more than they would with a prepayment scheme due to the fragmentation of risk and the urgency of treatment. In these systems, the greatest burden tends to be placed on the family. If the cost of care exceeds the ability to pay at the time of service, catastrophic and potentially impoverishing expenditures arise or necessary care is forgone. Families are often forced to choose between satisfying other basic needs such as education, food and housing, or purchasing health care and saving loved-ones from illness, suffering and often shortening life spans. Thus, health spending can be an important additional source of poverty.2,10,17,23-24 If households cannot insure against health shocks, this phenomenon may have both long as well as short-run implications.10,25-26Yet in many LAC countries, financial protection for health continues to be segmented and fragmented. Large parts of the population are excluded from access to public pre-payment options such as social security, and resort to paying directly and out of pocket.27 This paper analyzes the distribution of the effects of lack of financial protection expressed through the prevalence of catastrophic and impoverishing expenses, across a sample of 12 countries in the region -Argentina, Bolivia, Brazil, Chile, Colombia, Costa Rica, Dominican Republic, Ecuador, Guatemala, Mexico, Nicaragua and Peru.
The key research questions analyzed in this paper are: 1) Do countries differ in the extent to which people suffer extreme or catastrophic health payments? 2) Which population sub-groups are most severely affected by catastrophic health payments? 3) Does a pattern of differential catastrophic spending by certain sub-groups emerge across the countries in the study? and, 4) Can these basic results be linked to specific features of the health care systems suggesting avenues for further research? Cross-national and cross-cultural research provides an opportunity to enhance understanding of multiple schemes and their consequences in terms of wellbeing of the population but this type of research is under-utilized.28 Adequate data and the use of methodological approaches that are comparable across countries is needed, both of which are often difficult to obtain. This paper provides a first look at the analytical potential of the comparative approach and generates hypotheses about the relative vulnerability of the different sub-groups with a cross-national comparative perspective. The paper adds to the existing literature on catastrophe from health spending by stratifying the analysis by specific population groups within countries. In addition, for several of the countries there are no published papers on the level or distribution of catastrophic spending, and they have not been part of previous comparative work on health spending. For comparative work, refer to 1,4-7,10,14-16,29-30
The twelve countries included in this comparative paper differ greatly in population size and structure, level of economic development, stage of demographic transition, and health care system organization and financial protection. With respect to population size, the countries range from Brazil with 189 million to Costa Rica with only 4.4 million. According to 2008 data, the study countries include 486 million people and account for 85% of the population of the LAC region. The majority of countries in the sample are largely urban with the highest rates in Argentina, Brazil, and Chile all close to 90%. Still, the smaller and poorer countries tend to have lower levels and Guatemala stands out at 49%. Other than Guatemala at 2.5%, the rates of growth of the populations are all below replacement, ranging from 1.9% per year in Bolivia to 1% in Chile and Mexico. All countries have experienced large drops in mortality and fertility rates, with consequential aging of the population.30 While the majority of countries enjoy life expectancy at birth well over 70 years and in Costa Rica it is 78, the figure is 66 in Bolivia and 70 in Guatemala. Of particular importance for this paper, the countries differ also in the levels of expenditure and the mechanisms offered to provide health care to their populations.
While varied, and despite ongoing reform of several health financing systems and most notably in Chile, Colombia, Mexico and the Dominican Republic, the systems are still characterized by fragmentation. This means that multiple systems interact to provide health care.10,31 In addition, within each system, different forms of pooling risk exist and the poor, informal and rural populations are often excluded from formal insurance, prepayment or risk pooling schemes.32-34 Notable exceptions are the single social insurance provider in Costa Rica and the systems in Colombia and Mexico that offer specific insurance options for all populations.2-3,17,35-37 With respect to the level of government spending on health as a share of GDP, Peru is the lowest at 4.3% compared to the highest 10% for Argentina. Brazil, Argentina, Dominican Republic, Ecuador, Guatemala and Mexico all have health systems in which private expenditures account for 50% or more of total health spending and in most countries the majority is out-of-pocket. Only Colombia has a notably low rate.38 This brief summary portrays the heterogeneity of countries in the study, setting the stage for our comparative analysis. Thus, in the analyses of catastrophic health expenditures that follow, we expect a wide range of variation in the relative exposure of population subgroups across these countries.
The work in this paper derived from a multi-site project titled 'Health Financing and Social Protection in Latin America and the Caribbean,' coordinated by the Mexican Health Foundation. This project began in mid 2007 including 7 countries and was initially financed by the International Development Research Center of Canada. The LAC Health Observatory, an inter-institutional project of the Carlos Slim Health Institute and the Mexican Health Foundation, later provided additional support to include other countries and develop a LAC research network on financial protection. The multi-site team that worked on this paper included local investigators, seeking to obtain comparable results across the countries. This labor-intensive feature of the project maximized the potential for systematic comparisons across the countries. The research teams discussed variable definitions, analysis units, and programming codes, ultimately using the same programming tools and codes to obtain tabulations. Country teams prepared their own data base, using common programs to produce their respective tabulations for this paper. Survey instruments and methods were analyzed to identify differences across countries. The overall project included in-depth country studies to explore the organization of health system financing in each country, which complement and provide background for the quantitative analysis presented here. Thus, the data and analyses in this paper draw on country-specific work and background papers available from the authors.
Material and Methods
Study Design
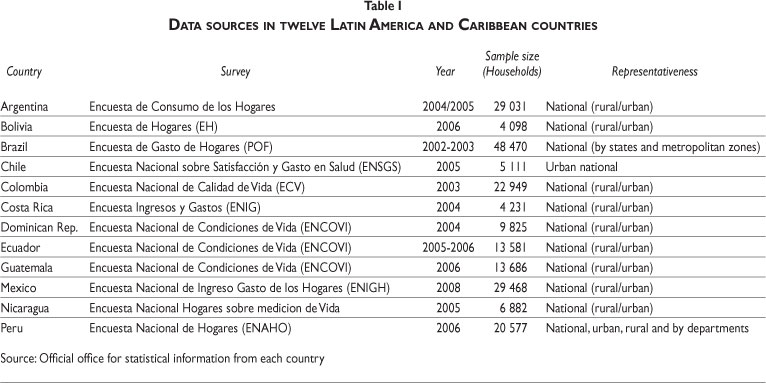
Each of the twelve participating country research team selected the most appropriate available household survey that met the requirements of the study. We gave high priority to using surveys with detailed measures of expenditures at the household level, disaggregated by type of expenditure such as health care or food, and basic socio demographic information on the household. Table I presents a description of the selected surveys, which varied in design and purpose. For example, the data for Bolivia, Brazil, Mexico and Peru were derived from household expenditure surveys; in the surveys for Colombia, Costa Rica, Dominican Republic, Ecuador, Guatemala and Nicaragua the objective was to measure social and quality of life conditions, such as income and poverty. The Argentina and Chile surveys were designed to measure health care utilization and expenditures. Further, unlike the others, the survey for Chile cover only the urban areas of the country thus no analysis of rural / urban differences is possible for Chile, constraining the comparability with other surveys. Through detailed group analysis of the results for each country and efforts to standardize variable definitions, the researchers sought to minimize the impact of these differences in survey design on the comparative results.
Definition of study variables
We constructed a core set of variables: total household expenditures, health care expenditures, and household characteristics such as household size, area of residence, household composition by age of its members, and availability of health insurance. By agreeing on a core set of variables and carefully reviewing differences across surveys, we constructed variables that were strictly comparable across countries.
Catastrophic Health Expenditures. We used two indicators to assess the prevalence of catastrophic health care expenditures as follows:
a) The basic indicator 'CHE1' is calculated as out of pocket payments for health as proportion of income or total expenditures in a given period of time. We use total health expenditures as the numerator. We adopted a common convention and used as the denominator total household expenditure net of food spending, which better captures the effect of health expenditures on disposable income.39-40
b) The second indicator 'CHE2' (type Wagstaff and vanDoerslaer) uses a slightly different definition for the denominator, as the total household expenditure net of a standard value: subsistence expenditures equivalent to a poverty line of $1 USD PPP (international purchasing power parity dollar). This convention has been adopted by several authors.24
Both indicators aim to capture the same concept of health expenditures but the difference is in the point of reference to define the expenditures as catastrophic. CHE1 uses as reference the capacity to pay based on net income of the household after meeting the basic needs of food. On the other hand, CHE2 uses as reference an international standard of subsistence, to maximize the ability to make cross-country comparisons. For our purposes, a household is defined as having incurred catastrophic health expenditures if the out of pocket health share exceeds 30% of the point of reference. In addition, for CHE2 any expenditure by poor households, that is, households below the $1 USD PPP line, is considered a catastrophic expenditure since households are already poor. Thus by definition CHE2>=CHE1.
Stratification variables
We calculated the prevalence of catastrophic health care expenditures among households in each country, and by sub-groups of the households according to the following stratification variables: Area of residence -urban or rural. Household composition in categories according to the age of members -with at least one child (of 5 years old or younger) but no elderly (60 or more years old), with at least one elderly but no children, with both children and elderly members, and with neither children nor elderly members. Household size according to the number of members in three categories: large (5 or more members), medium (3-4 members), and small (2 or fewer). For health insurance, we classified households as 'yes' if at least one adult member of the household had coverage and as 'no' if no member of the household had health care coverage. Finally, we classified households by income using the total expenditures of the household using quintiles of the distribution in each country (poorest to richest).
Methods
Levels of health spending in a country depend on the composition of the population (for example by household sizes, or by age of its people). Thus we used a standardized measure of the total prevalence of catastrophic health expenditures to maximize the potential for comparability. We took the distribution of the households by household size in the sum of all countries as the standard population. This method holds constant the distribution of the population, and differences in health spending across countries can be attributed to factors other than the differential composition of their populations.
The variation in the surveys available and the methodology for gathering data on health expenditure in each survey constrained the direct comparability of measures across countries. To overcome this feature at least partly we compared across sub-groups within each country (for example large versus small households). These comparisons are appropriate assuming that the survey captured health payments by the households of the various sub-groups equally in each country. Thus we calculated the prevalence of catastrophic health expenditures for the total of households in each country, and by sub-groups defined by the stratification variables. We obtained point and interval (95%) estimates of prevalence. For each country we then constructed ratios of prevalence of catastrophic health expenditures across categories of the stratification variables, in order to assess whether some strata of the population show relatively higher exposure than others. Using the interval estimates for each of the sub-groups in a given ratio, we assess whether the ratio of the two estimates is significantly different than one. This forms the basis for the comparisons across countries. For example, if the ratio of prevalence among households with older adults divided by the prevalence among those without older adults is 1.3 in country A and 2.5 in country B, and the respective intervals do not overlap, then we conclude that, relative to households without older adults, households with older adults in country B are more likely to report catastrophic health expenditures than those in country A. Thus households with older adults seem more exposed to financial health risk and lack financial protection in B than in A.
Results
Table II presents descriptive statistics using the survey samples for the twelve countries. The proportion of rural households ranges from a high in Guatemala (46%) and Nicaragua (42%) to 15% in Brazil and 7% in Argentina. Recall that the Chile sample includes only urban areas. The proportion of households that have at least one elderly member ranges from a high of 30% in Chile and Peru, and 25% in Argentina, to a low of 15% in Bolivia and 18% in Costa Rica. Household size is on average the largest in Nicaragua and Guatemala, where more than 50% of households have 5 or more members. With respect to health insurance coverage, the range is from 27% of households reporting coverage in Brazil and Bolivia, to 90% in Costa Rica.
Table III presents the prevalence of catastrophic spending according to the two indicators CHE1 and CHE 2. The unstandardized prevalence of catastrophic health expenditures varies across the countries in the study and depending on the indicator. For CHE1 they range from 0.4% in Costa Rica to around 2-5% in Colombia, Bolivia, Brazil, Mexico and Peru, to around 7-11% in Argentina, Dominican Republic, Ecuador, Guatemala and Nicaragua. The standardized figures yield similar relative ranking of the countries. Costa Rica presents very low prevalence, while Guatemala shows the highest prevalence of catastrophic expenditures.
Rural versus Urban Residents. We compared the percent of households with catastrophic expenditures in rural areas to those residing in urban areas for each country (except for Chile). Recall that a value greater than 1.0 for the ratio implies that catastrophic spending is more common in the numerator group (rural areas) relative to subsistence or disposable income than in the denominator group (urban areas). In all countries in the study other than Argentina, catastrophic expenditures are more prevalent in rural than in urban areas and these differences are statistically significant in almost all cases (Table IV). Costa Rica and Dominican Republic have the lowest ratios, implying a smaller difference between rural and urban areas. Peru, Guatemala and Brazil have moderate ratios compared to the rest of the countries. Bolivia, Colombia, Mexico, Nicaragua and Ecuador show the largest gaps between rural and urban households with prevalence of around 2-4 times in rural households compared to the prevalence in urban areas.
Poor versus Rich Households. We contrasted the percent reporting catastrophic health expenditures in the poorest quintile compared to that in the richest quintile. Ratio values greater than 1.0 mean that the poorest households are more exposed to having catastrophic health expenditures compared to the richest households. CHE2 provides a clearer pattern, and in all countries except Chile the percent with catastrophic health expenditures is higher among poor households (Table IV). For CHE1 the ratios are lower and for several countries below 1. The poorer countries (such as >Nicaragua and Ecuador) tend to have greater differentials, particularly for CHE2. Bolivia shows a very high difference of 28 times the prevalence among poorest compared to households in the richest income quintile and between CHE1 and CHE2 which may point to difficulties with these data.
Age of Household Members. For this contrast, we present the ratio of the percent of households reporting catastrophic health expenditures in each group, using as reference the group of households with neither children nor elderly members. In general, countries have higher exposure to catastrophic health expenditures among households with children compared to households with no children and no elderly (Table IV). Still, the results vary across countries and are less marked for CHE1 than CHE2. For 10 of the 12 countries using CHE2, households with children tend to be more exposed to financial crisis from health spending, with statistically significant differences in 9 of these countries.
All 12 countries have higher levels of catastrophic health expenditures among households with elderly members compared to households with no children and no elderly, and this holds for both indicators. The ratios are particularly high for Argentina, Costa Rica, Dominican Republic and Mexico. The results also show that for CHE2 all countries have higher propensity of catastrophic health expenditures among households with children and elderly compared to households without either group (Table IV). For CHE1 almost all countries also have ratios over 1. In Argentina, Dominican Republic, Ecuador, Guatemala and Nicaragua the ratios are approximately 2:1, and in the remaining countries the ratios are substantially higher. Overall, the results suggest that the propensity to suffer catastrophic health expenditures tends to be higher for families with young children, and more so for families with elderly household members. Household Size. We present the ratio of catastrophic health expenditures among medium and large households relative to the percent among small households. In most countries, households with 3-4 members are less likely to experience catastrophic health expenditures than small households of 1-2 members (Table IV). The exceptions are Bolivia and Nicaragua where the ratio is above 1 for CHE2, although these are not statistically significant. In all countries with the exception of Argentina and Dominican Republic, but only for CHE2, large households have higher prevalence of catastrophic health expenditures than small households. The gap is largest in Bolivia and Nicaragua. Health Insurance Coverage. We compare the prevalence of catastrophic health expenditures by whether or not the household includes an insured household member (Table IV). For the majority of the countries, the propensity to incur in catastrophic spending is, as expected, higher among households without insurance and the results are largely consistent for both CHE1 and CHE2 and statistically significant. The exceptions are Argentina and Chile, Costa Rica and Peru (with a ratio close to 1.0 for CHE2).
Discussion
We assessed the extent to which households in Latin America suffer catastrophic health expenditures with a focus on the relative risk for sub-groups of the population in each of the countries. We defined these groups according to characteristics that suggest similar conditions or lifestyles, for example level of income. Our approach aimed to make cross-country comparisons to enhance the results obtained from one single country and to maximize the impact of the results obtained. Since populations in each country are exposed to different socioeconomic and health sector contexts, cross-national comparisons helped us draw general conclusions about the relationship between certain population traits and the risk of suffering catastrophic health expenditures, increasing the precision of a given policy conclusion.
Thus our comparative results can be interpreted as a measure of how certain groups are more susceptible to suffer catastrophic expenditures than others across countries. Although as mentioned, our emphasis is not on absolute levels, the prevalence of catastrophic spending by households portrays a heterogeneous set of countries. We find absolute values of prevalence that vary widely, from less than 1% of households in Costa Rica and 2% in Brazil (two countries where social security covers the large majority of the population), to 10-15% of households in Nicaragua, Guatemala, Dominican Republic, Argentina, and urban Chile.
The results on the relative levels across subgroups show patterns that are important for policies targeted to improve the equity of health financing in these countries (Table V). First, it is clear that for all countries, certain groups of the population are more exposed to catastrophic expenses and these groups can be identified and targeted in each country. Second, there are common attributes that define high risk of catastrophic expenses for the region: households in rural areas, uninsured, poor households, and households with children or with elderly members. Some of the results are consistent with previous literature5-7,10, 29,33-34 but our work also finds a systematic high risk for rural households and among households with elderly members (with or without children).5 While this pattern may reflect expensive health care needs of older adults, the presence of elderly members in the household may reflect a coping mechanism of poor households, who may recourse to co-residence with elderly family members to meet consumption needs. Similarly, large households seem more likely to incur in catastrophic expenses, and this type of living arrangement could be a coping mechanism sought by many poor households for economic survival.
The differences between uninsured/insured house-holds are not as great as might be expected if insurance were effectively protecting households from spending out of pocket. While these results are somewhat surprising, it may indicate that households with insurance are spending out-of-pocket for uncovered expenses such as medications, or in order to avoid long waits. Furthermore, uninsured households may forego health spending and thus not incur in financial catastrophe, although they may be subject to greater health catastrophe as a result of avoiding timely care. Another important aspect is that insured populations may be self-selected. Lack of insurance may be an indicator of particular types of households that also have a different attitude towards spending on health care. This may be true for some countries more than others, in particular in those countries in which insurance is a matter of choice. Moreover, health insurance varies tremendously across countries. Thus for example, in some countries coverage may represent almost zero expenditures out of pocket while it may represent large out of pocket expenses in others.
Another important conclusion of this collective work is that the indicator used for catastrophic health expenditures can affect substantially the results; this was evident from using two indicators: out of pocket health share (CHE1) and health expenditures net of a standard value (CHE2). Once again, the absolute values obtained with the two indicators are expected to differ, by definition, but our use of the relative standing of different groups took into account this possible source of variation. For countries with particularly high rates of absolute poverty, CHE1 may actually show more catastrophic spending among the richest compared to the poorest households as was the case in Bolivia, Peru and Guatemala. With the measure that takes into account spending on health at any level by families living below the poverty line, the result is the opposite as shown by the high differentials found. Additional support for this explanation comes from the results for Brazil, Colombia, Guatemala and Mexico where the ratio for the first indicator, though greater than 1.0, is much lower than for the second. In addition, we may be capturing non-spending by poorer households who cannot pay for health care and thus are exposed to even greater health crises.
As is typically true for cross-national comparisons, the greatest challenge for this study was the comparability of data across countries. The data sets for the various countries were not designed with cross-country comparisons in mind. Thus there were important differences in field protocols, concepts and wording and design of questionnaires. It would be advantageous to apply a standard battery of questions in all countries for the analysis of health care spending. This convention would greatly facilitate cross-country analyses, but this harmonization effort also can potentially improve the quality of the national data sets. This collective effort would require concerted action, and could be led and financially supported by organizations such as the World Health Organization and its regional arm the PanAmerican Health Organization, and financial institutions such as the Interamerican Development Bank and the World Bank.
This paper reflects the effort by a collection of country-specific research teams that committed to harmonizing variables across the data sets to facilitate comparisons. One limitation is that the measure used for expenditures and to calculate prevalence of catastrophic health expenditures assumes that households facing potentially large medical expenditures sacrifice consumption. The definition ignores the differential ability of households to draw from savings, assets, family transfers, or other coping mechanisms to protect consumption of other goods. Previous research has argued that this approach can provide a misleading idea of the consequences for impoverishment of health shocks, in particular in the short run.15,26 This can be especially relevant in populations where informal coping mechanisms are common, which can be the case in many of the societies represented by the study countries, and these mechanisms may further differ across sub-groups in a country or across countries. Future research on this line of work could seek to improve on these features of the data samples, and assess more accurately the impact of health shocks on the economies of households in poor societies. Considering longer time horizons of health expenditures and longitudinal data on patterns over time will be essential for answering these questions. Are the same households exhibiting catastrophic expenses over time? For how long?
Our limitations notwithstanding, the approach used to quantify and compare the patterns of catastrophic health care expenditures contributes to our understanding of the groups that most need additional financial protection to prevent the consequences of health shocks, and could be used to monitor the progress of health systems in securing financial protection of vulnerable groups in Latin America. The systems to finance health care and their coverage of the population vary widely in the region, from Brazil's unified tax-based to Costa Rica's unified social health insurance scheme, both offering universal coverage. In between there are fragmented health systems that include Health Ministries covering with limited-benefit packages the population with no capacity to pay, while social health insurance schemes cover formal workers more-effectively. Innovative schemes include Colombia's regulated competition model that reaches universal coverage and has encouraged reforms in countries like the Dominican Republic and Peru. Chile's Auge scheme seeks universal coverage with a limited package and guaranteed waiting times, and Mexico's Seguro Popular offers tax-financed coverage through social insurance covering the previously uninsured. While several countries contract private providers for their public schemes, all permit the private sector with limited regulation to sell services to those able to pay. Further work should deepen the analysis on how the patterns of catastrophic spending are related to the features of health financing in each country.
ACKNOWLEDGEMENTS
Authors are grateful to IDRC (Grant 103905-001), the Carlos Slim Institute for Health through the LAC Health Observatory, the Consejo Promotor Competitividad y Salud and the Mexican Health Foundation for financial support and institutional support. Support is also recognized from CONACyT (grant 85055 Fondo Sectorial de Investigación para la Educación and grant SALUD-2004-C01-191 Fondo Sectorial de Investigación en Salud y Seguridad Social).
All authors contributed to this paper through their involvement in the 'Network on Health Financing and Social Protection in Latin America and the Caribbean (LANET) and / or the IDRC-funded project mentioned above. Other members of LANET who contributed to the work of the group are: Ana Mylena Aguilar; María Luisa Escobar; Amanda Glassman; Ramiro Guerrero Carvajal; Jorine Muiser; Gustavo Nigenda; Maja Pleich; Rocio Saenz; Vito Sciaraffia; Vito Sciaraffia Jr; Cecilia Vidal; NilhdaVillacres.
Declaration of conflicts of interest: The authors declare that they have no conflict of interests.
References
1. World Health Organization. The World Health Report 2000: Health Systems: Improving Performance, Geneva: World Health Organization, 2000. [ Links ]
2. Frenk J, Gómez-Dantés O, Knaul FM. The democratization of health in Mexico: financial innovations for universal coverage. Bull World Health Organ. 2009;87:542-48. [ Links ]
3. Frenk J, Gómez-Dantés O. Ideas and ideals: ethical basis of health reform in Mexico. Lancet 2009;373:1406-08. [ Links ]
4. Leive A, Xu K. Coping with out-of-pocket health payments: empirical evidence from 15 African countries. Bull World Health Organ 2008;86:849-46. [ Links ]
5. Xu K, Evans D, Carrin G,Aguilar-River AM, Musgrove T, Evans T. 2007. Protecting Households from Catastrophic Health Spending. Health Aff (Millwood); 26(4). [ Links ]
6. Xu K, Evans DB, Carrin G, Aguilar-Rivera AM. Designing health financing systems to reduce catastrophic health expenditures. Technical Brief for Policy Makers No.2. Geneva: WHO 2005. [ Links ]
7. Xu K, Evans DB, Kawabata K, Zeramdini R,Klavus J, Murray CJ. Household catastrophic health expenditure: a multicountry analysis. Lancet 2003; 362: 111-117. [ Links ]
8. Carrin G, James C. Evans. Achieving universal health coverage: developing the health financing system. Techniccal briefs for policy-makers. No. l Geneve: World Health Organization, 2005. [ Links ]
9. O'Donnell O, van Doorslaer E, Rannan-Eliya R, Somanathan A, Adihkari S, Akkazieva B, et al.,Who pays for health care in Asia? J Health Econ. 2008; 27: 460-75 pmid: 18179832. [ Links ]
10. Baeza C. and Packard TG. Beyond survival: protecting households from health shocks in Latin America. The World Bank and Stanford University Press.Washington DC: World Bank, 2006. [ Links ]
11. Van Doorslaer E,Wagstaff A, Rutten F, eds. Equity in the finance and delivery of health care: An international perspective. Oxford: Oxford University Press, 1993. [ Links ]
12. Van Doorslaer E,Wagstaff A,Van der Burg H. The redistributive effect of health care finance in twelve OECD countries. J Health Econ, l999; 18(3):291-313. [ Links ]
13. Van Doerslaer E, O'Donnell O, Rannan-Eliya RP, et al. Paying out-of-pocket for health care in Asia: Catastrophic and poverty impact. Equitap Project Working Paper No.2. Thailand: EQUITAP, 2005. [ Links ] 14.Van Doorslaer E, O'Donnell O, Ranan-Eliya R, et al. Catastrophic payments for health care in Asia. Health Econ. 2007; 16(11):1127-1275. [ Links ]
15. Flores G, Krishnakumar J, O'Donnell O,Van Doorslaer E. Coping with health care costs: implications for the measurement of catastrophic expenditures and poverty. Health Econ. 2008 pmid: 18246595. [ Links ]
16. Knaul, Felicia M., Hector Arreola-Ornelas, Oscar Méndez-Carniado, et al. Evidence Is Good For Your Health System: Policy Reform to Remedy Catastrophic and Impoverishing Health Spending in Mexico, Lancet, 2006; 368 (9549), 1828-41. [ Links ]
17. Knaul, Felicia and Julio Frenk. Health Insurance in Mexico: Achieving Universal Health Insurance through Stuctural Reform, Health Aff (Millwood). 2005; 24 (6), 1467-76. [ Links ]
18. Secretaría de Salud. Salud: México 200l. Informaciónpara la rendición de cuentas. México, DF: Secretaría de Salud, 2002. [ Links ]
19. Secretaría de Salud. Salud: México 2002. Informaciónpara la rendición de cuentas. México, DF: Secretaría de Salud, 2003. [ Links ]
20. Secretaría de Salud. Salud: México 2003. Informaciónpara la rendición de cuentas. México, DF: Secretaría de Salud, 2004. [ Links ]
21. Secretaría de Salud. Salud: México 2004. Informaciónpara la rendición de cuentas. México, DF: Secretaría de Salud, 2005. [ Links ]
22. Secretaría de Salud. Salud: México 200l-2005. Información para la rendición de cuentas. México, DF: Secretaría de Salud, 2006. [ Links ]
23. Van Doorslaer E., O'Donnell O., Ranna-Eliya R.P. et al. Effect of payments for health care on poverty estimates in ll countries in Asia: an analysis of household survey data. Lancet, 2006; 368: 1357-64. [ Links ]
24. Wagstaff A,Van Doorslaer E. Catastrophe and impoverishment in paying for health care: with applications to Vietnam 1993-1998. Health Econ. 2003; 12: 921-34 doi: 10.1002/hec.776 pmid: 14601155. [ Links ]
25. Gertler P., Gruber J. Insuring consumption against illness. Am Econ Rev. 2002; 92:51-70. [ Links ]
26. Wagstaff, Adam, The Economic Consequences of Health Shocks. World Bank Policy Research Working Paper No. 3644, 2005. [ Links ]
27. Londoño, Juan-Luis and Julio Frenk. Structural Pluralism: Towards an Innovative Model for Health System Reform in Latin America, Health Policy, l997; 41(1), 1-36. [ Links ]
28. Wong, R, A Palloni. Aging in Mexico and Latin America, Chapter ll in International Handbook of Population Aging, (eds), Springer Netherlands, 2009. [ Links ]
29. Murray CJL, Knaul F, Xu K, Mugrove P, Kawabata K. Defining and measuring fairness of financial contribution. World Health Organization. Global Programme on Evidence. WorkingPaper 24, 2000. [ Links ]
30. Perticara, M. Incidencia de los Gastos de Bolsillo en Salud en Siete Paises Latinoamericanos, Santiago de Chile, CEPAL, 2008. [ Links ]
31. Gottret P, Schieber G. Health financing revisited: a practitioner's guide. Washington, DC: The World Bank, 2006. [ Links ]
32. World Health Organization, The World Health Report 2008: Primary Health Care: Now More Than Ever, Geneva: World Health Organization, 2008. [ Links ]
33. Knaul FM, Arreola H, Méndez O, Miranda M. Preventing impoverishment, promoting equity and protecting households from financial crisis: Universal Insurance through Institutional Reform in Mexico. In: Addressing Challenges of Health Systems in the Developing World. Peter Smith and Diana Pinto, editors. Global Development Network and Edward Elgar. Cheltenham, UK, 2009. [ Links ]
34. Knaul FM, Arreola-Ornelas H, Méndez-Carniado O, Torres AC. Impoverishing and catastrophic household health spending among families with older adults in Mexico: A health reform priority. Chapter 18. The Health of Aging Hispanics: The Mexican-Origin Population. Angel, JL, Whitfield KE. (Eds.). New York: Springer Publishing, 2007. [ Links ]
35. Glassman AL, Escobar ML, Giuffrida A, and Giedeón U. Few to Many: Ten Years of Health Insurance Expansion in Colombia. Inter-American Development Bank and Brookings Institution, Washington, D.C., USA; 2009. [ Links ]
36. Musgrove P. Colombia: Approaching Universal Coverage. Health Aff (Millwood). 2010; 29:4, 739-740. [ Links ]
37. Muiser J, Herring A,Vargas JR. Understanding ten years of stagnation in Costa Rica's drive for universal coverage. Well-Being and Social Policy journal, 2008; 4:2. [ Links ]
38. World Bank. World Development Indicators database. Washington DC: World Bank, 2010. Online (http://data.worldbank.org). Accessed september 27, 2010. [ Links ]
39. O'Donnell, O., E van Doorslaer, A Wagstaff, and M Lindelow. Analyzing Health Equity Using Household Survey Data, Washington, D.C., The World Bank Press, 2008. [ Links ]
40. Van Doorslaer E., O'Donnell O., Ranna-Eliya R.P. et al. Effect of payments for health care on poverty estimates in ll countries in Asia: an analysis of household survey data. Lancet, 2006; 368: 1357-64. [ Links ]
 Address reprint requests to:
Dr. Héctor Arreola Órnelas.
Fundación Mexicana para la Salud.
Periférico Sur 4809, El Arenal,
Tlalpan 14610 México, D.F.
E-mail: harreola@funsalud.org.mx
Received on: October 11, 2010
Acepted on: April 14, 2011

