


Servicios Personalizados
Revista
Articulo
 Portugués (pdf)
 Artículo en XML
 Referencias del artículo
 Enviar artículo por email
Indicadores
-
 Citado por SciELO
 -
 Accesos
Links relacionados
-
 Similares en
SciELO
Similares en
SciELO
Compartir

 Permalink
Salud Pública de México
versión impresa ISSN 0036-3634
Salud pública Méx vol.53 no.4 Cuernavaca jul./ago. 2011
ARTÍCULO ORIGINAL
Food variety, dietary diversity, and food characteristics among convenience samples of Guatemalan women
La variedad, diversidad y características de la dieta en muestras de conveniencia de mujeres guatemaltecas
María José Soto-Méndez, BS; Raquel Campos, BS; Liza Hernández, BS; Mónica Orozco, PhD; Marieke Vossenaar, PhD; NoelW Solomons, MD
Center for Studies of Sensory Impairment, Aging and Metabolism (CeSSIAM). Guatemala City, Guatemala
ABSTRACT
OBJECTIVE: To compare variety and diversity patterns and dietary characteristics in Guatemalan women.
MATERIAL AND METHODS: Two non-consecutive 24-h recalls were conducted in convenience samples of 20 rural Mayan women and 20 urban students. Diversity scores were computed using three food-group systems.Variety and diversity scores and dietary origin and characteristics were compared between settings using independent t-test or Mann-Whitney-U-test.
RESULTS: Dietary variety and diversity were generally greater in the urban sample when compared to the rural sample, depending on the number of days and food-group system used for evaluation.The diet was predominantly plant-based and composed of non-fortified food items in both areas.The rural diet was predominantly composed of traditional,non-processed foods. The urban diet was mostly based on non-traditional and processed items.
CONCLUSION: Considerations of intervention strategies for dietary improvement and health protection for the Guatemalan countryside should still rely on promotion and preservation of traditional food selection.
Key words: diet quality; feeding practices; variety; diversity; Guatemala
RESUMEN
OBJETIVO: Comparar patrones y características de diversidad y variedad de la dieta de mujeres guatemaltecas.
MATERIEL Y MÉTODOS: Se realizaron dos recordatorios de 24-horas en una muestra de conveniencia de 20 mujeres rurales y 20 estudiantes urbanas. Se calcularon puntajes de diversidad usando tres sistemas de grupos alimentarios. La variedad y diversidad, así como el origen y características de la dieta, se compararon entre ambos sitios.
RESULTADOS: La variedad y diversidad en general fueron mayores en la muestra urbana en comparación con la muestra rural, dependiendo del número de días y del sistema de grupos de alimentos utilizados para la evaluación. La dieta rural fue predominantemente vegetal y compuesta de alimentos tradicionales no procesados. La dieta urbana estaba basada primordialmente en alimentos procesados.
CONCLUSIÓN: Las consideraciones para crear estrategias de intervención para el mejoramiento de la dieta en el área rural dependen de la conservación de la selección de alimentos tradicionales.
Palabras clave: dieta; hábitos alimenticios; variedad; diversidad; Guatemala
The major concern of dietetic analysis has conventionally been the intake of nutrients and their adequacy to cover the recommended levels of consumption.1,2 Only secondarily have nutrition professionals been concerned with the choice and selection of individual foods and their combination, which make up the dietary pattern.3 A wide body of evidence, however, links the pattern of consumption of the actual foods and beverages to health outcomes4,5 and has provided the bases for various iterations of "dietary guidelines".6,7 Moreover, the variety in selection can be an important determinant of the nutrient adequacy.8-10 In a practical sense, it is easier to provide guidance and consumer education based on foods, rather than specific nutrients, such that documenting and analyzing the food choices people make in different settings could provide an avenue for improving diets and ultimately improving function and reducing illness.
Food variety and dietary diversity are two parameters of healthful eating.9-11 Our group has recently begun to review our experience with quantitative dietary intakes through the prism of food variety, dietary diversity, taxonomic origin of sources, and various characteristics of the foods.12,* Dietary diversity relates to selection among food groups, but there is no consensus as to which food-group classification system is most useful or universal. Our approach has been embracing of multiple food-group systems.12,*
We enrolled and interviewed two groups of Guatemalan women in contrasting residential, economic and educational circumstances as part of a primary activityrelated to a metabolic field study. Although the primarypurpose of the present data collection was not related to the broad pattern of eating, the application of our expanded approach to dietary pattern analysis,12,* in secondary analysis, appeared to constitute a worthwhileexercise to see what stable patterns might emerge from a look at even a small sample-size. We present here thefindings from the rural-urban comparison of consumption patterns from two-day recall data in contemporary adult women in free-living daily settings.
Material and Methods
Study population
The participants were convenience samples recruited in a rural and an urban area of the Republic of Guatemala. Women were recruited as part of a study to determine the association between dietary fiber consumption and fecal free-radical production in rural and urban Guatemalan women.** A secondary analysis of the dietary data collected from the primary study was performed, results from this analysis are presented in this article. All women aged 18 and above were eligible for the study. Pregnant and lactating women were excluded.
Furthermore, twenty healthy women living in a rural area were invited to participate in this study. The sample was comprised of women living in the Mayan village of Santo Domingo Xenacoj, Chimaltenango on the central highlands, 45 km from Guatemala City along the Pan American Highway. The traditional Mayan language spoken in the village is Kakchiquel. Women were recruited through a midwife.
Furthermore, 20 healthy women living in an urban area were included in this study. The sample was comprised of students attending Guatemala's national university "Universidad de San Carlos de Guatemala". Students were contacted by laboratory instructors and lecturers and invited to participate in the study.
Ethical approval was obtained from the Human Subjects Committee of the Center for Studies of Sensory Impairment, Aging and Metabolism (CeSSIAM) and the study conforms to the provisions of the Declaration of Helsinki in 1995 (as revised in Edinburgh 2000). The study protocol was approved by the local authorities of the Ministry of Public Health. The purpose and procedures of the study were explained and all participants gave written informed consent; subject anonymity was preserved. Participants received a small compensation in kind after each interview.
Data collection
Two separate 24-h dietary recalls were recorded for each participant. Participants were asked to report all foods and beverages consumed in the previous 24 h. Portion sizes were recorded in common household measures and recipes for dishes and household preparations were queried in detail. The interviews were conducted by a team of three trained and standardized nutritionists.
Data were collected on two non-consecutive days, always on week days in 2009. The rural interviews took place on Wednesday, October 28 and Wednesday, November 4. In the urban area the interviews were divided in two groups for logistics reasons and took place on Monday, October 26 and Thursday, October 29 for the first 24-hr recall and on Monday, November 2 and Wednesday, November 4, for the second interview. The time interval between the two interviews was between six and seven days for all participants.
Data analysis
A list of all food items eaten was established for both the urban and rural sample. Homemade mixed dishes were disaggregated based on ingredients, as described by Azadbakht et al.8 Food items were considered to be different from each other when they were clearly nutritionally different (e.g. natural and artificial fruit juices), or different based on other characteristics (e.g. ground and instant coffee). Portion sizes were not taken into account, thus no minimum level of intake was used. Estimated energy and macronutrients intakes of the foods and drinks consumed were calculated using an adapted food composition table.13
The basic concepts of food variety and dietary diversity as described by Drewnowski et al. 11 were used. Food variety was defined as the number of mentions of different food items in the diet per day. Results were presented at the individual and at the group level. Group level intakes are presented as mentions (i.e. independent of portion size), weight contribution and energy contribution to the total diet of each area.
Furthermore, a "Dietary Diversity Score" was assessed based on three different food-group systems. The first food-group system used is based on the Guatemalan dietary guideline La Olla de la Alimentación, translated into English as the 'Cooking pot'.14 This guide contains six food groups (listed in the appendix).
The second food-group system is based on a publication of the United States Agency for International Development (USAID),15 which describes the development of indicators of quality and quantity of complementary feeding of infants in developing countries. This food-group system, which will be indicated as 'USAID',15 consists of eight food groups (listed in the appendix).
The third food-group system is very elaborate and is based on a series of common-protocol observational dietary surveys conducted in rural Guatemala in the 1950s by the Institute of Nutrition of Central America and Panama (INCAP), as compiled by Bermúdez et al.13 This system, indicated as 'INCAP-papers', includes 25 food groups (listed in the appendix).
An overview on how many participants consumed each food group was made to get an insight into which food groups were eaten regularly. Since we gathered two, non-consecutive-day recalls for each subject, our principal approach to diversity was to combine the total two-day food-item roster into the analysis by food-group. Since previous studies predominantly use a one-day scoring,15,16 we generated expressions in both the standard (1-d) and the modified (2-d) approaches.
In addition, all food items were grouped into categories using four classification systems: (i) origin (animal, plant, both, or unclassified); (ii) modern vs. traditional foods; (iii) processed vs. non-processed foods; and (iv) fortified vs. non-fortified foods. Each food item was classified according to objective criteria as described by Enneman et al.12 In Guatemala, sugar is fortified with retinyl palmitate (at levels of 10 retinol activity equivalents per gram) and was therefore classified as a fortified food. Foods were classified as traditional foods according to the classification used in the INCAPfood surveys undertaken in the mid 20th century.13 Items were defined as processed when they were unlikely to be made at a home setting. There were, for example, no reports of pasta or bread made at home.
Statistical analyses
Comparisons of total variety scores between geographical settings were made using independent t-test. General descriptive statistics were presented for the three variants of dietary diversity scores for day one, day two, and cumulative two-day scores. Comparisons of dietarydiversity scores between areas were made using the independent t-test when normally distributed and MannWhitney U-test when the distribution was skewed. Comparisons of total daily intakes, in weight and energy, were made between geographical settings using independent t-test and Mann-Whitney U-test, respectively. Statisticalsignificance was set at p<0.05. All statistical analyses wereperformed using SPSS 15.0 for Windows.
Results
The rural participants of this study were women 19 to 56 yrs old. All were housewives with only primary level education and from low socio-economic level households. All women invited to participate agreed to be part of the study. The urban participants were women 19 to 52 yrs old. All were university students from a medium socio-economic level. Of the 30 women invited to participate, 20 agreed to be part of the study.
Dietary variety
Dietary variety was assessed at the level of the individual participant and for the cumulative population sample. At the individual level the number of different items reported on any given day ranged from 8 to 15 in the rural women, with a mean of 12±2 for the first day of interview and 12±3 for the second day of interview. For the urban women, the corresponding range was 9 to 20 items, with a mean of 14±4 for the first day and 15±4 for the second day. The number of different items consumed per day was significantly larger (p=0.002) in the urban sample.
A total of 192 different food items were mentioned by the 40 participants in both residential areas over two recall days (i.e. 80 subject-days). This represents the cumulative dietary variety at the sample level. The number of different items reported by the rural sample was 87, whereas it was 158 for the urban sample. Of these 192 items, 34 were unique to the rural sector, 105 unique to the urban sample, and 53 were mentioned in common by participants from both areas of residence.
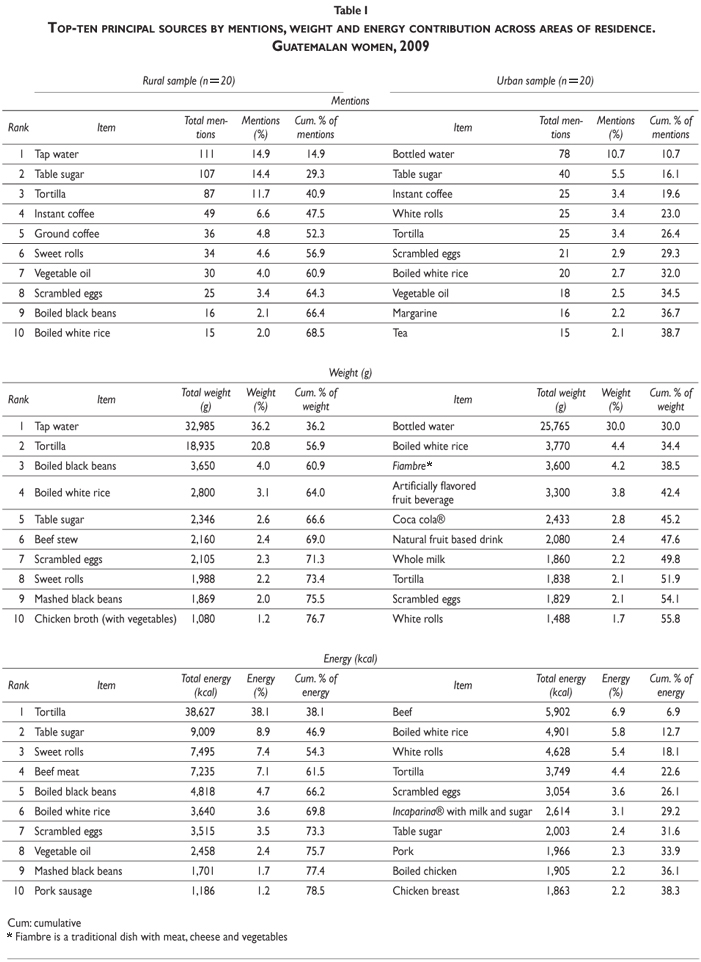
Table I compares the 10 leading contributors to the rural and urban diets with respect to frequency of mentions, weight and energy contributions. With respect to the frequency of mentions (Table I, first tier), there is major homology at the top of the principal sources rosters across the two areas, with seven of the top 10 items shared, albeit in varying order. The most frequent mention is drinkable water in both areas; in the urban area, the top three mentions (water, sugar, and coffee powder) represent the ingredients for a cup of coffee, as they do within the four leading items on the rural side. Only ground coffee, sweet rolls and boiled whole black beans in the rural list and white rolls, margarine and prepared flavored teas on the urban side are not homologous across settings. With respect to weight in grams (Table I, second tier), plain water (consumed as drinking water or as part of home-prepared infusions such as coffee and tea), was the first-ranked item in both areas. Maize tortillas, scrambled eggs and boiled white rice were found in common on both lists. In addition to water, three beverages helped make up the top 10 items by weight for the urban sample. With respect to energy in kcal (Table I, third tier), tortillas were ranked first and table sugar second in the rural area, whereas beef and boiled white rice headed the urban list, with tortillas appearing in the fourth rank.
Dietary diversity
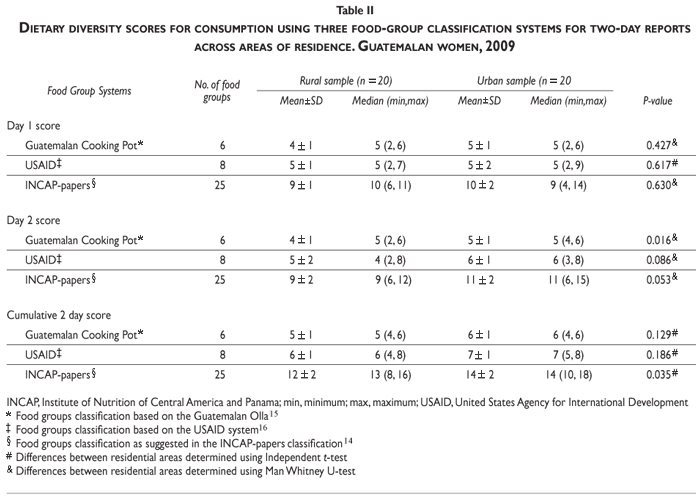
Dietary diversity scores according to the three different food-group systems for both residential areas are shown in Table II. They are analyzed as individual scores for either one day or combined two-day reported intakes.
When diversity is compared using the Guatemalan "cooking pot" six-food-group system,14 no significant differences in dietary diversity scores were observed between samples when using the cumulative two-day score. Only when using the second day score, higher diversity scores were observed in the urban sample (p=0.016) when compared to the rural sample. Using the USAID eight-food-group system,15 no significant differences were observed between the rural and urban groups for the both days of questioning. Using the 'INCAP-papers' 25-food-group system,13 no significant differences were observed between the rural and urban groups for the first and the second day. However, when both data collection days were combined diversity was greater in the urban sample (p=0.035).
On any given day the herbs/vegetables and fruits groups were those least likely to be represented in the Guatemalan "cooking pot" system, whereas vitamin A-rich fruits and vegetables, eggs, and legumes and nuts were the most likely not be met in the USAID system. Using the 'INCAP-papers' system game meat, snacks, green leaves and fish/shellfish were the least represented (data not shown).
Origins and characteristics of foods
The food items reported were classified by pre-established criteria as to plant or animal origin, and with regard to their modernity, processing and fortification characteristics. The distributions across the foods of different origin and between the options of specific characteristics are shown in Table III. When examined in terms of mentions (i.e. unrelated to portion size), the relative contribution of plant-based, processed and non-fortified food items was greater than the contribution of animal-based, non-processed and fortified in both areas. In the rural sample, as expected, the contribution of traditional foods, such as corn tortillas and scrambled eggs, was greater than the contribution of modern foods. This relationship was the opposite in the urban sample, where modern foods such as bottled water, instant coffee, vegetable oil, margarine and tea were more dominant. Among the interesting observations is the almost 1:7 ratio of animal-to plant-based foods in the rural sample and the 1:4 ratio in the urban area.
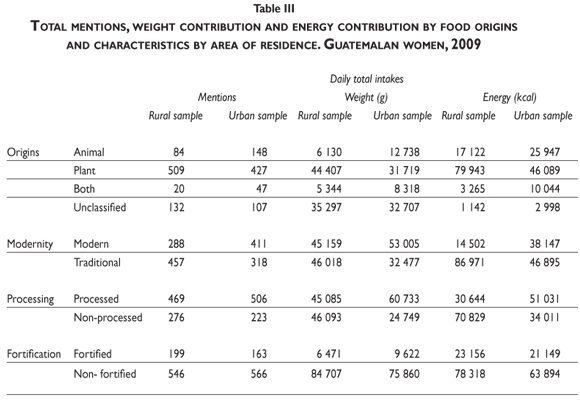
When examined in terms of daily weight intakes (i.e. related to portion size), different patterns of origin of foods were observed. Over seven times more weight of plant-origin foods than of animal-origin foods were consumed by the rural sample. In the urban sample the ration was smaller at approximately twice as much weight coming from animal sources versus plant sources. In the urban sample only, more weight of modern than traditional, and more weight of processed than unprocessed foods were consumed. In both sample less weight of fortified than non-fortified foods were ingested. On an individual basis, women of the village consumed 2301±482 g of edible items per day of reporting, whereas women of the capital consumed 2150±524 g, a difference that was not statistically significant (p=0.555). Insofar as the unclassified category in the origins analysis is almost entirely constituted from plain water, the respective average weights of these foods, serving as a proxy for watery liquids were 882 g and 818 g in the rural and urban areas, respectively.
Finally differences in patterns of origin of foods were examined by energy contribution. Mean daily estimated energy consumption was 2528±524 kcal for the rural women and 2149±734 kcal for the urban students, significantly higher in the former (p=0.035). Whereas the energy from modern and traditional foods was closely balanced in the urban sample, about six-fold more energy was consumed from traditional foods as compared to modern ones by the rural sample. More energy was consumed from modern and processed foods, but not from fortified foods, by the urban women.
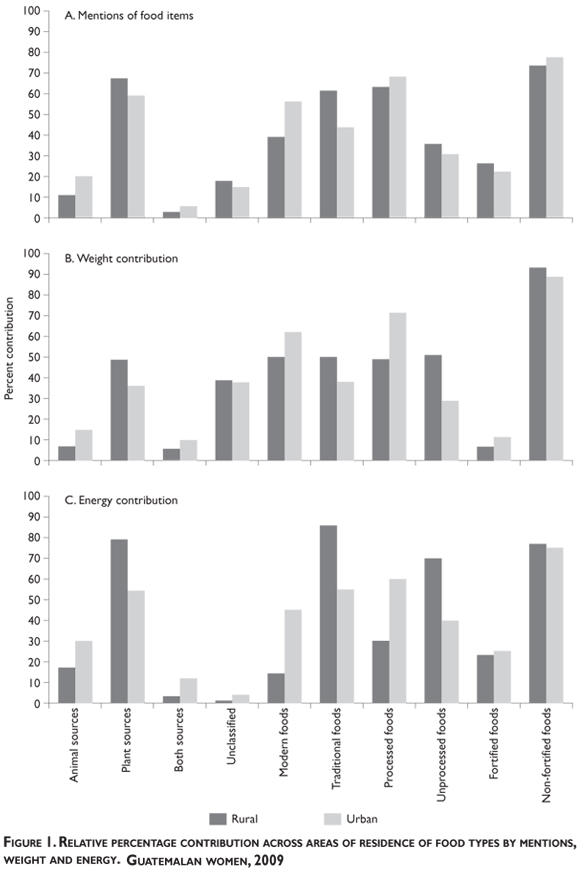
Figure 1 provides a comparative view betweenthe two samples for the mentions, weight and energy contributions by origin and characteristics in percentage terms for more expedited visual comparisons.
Discussion
The emerging contemporary focus of dietary quality analysis looks at patterns of intake, related to the actual foods and beverages selected and consumed in terms of combinations.4,5 We have taken advantage of data from a small, convenience sample study into areas of Guatemala to explore the utility of innovative dimensions and approaches to looking at variety, diversity and characteristics of the diet.
Strengths and limitations of the study
Certain limitations in the design and methodology are recognized. Firstly, the sample size was small. Secondly, this study is based on two non-consecutive recalls with the disadvantage of not being representative of the habitual nutrient intake of any individual within the group; mainly because of an important holiday with specific food preparation that took place two days before the first recall in the city. Most interviews referred to a week day, but in a sub-sample of the urban women theinterview referred to a Sunday which is likely to differ from a typical week day. In addition, there are limitations to the nutrient data obtained from the food composition tables, as they do not present some specific foods consumed in Guatemala.
What was noteworthy in our study was the novelty of using weight and energy in addition to mentions in looking at food patterns. Furthermore, multiple systems of food groups classification to assess dietary diversity were applied. These were based on current national and international guidelines for healthy eating, as well as classification systems used in the past. Interestingly significant comparisons between the samples studies were only observed when using the day 2 score based on the Guatemalan "cooking pot" six-food-group system and when using a cumulative two day score using the 'INCAP-papers' food-group system. These findings suggest that the Guatemalan Cooking Pot, with only six food groups, provides comparative value. The numbers of data collection days needed for dietary variety and diversity analysis remains unanswered.
Inter-area comparisons related to variety and diversity
It is surprising how much homology there was between the principal sources of mentions, weight and energy contribution despite the remarkably greater variety among the urban women. An examination of the weight and energy shows that the top sources contributed 55.8% of the total weight and 38.3% of the total energy as compared to 76.7 and 78.5% for the rural population, respectively. That is to say that the urban women had the same principal sources in their diet but with a much lower contribution to the total than the rural women.
Although the items at the top of the consumption list bear certain homologies across areas, their relative contribution to the whole diet varies remarkably. In fact, a testimony to the differential population-level variety can be found in the cumulative percentage of the total two-day intake embraced by the leading 10 items of consumption. Rural and urban women had roughly equivalent total mentions, but almost 70% of all rural mentions were for the ten items in the top-ten roster, whereas slightly fewer than 40% of the urban mentions were for the principal ten. From all standpoints examined, a large percentage of all that is consumed by rural women is confined to 10 sources of foods or liquid.
A curious finding is related to the relative energy-density of foods across the areas. Conventional wisdom would suggest that a rural sample would have a less energy-dense dietary fare.At least with the interviewing on the days of study, we see the opposite effect. At the aggregate level, the rural diet delivered 111 kcal/100 g, as compared to 99 kcal/100 g for the urban. Excluding the (non-caloric) plain water component from the weight denominator, however, the respective difference expands to 174 kcal/100 g rural, and 165 kcal/100 g urban. The most recent edition of the World Cancer Research Fund/American Institute for Cancer Research's guidance for a cancer-protective diet, states their recommendation for total dietary density as follows: "Average energy density of diets to be lowered towards 125 kcal/100 g".17 By this criterion, both populations are in need of concerted efforts to reduce the effective energy-density of their diets.
Comparisons with other experiences in Guatemala regarding other dietary characteristics
The basic and conventional manner of looking at dietary characteristics has been by the number of mentions. Traditional items constituted a slight majority of the food selection mentioned in the present study, 55%, almost identical to the 56% among the urban complementary foods of infants living in Guatemala City.12 Among the urban day-care menus in Guatemala City, 69% of mentions were of traditional items.* Fortified foods constituted between 22 and 25% of all items in both rural and urban settings in both the adults in this study and the CF in the Enneman study,12 whereas 42% of items served on urban day-care menus were fortified.* With respect to processed foods' contribution, they were lowest at 19% for day care centers,* intermediate in CF at 45%12 and highest in adult women here at 60%. For the rural CF and the rural women, processed foods constituted 41 and 30% of the items mentioned. Finally, plant-based food items constituted between 59 to 69% of food mentions in the three CeSSIAM studies.
The unique contributions of this study and that of Doak and Hamelinck,* however, is moving beyond mentions to the contribution of weight and energy. For the urban day-care menus, the weight of traditional foods was 79% of the total served, compared to 38% of that selected by urban students and 50% of rural peasant women. For fortified foods on a weight basis, these were respectively, 11, 11 and 7%, and for items classified as processed, 52, 71 and 49%. Finally, plant-based food items constituted between 55, 49 and 37%.
Implications of the findings for beverage consumption and hydration
When the leading sources in terms of total weight were examined, only one of the top 10 sources in the rural sample was a beverage (namely water) compared to five sources in the urban sample (namely bottled water, artificially flavored fruit beverage, Coca cola®, natural fruit based drink and whole milk). The mean daily consumption of all beverages consumed was 950 mL/day for the rural women 1100 mL/day for the urban sample. The estimated intake falls well below the adequate intake level of 2200 mL/day for women from plain water and other drinks.19 The reported consumption of liquids in both samples is deficient, or this could imply that our recall data is capturing less than the actual consumption of beverages (systematic underreporting).
Conclusion
The selection of foods and beverages and their characteristics, other than nutrient content and density, is an important determinant of health and function. Even without a completely exhaustive analysis of our comparison to the literature or the internal comparisons of CeSSIAM studies,12, * it becomes clear that dietary pattern evaluation that goes beyond number of mentions, to recognitions of the factors of weight of consumption and contribution of energy provides a deeper, more nuanced, and potentially more informative approach. The health implications of caloric versus non-caloric beverages is a current topic of interest,19-22 and our examinations of variety and origins casts light in that direction.
It would seem from the greater contributions of modern and processed items observed in the urban diets supports the "nutrition transition" previously observed in this setting.23-25 This observation allows the considerations of intervention strategies for dietary improvement and health protection for the Guatemalan countryside still to rely on promotion and preservation of traditional food selection. Paradoxically, the traditional foods are more energy-dense thanthe modern foods, especially as selected by the rural population. Apparently the grotesque consequences of food processing on energy-density proclaimed by Monteiro and colleagues,26 have yet to be perceived in the food selection of urban Guatemalans. Thus, given the increasing reliance on commercial items in the city, lowering energy densities by industrial producers would seem to represent a positive development. Any favorable change in food processing will have to be tied to campaigns of consumer education and awareness regarding healthful eating in an urban context.27 The embrace of fortified foods, finally, would appear to portend a reduction in micronutrient deficiencies across the nation, but constant vigilance to avoiding excessive intake of fortificants from commercial sources, such as vitamin A in sugar, will be needed as well.28-30
Acknowledgements
We are grateful to the subjects of this study for their voluntary participation. The study was funded by the Hildegard Grunow Foundation of Munich, Germany.
Declaration of conflict of interests: The autors declare that they have no conflict of interests.
References
1. Waterlow J C. Childhood malnutrition--the global problem. Proc Nutr Soc 1979;38: 1-9. [ Links ]
2. Durnin J V, Edholm O G, Miller D S,Waterlow J C. How much food does man require? Nature 1973;242:418. [ Links ]
3. Peters J R, Quiter E S, Brekke M L,Admire J, Brekke M J, Mullis R M, et al. The Eating Pattern Assessment Tool: a simple instrument for assessing dietary fat and cholesterol intake. J Am Diet Assoc 1994;94:1008-1013. [ Links ]
4. Kris-Etherton P, Eckel R H, Howard B V, St Jeor S, Bazzarre T L.AHA Science Advisory: Lyon Diet Heart Study. Benefits of a Mediterranean-style, National Cholesterol Education Program/American Heart Association Step I Dietary Pattern on Cardiovascular Disease. Circulation 2001;103:1823-1825. [ Links ]
5.Tucker K L, Selhub J,Wilson P W,Rosenberg I H. Dietary intake pattern relates to plasma folate and homocysteine concentrations in the Framingham Heart Study. J Nutr 1996;126:3025-3031. [ Links ]
6. Guenther P M, Reedy J,Krebs-Smith S M. Development of the Healthy Eating Index-2005. J Am Diet Assoc 2008;108:1896-1901. [ Links ]
7. Willett WC,McCullough ML. Dietary pattern analysis for the evaluation of dietary guidelines. Asia Pac J Clin Nutr 2008;17 Suppl 1:75-78. [ Links ]
8. Azadbakht L, Mirmiran P,Azizi F.Variety scores of food groups contribute to the specific nutrient adequacy in Tehranian men. Eur J Clin Nutr 2005;59:1233-1240. [ Links ]
9. Murphy S P, Foote JA,Wilkens LR, Basiotis PP, Carlson A, White KK, et al. Simple measures of dietary variety are associated with improved dietary quality. J Am Diet Assoc 2006;106:425-429. [ Links ]
10. Oldewage-Theron WH, Kruger R. Food variety and dietary diversity as indicators of the dietary adequacy and health status of an elderly population in Sharpeville, South Africa. J Nutr Elder 2008;27:101-33. [ Links ]
11. Drewnowski A, Henderson S A, Shore A B, Fischler C, Preziosi P, Hercberg S. Diet quality and dietary diversity in France: implications for the French paradox. J Am Diet Assoc 1996;96:663-669. [ Links ]
12. Enneman A, Hernandez L, Campos R,Vossenaar M, Solomons N W. Dietary characteristics of complementary foods offered to Guatemalan infants vary between urban and rural settings. Nutr Res 2009;29:470-479. [ Links ]
13. Bermúdez OI, Hernández L, Mazariegos M,Solomons NW. Secular trends in food patterns of Guatemalan consumers: New foods for old. Food Nutr Bull 2008;29:278-287. [ Links ]
14. Institute of Nutrition of Central America and Panama (INCAP), Guías alimentarias para Guatemala: los siete pasos para una alimentación sana. INCAP, 2008. [ Links ]
15. Dewey KG, Cohen RJ, Arimond M, Ruel MT. Developing and validating simple indicators of complementary food intake and nutrient density for breastfed children in developing countries.Washington, DC:Academy for Educational Development, 2006 [ Links ]
16. Complementary feeding in the WHO Multicentre Growth Reference Study. Acta Paediatr Suppl 2006;450:27-37. [ Links ]
17. World Cancer Research Fund, American Institute of Cancer Research. Food, nutrition, physical activity, and the prevention of cancer: a global perspective.Washington, DC: WCRF/AICR, 2007. [ Links ]
18. Institute of Medicine. Dietary Reference Intakes: Water, Potassium, Sodium, Chloride, and Sulfate.Washington, DC: National Academy Press, 2004 [ Links ]
19. Rivera JA, Munoz-Hernandez O, Rosas-Peralta M, Aguilar-Salinas C A, Popkin BM,WillettWC. Beverage consumption for a healthy life: recommendations for the Mexican population. Salud Publica Mex 2008;50:173-195. [ Links ]
20. Barquera S, Hernandez-Barrera L,Tolentino M L, Espinosa J, Ng S W, Rivera JA, et al. Energy intake from beverages is increasing among Mexican adolescents and adults. J Nutr 2008;138:2454-2461. [ Links ]
21. Popkin BM. Patterns of beverage use across the lifecycle. Physiol Behav 2010;100:4-9. [ Links ]
22. Popkin BM, D'Anci KE,Rosenberg IH.Water, hydration, and health. Nutr Rev 2010;68:439-458. [ Links ]
23. Drewnowski A,Fulgoni V, 3rd. Nutrient profiling of foods: creating a nutrient-rich food index. Nutr Rev 2008;66:23-39. [ Links ]
24. Popkin BM.The nutrition transition in low-income countries: an emerging crisis. Nutr Rev 1994;52:285-298. [ Links ]
25. Popkin BM.An overview on the nutrition transition and its health implications: the Bellagio meeting. Public Health Nutr 2002;5:93-103. [ Links ]
26. Monteiro CA. Nutrition and health.The issue is not food, nor nutrients, so much as processing. Public Health Nutr 2009;12:729-731. [ Links ]
27. Uauy R,Monteiro CA.The challenge of improving food and nutrition in Latin America. Food Nutr Bull 2004;25:175-182. [ Links ]
28. Allen L H. New approaches for designing and evaluating food fortification programs. J Nutr 2006; 136: 1055-1058. [ Links ]
29. Dary O. Establishing safe and potentially efficacious fortification contents for folic acid and vitamin B12. Food Nutr Bull 2008;29:S214-S224. [ Links ]
30. Dary O. Lessons learned with iron fortification in Central America. Nutr Rev 2002;60:S30-S33. [ Links ]
 Correspondence author:
Dr. Marieke Vossenaar
Center for Studies of Sensory Impairment
Aging and Metabolism (CeSSIAM)
17 Avenida 16-89 (interior), Zona 11 (Anillo Periferico)
01011 Guatemala City
E-mail: mvossenaar@hotmail.com; cessiam@guate.net.gt
Received on: March 2011
Accepted on: August 2011
* Doak C M, Hamelinck V, Vossenaar M, Panday B, Soto-Méndez MJ, Campos-Ponce M. Evaluating food menus from day care centers in Guatemala City: Descriptive and analytical approaches. Nutrition 2011 (in press).
** Unpublished data Orozco et al.


