


Services on Demand
Journal

Article
 English (pdf)
 Article in xml format
 Article references
 Send this article by e-mail
Indicators
 Cited by SciELO
 Related links
-
 Similars in
SciELO
Similars in
SciELO
Share

 Permalink
Salud Pública de México
Print version ISSN 0036-3634
Salud pública Méx vol.52 suppl.1 Cuernavaca Jan. 2010
ARTÍCULO ORIGINAL
Methodology for the analysis of type 2 diabetes, metabolic syndrome and cardiovascular disease risk indicators in the ENSANUT 2006
Metodologia para el análisis de diabetes tipo 2, síndrome metabólico e indicadores de riesgo cerdiovascular en la ENSANUT 2006
Simón Barquera, MD, PhDI; Ismael Campos-Nonato, MScI; Citlali Carrión-Rábago, MScI; Salvador Villalpando, MD, PhDI; Ruy López-Ridaura, MD, PhDI; Rosalba Rojas, MD, PhDI; Carlos A Aguilar-Salinas, MDII
IInstituto Nacional de Salud Pública. Cuernavaca, Morelos, México
IIInstituto Nacional de Ciencias Medicas y Nutrición Salvador Zubirán. México DF, México
ABSTRACT
OBJECTIVE: To describe: a) the methods used to quantify biochemical indicators of Type 2 Diabetes (T2D), and other cardiovascular risk indicators in the Mexican National Health and Nutrition Survey 2006 (ENSANUT 2006) and b) compare the sub-sample with the non-selected participants in diverse socio-demographic, anthropometric and health characteristics.
MATERIAL AND METHODS: A sub-sample of 6 021 fasting adult participants was randomly selected from the total fasting participants (n=39 425). We compared diverse socio-demographic, anthropometric and health parameters between this sub-sample and the rest of the participants.
RESULTS: No differences were found in sociodemographics characteristics, except age, between the sub-sample and from the rest of the fasting adults. In addition no difference were found between prevalences of overweight and obesity, central obesity, and previously diagnosed high blood pressure, T2D or hypertrigliceridemia.
CONCLUSIONS: The randomly selected sub-sample was not essentially different from the rest of the fasting subjects. Thus, no bias is expected in the interpretation of cardiovascular risk indicators derived from these data.
Keywords: obesity; diabetes mellitus; high blood pressure; dyslipidemias; national surveys
RESUMEN
OBJETIVO: Describir: a) los métodos usados para definir Diabetes tipo 2 (T2D), y otros indicadores de riesgo cardiovascular en la submuestra de la Encuesta Nacional de Salud y Nutrición 2006 (ENSANUT 2006) y b) comparar en características sociodemográficas, antropométricas y otros determinantes de salud a los participantes de la submuestra con los no seleccionados.
MATERIAL Y MÉTODOS: Una submuestra de 6 021 adultos fue seleccionada aleatoriamente de la totalidad de participantes en ayuno (n= 39 425). Se compararon parámetros sociodemográficos, antropométricos y de salud entre la submuestra y el resto de los participantes.
RESULTADOS: No se encontraron diferencias en ninguna de las variables sociodemográficas, a excepción de la edad; ni en la prevalencia de sobrepeso, obesidad abdominal, diagnóstico previo de hipertensión, T2D, hipercolestrolemia e hipertrigliceridemia entre los adultos de la submuestra y los no seleccionados.
CONCLUSIONES: La submuestra no fue estadísticamente diferente del resto de los sujetos no seleccionados. Por ello, no se espera un sesgo en la interpretación de los indicadores de riesgo cardiovascular derivados del análisis de estos datos.
Palabras clave: obesidad; diabetes mellitus; hipertensión; dislipidemias; encuesta nacional
The prevalence of chronic diseases and obesity in Mexico have been documented in several probabilistic surveys [i.e., the Mexican National Nutrition Surveys I and II (1988, 1999),1,2 the Mexican Chronic Diseases Survey (1994)3 and the Mexican Health Survey (2000)4]. During 2005-2006 the Instituto Nacional de Salud Pública (Mexican National Institute of Public Health) implemented a nationally representative health and nutrition survey [National Health and Nutrition Survey 2006 (ENSANUT 2006)]. The objectives of this survey was to obtain information about the health and nutritional status of the population, and the use of health services. The purpose of this short communication was to describe: a) the methods used to quantify biochemical indicators of Type 2 Diabetes (T2D), and other cardiovascular disease risk indicators collected in ENSANUT 2006 and; b) the comparison of the ENSANUT 2006 sub-sample with non-selected participants (within diverse socio-demographic, anthropometric and health characteristics). Since not all subjects were at fasting state for at least 8 hrs before the blood collection, we compared the selected fasting sub-sample to the rest of the fasting subjects as well as to the overall participants in the survey.
Material and Methods
The ENSANUT 2006 was conducted between October, 2005 and May, 2006 using a probabilistic multistage stratified cluster sampling design. The survey was aimed to update the prevalence of infectious and chronic diseases and their associated risk factors. A total of 47 152 households participated. From each household, a random selection was performed to interview the following subjects: a child (under age 10), an adolescent (aged 11-19 years), and an adult (aged 20 years or older). The survey has the power to make distinctions between urban (>2 500 inhabitants) and rural (<2 500 inhabitants) areas, and four geographic regions described below. Population characteristics, sampling procedure, and other methodological details can be consulted in a previous publication.5 Socio-demographic and personal health questionnaires, blood pressure and anthropometric measurements were obtained from all participants. For the fasting sub-sample we randomly selected 6 613 subjects from the adult survey. A total of 91% (n=6 021) participants from this group were in fasting state at the time of blood collection and were considered the valid fasting sub-sample, with statistical power to detect prevalence of T2D and dyslipidemias > 8%, and balanced by geographic region.
Sample weights for each selected participant were calculated in order to estimate nationally representative prevalences and values. The proportion of participants who provided blood samples were slightly younger and more likely to be female. Thus, post-stratification weights were calculated for the analytical sub-sample; using the age and sex distributions from the 2005 national population census.6
Geographic regions
The ENSANUT 2006 and this analytical sub sample are representative of Mexico's four regions: north, central, Mexico City and south. The four regions, with common geographic and socio-economic characteristics, were 1) north: Baja California, Southern Baja California, Coahuila, Chihuahua, Nuevo Leon, Sonora, Sinaloa and Tamaulipas, 2) central: Distrito Federal, Hidalgo, Estado de México, Morelos, Puebla, Queretaro and Tlaxcala, 3) center/west: Aguascalientes, Colima, Durango, Guanajuato, Jalisco, Michoacan, Nayarit, San Luis Potosi and Zacatecas, and 4) south: Campeche, Chiapas, Guerrero, Oaxaca, Quintana Roo, Tabasco, Veracruz and Yucatan. This regionalization scheme has been used in diverse epidemiologic transition analysis for within country comparisons.7,8
Construction of the socio-economic status index
A principal components analysis (PCA) was performed to summarize individual socio-economic status (SES). Entered into the PCA were household characteristics (flooring material, ceiling, walls, water source, sewerage, number of persons residing in the household and number of domestic appliances). The main factor extracted explained 40.4% of the total variance with a Kaiser-Mayer-Olkin (KMO) measure of sampling adequacy equal to 0.83. This factor had large loadings for other household and community characteristics such as sewer system, indoor plumbing, refrigerator and television. Small loadings were observed for variables such as communal food distribution and number of people residing in the household. The main extracted factor was divided into tertiles and used as a proxy for low, medium and high SES.
Anthropometric measurements
Following internationally accepted techniques, standardized personnel measured height to the nearest 0.1 cm, using a stadiometer and body weight using a digital scale with an error of 5 mm and 0.1kg, respectively. Waist circumference (WC) was measured at the mid point between the highest part of the iliac crest and the lowest part of the ribs margin of the median axial line. Body mass index (BMI) was calculated by dividing the weight in kilograms by height in meters squared (m2); and categorized according to the World Health Organization (WHO) cut-off points into: low weight (<18.5 kg/m2), normal weight (18.5-24.9 kg/m2), overweight (25-29.9 kg/m2) and obesity (>30 kg/m2);9 if WC was >90cm in males or >80cm in females, subjects were classified as having abdominal adiposity based on the International Diabetes Federation (IDF) criteria.10
Blood sample procedures
Blood was collected from randomly selected participants. Participants were instructed to avoid eating any solid or liquid food prior to their blood draw. In all cases the time of the last food eaten was recorded. The majority of participants (91.3%) declared to have fasted more than 8 hours at the time of the blood draw. Blood was drawn from an antecubital vein and collected in tubes without anticoagulant. The blood was centrifuged in situ. A second sample was collected in heparinized tubes from subjects who reported to have a medical diagnosis of T2D. Serum and whole blood aliquots were stored in cryovials, placed in liquid nitrogen and transported to the Mexican National Institute of Public Health and stored at -70 ºC until analyses were performed.
Biochemical measurements
Serum glucose concentrations were measured using an automatized glucose oxidase method, with an overall inter-assay coefficient of variation (CV) of <5%. The proportion of hemoglobin A1c (HbA1C) was determined by an immunocolorimetric method in whole blood. Total cholesterol was determined using enzymatic hydrolysis and oxidation. Serum triglyceride concentrations were measured after lipase hydrolysis in an automatic analyzer with a tungsten lamp. The inter-assay CV was 3.04% for total cholesterol and 5.7% for triglycerides. High-density lipoprotein (HDL) cholesterol was measured by an enzymatic colorimetric direct method after eliminating chylomicrons, very-low-density lipoproteins (VLDL), and low-density lipoproteins by enzymatic digestion; the inter-assay CV was 5.02 %.
To assure the precision and accuracy of these measurements, the concentrations of total cholesterol, HDL-cholesterol and triglycerides were adjusted to a standard curve constructed with the determinations of the NIST materials 909b and 1951b, levels I and II, using both an undiluted standard material and a 1:1 dilution, and were measured simultaneously in a second laboratory (Lipids Laboratory, Mexican National Institute of Nutrition - INCMNSZ).
Blood pressure measurement
Blood pressure was measured twice by a trained nurse in the dominant arm using a mercurial sphygmomanometer on two different visits. The first reading was carried out after at least five minutes of seated rest. The second reading was taken five minutes apart from the first. The first Korotkoff sound marked the systolic blood pressure and the fifth sound the diastolic blood pressure. Hypertension was defined when systolic blood pressure >130 mm Hg and/or diastolic blood pressure >85 mm Hg on the first reading, and confirmed by the second reading following the Expert Panel on Detection, Evaluation, and Treatment of High Blood Cholesterol in Adults (Adult Treatment Panel III) criteria.11 In addition, all patients with a previous medical diagnosis of hypertension or currently using antihypertensive medications were defined as having hypertension regardless of the reported systolic or diastolic pressure values.
Operational definitions
Previously diagnosed T2D was defined by self-report of previous medical diagnosis. Newly diagnosed T2D was defined as the presence of fasting glucose >126 mg/dl.12 Hypercholesterolemia was defined as a fasting serum total cholesterol >200 mg/dl. hypertriglyceridemia when > 150 mg/dl. High density lipoprotein cholesterol (HDL) concentration was considered abnormal if <40 mg/dL for females and <50 mg/dl for males. Mixed hyperlipidemia was defined when both cholesterol was >200 mg/dl and triglyceride levels were >150 mg/dl. Normotriglyceridemic hypoalphalipoproteinemia was defined as an HDL cholesterol <40 mg/dl and triglycerides <150 mg/dl. These cut points were selected based on the National Cholesterol Education Program recommendations.11
Other socio-demographic variables
Educational attainment was stratified into three groups: 1) without education, 2) primary and middle school, 3) high school or more. Participants living in a household in which an indigenous dialect was spoken by the mother were considered to be indigenous.13
Comparability between the selected sub-sample and the overall sample of the survey
The mean or frequency of age, sex, area, geographic region, SES, years of education, literacy, indigenous ethnicity, anthropometry, waist circumference, blood pressure, previously diagnosed T2D, dyslipidemias, alcohol consumption and tobacco smoking were compared between the ENSANUT 2006 the sub-sample from which blood was drawn and the rest of the survey participants.
Statistical Analysis
The analysis in the present study adjusted for the complex multistage survey design using the "SVY" module of STATA 8.2,* and by incorporating survey weights for both the total sample and the sub-sample. The differences between the randomly selected sub-sample and the overall survey sample were analyzed by comparing the prevalence and 95% Confidence Intervals (95% CI) or means and 95% CI (depending on the type of indicator). Statistical significance was defined as a p-value <0.05
Ethical Considerations
After explaining the nature, objectives and risks inherent to the study, all participants signed an informed letter of consent. The protocol was approved by the Research, Ethics and Bio-security committees of the National Institute of Public Health. Researchers took provisions for maintaining the due confidentiality of the data collected and to protect the rights stipulated by the Mexican Statistical and Geographic information law.14
Results
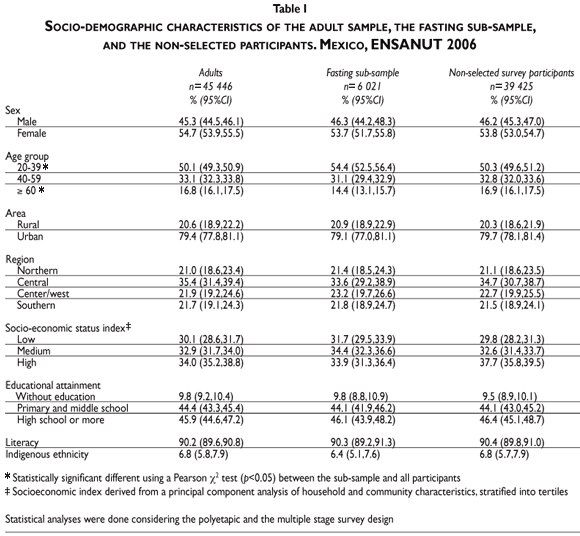
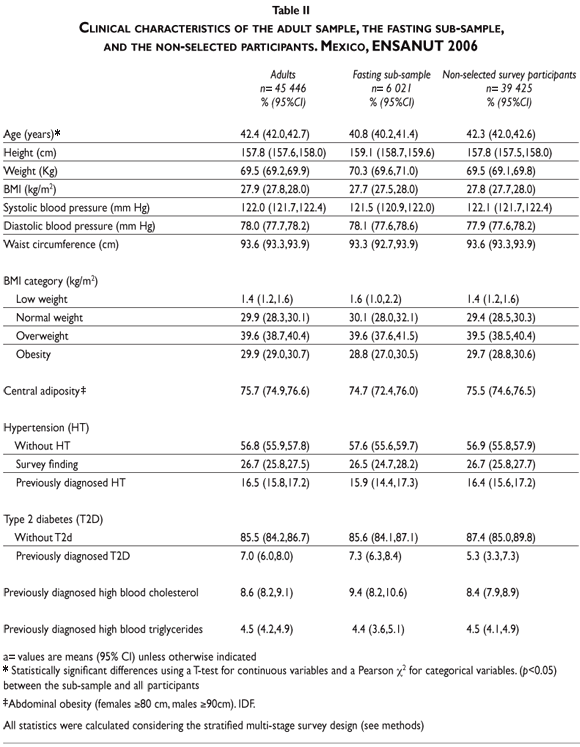
For the fasting sub-sample we randomly selected 6613 subjects from the adult survey. A total of 91% (n=6021) participants from this group were in fasting state at the time of blood collection and were considered the valid fasting sub-sample. The ENSANUT 2006 adult sample comprised a total of n= 45446 participants. The fasting sub-sample was compared to the adults overall survey and to the non-selected fasting participants (n=39425). Table I summarizes the socio-demographic characteristics of the three analytical samples. No significant differences were found among samples by sex, area, region, SES, educational attainment, literacy or indigenous ethnicity. Table II compares some anthropometric characteristics and the prevalence of previously diagnosed T2D and hypertension (HT). There were no significant group differences between means of: height, weight, body mass index (BMI) or waist circumference (WC). In addition no significant differences among the prevalence of overweight/obesity, central adiposity, HBP, T2D, hypercholesterolemia or hypertrigliceridemia were found between the sub-sample and the other two groups (Table III).

Conclusions
In this paper we demonstrate that the survey sub-sample in which blood was drawn is not significantly different from the rest of the adult ENSANUT 2006 survey sample or the non-selected participants, when compared for socio-demographic, anthropometric and biochemical characteristics. Thus, no selection bias is expected in the estimation of T2D prevalences and derived cardiovascular risk indicators.
Acknowledgments
The authors would like to thank the support from Sanofi-Aventis for an unrestricted grant that contributed to the biochemical analysis of this sub-sample. Also we would like to thank Dr. Ricardo Robledo and his team from the National Institute of Public Health's Nutrition Laboratory, and to the Lipids laboratory at the National Institute of Nutrition for their support in the determination of the samples and for the preparation of this manuscript. In addition we would like to thank the support of Kanter R, PhD (Johns Hopkins Bloomberg School of Public Health) for their collaboration in the preparation of this report.
Conflicts of interest
We declare that we have no conflicts of interest.
References
1. Sepulveda-Amor J, Lezana M, Tapia-Conyer R, Valdespino J, Madrigal H, Kumate J. Nutritional status of pre-school children and women in Mexico: results of a probabilistic national survey. Gac Med Mex 1990;126:207-224. [ Links ]
2. Rivera J, Shamah T, Villalpando S, Gonzalez-Cossio T, Hernandez B, Sepulveda J. Encuesta Nacional de Nutrición 1999. Cuernavaca, Morelos: INSP, 2000. [ Links ]
3. Aguilar-Salinas CA, Olaiz G, Valles V, Torres JM, Gomez Perez FJ, Rull JA, et al. High prevalence of low HDL cholesterol concentrations and mixed hyperlipidemia in a Mexican nationwide survey. J Lipid Res 2001;42(8):1298-1307. [ Links ]
4. Olaiz G, Rojas R, Barquera S, Shamah T, Aguilar C, Cravioto P, et al. Encuesta Nacional de Salud 2000. Cuernavaca, Morelos, México: Instituto Nacional de Salud Pública, 2003. [ Links ]
5. Olaiz G, Rivera J, Shamah T, Rojas R, Villalpando S, Hernandez A, et al. Encuesta Nacional de Salud y Nutrición 2006. Cuernavaca, México: Instituto Nacional de Salud Pública, 2006. [ Links ]
6. INEGI. II Conteo de Población y Vivienda 2005. México y sus municipios. México: INEGI, 2008. [ Links ]
7. Barquera S, Peterson K, Must A, Rogers B, Flores M, Houser R, et al. Coexistence of maternal central adiposity and child stunting in Mexico. Int J Obes 2007;doi:10.1038/sj.ijo.0803529. [ Links ]
8. Barquera S, Tovar-Guzman V, Campos-Nonato I, Gonzalez-Villalpando C, Rivera-Dommarco J. Geography of diabetes mellitus mortality in Mexico: an epidemiologic transition analysis. Arch Med Res 2003;34(5):407-414. [ Links ]
9. World Health Organization. Physical status: the use and interpretation of anthropometry. Geneva: WHO, 1995. [ Links ]
10. Alberti KG, Zimmet P, Shaw J. The metabolic syndrome--a new worldwide definition. Lancet 2005;366(9491):1059-1062. [ Links ]
11. Executive Summary of The Third Report of The National Cholesterol Education Program (NCEP) Expert Panel on Detection, Evaluation, And Treatment of High Blood Cholesterol In Adults (Adult Treatment Panel III). JAMA 2001;285(19):2486-2497. [ Links ]
12. Diagnosis and classification of diabetes mellitus. Diabetes Care 2006;29 Suppl 1:S43-S48. [ Links ]
13. Valdespino J, Olaiz G, López B, Palma O, Tapia R, Sepúlveda J. Encuesta Nacional de Salud 2000. Cuernavaca, Morelos, México: INSP, 2003. [ Links ]
14. Ley de Información Estadística y Geográfica. Diario Oficial de la Federación, Estados Unidos Mexicanos. 1980. [ Links ]
Received on: December 11, 2009
Accepted on: April 9, 2010
Address reprint requests to: Dr. Simón Barquera. Instituto Nacional de Salud Pública. Av. Universidad No. 655. Col. Santa María Ahuacatitlán, 62100. Cuernavaca, Mor. México. E-mail: sbarquera@insp.mx
* STATA 10 Corp. In: STATA Reference Manual. Release 7 ed. Texas, USA: STATA Press, College Station; 2007.

