


Serviços Personalizados
Journal

Artigo
 Inglês (pdf)
 Artigo em XML
 Referências do artigo
 Enviar este artigo por email
Indicadores
 Citado por SciELO
 Links relacionados
-
 Similares em
SciELO
Similares em
SciELO
Compartilhar

 Permalink
Salud Pública de México
versão impressa ISSN 0036-3634
Salud pública Méx vol.51 supl.4 Cuernavaca Jan. 2009
ORIGINAL ARTICLES
Overweight and obesity trends in Mexican children 2 to 18 years of age from 1988 to 2006
Tendencias de sobrepeso y obesidad en niños mexicanos de 2 a 18 años de edad: 1988 a 2006
Anabelle Bonvecchio, MPH; Margarita Safdie, MSc; Eric A Monterrubio, MSc; Tiffany Gust, MPH; Salvador Villalpando, PhD; Juan A Rivera, PhD
Instituto Nacional de Salud Pública. Cuernavaca, Morelos, México
ABSTRACT
OBJECTIVE: To describe prevalences and trends of overweight and obesity/OW&OB in Mexican children from 1988 to 2006 at the national level and by relevant subpopulations.
MATERIAL AND METHODS: Prevalences of OW&OB in children aged 2-18 years were estimated using body mass index data from three national surveys conducted in 1988, 1999 and 2006.
RESULTS: Prevalences of OW&OB are high in children of all ages, particularly among school-age and adolescent groups disaggregated by regions, socioeconomic status, urban and rural areas, and ethnic groups. The overall prevalence of OW&OB in children 2 to 18 years old in 2006 was 26.3%. Prevalences by age groups were 16.7% in preschool-age, 26.2% in school-age, and 30.9% in adolescents, using the IOTF classification system.
CONCLUSIONS: Upward trends were observed in school-age children and adolescents at the national level and in all subpopulations.
Key words: nutrition surveys; overweight; obesity; children; adolescents; Mexico
RESUMEN
OBJETIVO: Describir las prevalencias y tendencias de sobrepeso y obesidad (SPyO) en niños mexicanos, de 1988 a 2006, en el ámbito nacional y por subgrupos relevantes de población.
MATERIAL Y MÉTODOS: Las prevalencias de SPyO (peso no saludable) se estimaron usando cifras de índice de masa corporal de tres encuestas nacionales realizadas en 1988, 1999 y 2006.
RESULTADOS: Las prevalencias de SPyO son altas en niños de todas las edades, particularmente en niños de edad escolar y adolescentes, estratificados por regiones, estado socioeconómico, áreas urbanas, rurales y grupo étnico. La prevalencia de SPyO en 2006 fue de 26.3% en el grupo de entre 2 a 18 años de edad, 16.7% en preescolares, 26.2% en escolares y 30.9% en adolescentes, usando la clasificación de The International Obesity Task Force (IOTF).
CONCLUSIONES: Se observa una tendencia de sobrepeso y obesidad en aumento en niños de edad escolar y adolescentes, para todos los subgrupos de población.
Palabras clave: encuestas nutricionales; sobrepeso; obesidad; niños; adolescentes, México
The International Obesity Task Force (IOTF) has estimated that a worldwide total of 155 million school-age children (1 of every 10 children) and over 22 million children under the age of 5 are overweight or obese.1
A direct relationship between obesity in childhood and the development of obesity in adulthood has been well established. The risk of becoming an obese adult is double for obese children than for non-obese children; almost half of obese school-age children (42 to 63%) become obese adults.2-4 The prevalence of overweight and obesity in Mexican adults and children has risen alarmingly in the last two decades and represents a public health challenge. Results from the 1999 National Health and Nutrition Survey (ENSANUT 1999) show that obesity in children was already of concern. The prevalence of obesity and at-risk of obesity (> 85th percentile of the age and gender specific BMI charts developed by CDC in 2000)5 among preschool-age children (2-4 years old) increased approximately 27% from 1988 (21.6%) to 1999 (28.7%).6 In 1999, the prevalence of obesity and at-risk of obesity among children 2-18 years old was 16%6 and the prevalence of overweight and obesity in school-age children 5-11 years old using the IOTF7 classification system was 19.5%.8 These increasing rates raise concerns because of their implications for the future health of the population. Being overweight or obese as a child or in adulthood increases the risk of chronic diseases such as cardiovascular disease, hypertension, type 2 diabetes mellitus (DM2), dyslipidemia and impaired glucose tolerance, among others.9-11 This is of great significance since DM2 and related complications are the leading causes of death among Mexicans.12 In 2000, the prevalence of DM2 among Mexican adults aged 20+ was 7.4%;12 the onset of diabetes in youth increases the risk of cardiovascular disease, kidney failure, visual impairment, and limb amputations in early adulthood. In addition, obesity in children and adolescents has its most immediate consequences in the psychological and social realms. Stigmatization of obese children and adolescents has long been recognized in western cultures, and it is well documented among school peers.13,14 In youth, obesity also affects economic and social development, as evidenced by higher school absentee rates.15
Additionally, widespread bias and discrimination towards adults has been documented based on weight in areas of education, employment and health care.13 In developing countries, obesity is responsible for high health care expenditures since it imposes indirect costs due to the loss of lives, productivity and related income.16 In Mexico, this epidemic is already imposing an unacceptable burden on health systems, which in turn has implications for society with regard to the quality and cost of health care.17 Furthermore, the effects of chronic diseases on the health and survival of adults during their productive age adversely affect the productivity of society.
This article describes the prevalence of obesity in Mexican children (2 to 18 years of age) according to the most recent Mexican National Health and Nutrition Survey 2006 (ENSANUT 2006) and compares the prevalence trends among the three national probabilistic surveys conducted in 1988, 1999 and 2006. This information will be useful for designing interventions targeted to prevent and control obesity among vulnerable groups of Mexican children and adolescents.
Material and Methods
Information from three national probabilistic surveys conducted in 1988,18 1999,19 and 200620 was used to estimate the prevalences of obesity for preschoolers 2-4 years of age, school-age children 5-11 years of age and adolescents 12-18 years of age. The information was representative of national, regional (North, Center, Mexico City and South), rural (pop < 2 500) and urban (pop> 2 500) populations. The design of the surveys was randomized, stratified, and by clusters and has been described in detail in other publications.20,21 The regions included: North (Baja California, Baja California Sur, Coahuila, Chihuahua, Durango, Nuevo León, Sonora and Tamaulipas); Center (Aguascalientes, Colima, Guanajuato, Jalisco, México, Michoacán, Morelos, Nayarit, Querétaro, San Luis Potosí, Sinaloa, Zacatecas); Mexico City (Federal District and urbanized counties in the state of Mexico); and South (Campeche, Chiapas, Guerrero, Hidalgo, Oaxaca, Puebla, Quintana Roo, Tabasco, Tlaxcala, Veracruz, Yucatán).
The numbers of households included in the surveys were 13326, 17716 and 48 304 for the 1988, 1999, and 2006 surveys, respectively.
Variables studied
Anthropometry: Height was measured using stadiometers (Dynatop) with 1 mm precision and body weight (kg) using a digital scale (Tanita) with 100 g precision. Measurements were taken by trained and standardized personnel using standard procedures.22,23
Overweight and obesity were classified according to IOTF criteria, based on BMI measurements, with cutoff points for BMI based on an international reference population drafted from seven countries, specific for age and sex. Said cutoff points are a projection of the criteria proposed by WHO for diagnosing overweight (BMI of 25-29.9) and obesity (BMI of 30 or more) in adults.7
For the purpose of this study, all BMI values below or above the following figures were considered as not plausible and were excluded from the analysis: preschoolers 10-38 kg/m2, school-age children 10-38 kg/m2 and adolescents 10-58 kg/m2.
Informed consent was obtained from the parents or caregivers of participants and they agreed to participate when appropriate. Ethical clearance to conduct the national nutritional surveys was provided by the Human Subject Ethics, Research and Biosecurity Board committees of the National Institute of Public Health (Instituto Nacional de Salud Pública).
Definition of variables: The living conditions index was used as a proxy for socioeconomic level and was constructed for each survey using principal components factor analysis24 based on household characteristics (number of rooms, running water, WC, and construction materials) and assets. The living condition index described in the 1988 survey was 57.9%, in the 1999 survey 56% and in the 2006 survey 46% of the variance. In the three surveys only the first factor was used as the living condition index, which was further divided into tertiles, and from here forward they will be referred to as low, medium and upper socioeconomic status (SES) tertiles.
Ethnicity/Indigenous: In the 1988 survey the households were considered indigenous if located in predominantly indigenous municipalities,* defined as those in which at least 40% of inhabitants spoke an indigenous language. For the 1999 and 2006 surveys, households were defined as indigenous if at least one woman aged 12 to 49 years spoke an indigenous language.
Statistical methods: Descriptive analyses were performed using frequencies stratified at the national level for the four geographic regions, rural and urban areas, SES categories and ethnicity. The prevalences were further divided by age group blocks. Trends for overweight and obesity from the 1988, 1999 and 2006 surveys were calculated. School-age children and male adolescents were not measured in 1988, thus, comparisons for those age groups only include 1999 and 2006. The 95% confidence intervals were calculated for proportions, the Wald25 test was used to estimate differences among groups and logistic models were used to estimate differences among categories. Standard errors were calculated adjusting for the complex sample design26 using the STATA SVY module.
Results
The analysis included 62 494 children ages 2 to 18 years; 9682 from 1988, 19353 from 1999 and 33459 from the 2006 national probabilistic surveys. The subpopulations by age group were: 4239 preschool-age children in 1988, 4716 in 1999 and 5129 in 2006; school-age children included 10046 in 1999 and 15 111 in 2006; there were 5443 female adolescents in 1988, 4591 in 1999 and 6698 in 2006; and 6521 male adolescents in 2006. The samples were representative of the Mexican population.
The national prevalences of overweight and obesity by age groups, region, rural/urban area, sex, living conditions, and ethnic background based on the ENSANUT 2006 are presented in Table I. The overall prevalence of unhealthy weight (the sum of overweight and obesity) in the 2 to 18 year-old population was 26.3%. By age groups, the prevalence was 16.7% for preschool-age children, 26.2% for school-age children and 30.9% for adolescents.
Comparison of prevalences of overweight and obesity by age groups showed the highest prevalence of obesity was in school-age and adolescents groups, while the prevalence of overweight was highest in the adolescent group (Table I).
The highest prevalence of unhealthy weight in preschool-age children was observed in the southern region, followed by Mexico City. Most of the differences among the regions were in the prevalence of overweight; the prevalence of obesity was not different among regions. The highest prevalence of unhealthy weight in school-age children was observed in the Mexico City region, followed by the northern, the central, and the southern regions. Both overweight and obesity accounted for the differences among the regions. The highest prevalence of unhealthy weight in adolescents was observed in the northern region. The differences were mainly due to obesity (Table I).
The prevalence of unhealthy weight was significantly higher in the highest tertile of SES compared to the lowest SES for each of the three age groups as well as for the overall 2-18 year-old group. In preschool-age children the differences in the prevalences of obesity were statistically significant in the high SES tertile compared with the low (p< 0.01). The prevalence of overweight and obesity in school-age children was nearly two times higher in the highest SES tertile compared with the lowest (p< 0.01).
In adolescents the prevalence of unhealthy weight as a whole, and for overweight and obesity specifically, were lower in the low SES tertile relative to the other two tertiles (p< 0.01 and p< 0.05); all differences were statistically significant (p< 0.01) (Table I).
The prevalences of unhealthy weight, overweight and obesity for the overall, the school-age, and the adolescents groups of non-indigenous children were higher than in their indigenous counterparts (p< 0.01). In contrast, the prevalences of unhealthy weight and overweight in preschool-age children were higher in indigenous (p> 0.05) than in non-indigenous children. No differences by sex were found within age group comparisons (Table I).
Trends: The complete information for the three surveys is available only for preschool-age children (both sexes) and for female adolescents. Information on preschool-age and school-age children of both sexes is available for the 1999 and 2006 surveys.
Over the last decade, a clear upward trend has been seen in the prevalence of unhealthy weight, from 21% to almost 27% in female children aged 2-18 years. However, when disaggregated by age group, the upward trend is observed in school-age children and adolescents, but not in preschool-age children.
Figure 1 presents the overall trend of overweight and obesity by age groups, based on the data of the three national probabilistic surveys.

In preschool-age children, an overall increase in unhealthy weight between 1988 and 1999, and a decrease from 1999 to 2006 were observed. The upward and downward trends from 1988 to 1999 and 1999 to 2006 are explained by changes in overweight. No major changes in obesity trends were found over the period.
Unlike the downward trend observed in preschool-age children from 1999 to 2006, the prevalence of unhealthy weight in school-age children increased dramatically, by 1.1 pp/year.
In female adolescents a striking upward trend in unhealthy weight was observed over the last two decades, with a more than threefold increase in prevalence at the national level from 1988 to 2006. This increase is mostly due to the dramatic increment observed in the 1988-1999 period, when the prevalence of unhealthy weight increased about threefold.
Overweight also showed a marked upward trend between 1988 and 1999, with an increase of 184% relative to baseline, compared to only 6.2% relative to baseline between 1999 and 2006. Changes in obesity were smaller in absolute terms, however in relative terms (relative to baseline) increments in obesity were very significant during both periods: 160% between 1988 and 1999 and 121% between 1999-2006.
Preschool-age children: Figure 2 presents trends of overweight and obesity for preschool-age children disaggregated by region, urban and rural areas, and SES tertiles for 1988, 1999 and 2006. Similar upward trends in the 1988-1999 period combined with downward trends in the 1999-2006 period, as observed at the national level, were documented for the North, urban areas, and the two lower SES tertiles. Similar upward trends for 1988-1999 were found for Mexico City, the South and the high SES, but the downward trend from 1999-2006 was smaller; among rural areas, decreasing rates were observed from 1988-2006. Relative to 1988, prevalences observed in 2006 were much higher in Mexico City, the South and the high SES, and much lower in rural areas and the central region (Figure 2).

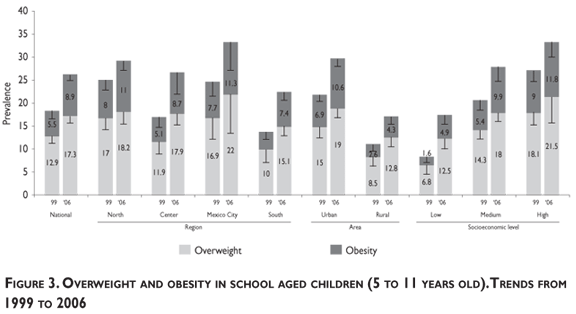
School-age children: Figure 3 presents overweight and obesity trends for school-age children by region, urban and rural areas, and SES. The data available for 1999 and 2006 showed an upward trend for unhealthy weight in all regions, all SES levels, and in urban and rural areas. The prevalence of unhealthy weight in school-age children increased in 2006 about 8pp at the national level. The highest prevalence was observed in school-age children in the highest SES, living in urban areas and in Mexico City (Figure 3). In addition, during this period the prevalence of obesity increased 6.5 pp in indigenous children (data not shown).
Adolescent females: Figure 4 presents overweight and obesity trends for female adolescents by region and urban and rural area, and SES tertiles are presented for 1988, 1999 and 2006. A similar increase in the prevalences of overweight and obesity shown for adolescents at the national level in Figure 1 was observed when they were disaggregated by subpopulations. The highest increase in prevalence (16 pp) of unhealthy weight was observed from 1988-1999. The largest increase in overweight was observed in the central region, urban areas and medium and high SES. The prevalence of obesity within this age group increased almost fourfold from 1988-2006 at the national level. Mexico City was the region with the highest increase in the prevalence of obesity, with 8.5 pp from 1999-2006.

Discussion
The epidemic of overweight and obesity in Mexico is affecting children of all ages, regions, SES, urban and rural areas and ethnic conditions.
We present here evidence of a continuous increase in the prevalence of unhealthy weight among Mexican children and adolescents from 1988 to 2006, such that in the last survey in 2006, approximately 1034 million preschoolers, 4128 million school-age children and 5048 million adolescents had unhealthy weight.
The increase in the prevalence of unhealthy weight was nearly 1pp/year for both school-age and adolescent populations over the last decade, but the trend between 1988 to 1999 in the increment in the prevalence of unhealthy weight in adolescents indicates that it rose faster during that period (1.4 pp/year).
The prevalence of unhealthy weight for both school-age children and adolescent females was higher in the sites with more economic development (northern Mexico and the Mexico City region) than those with less development (central and southern regions), was higher in urban areas than in rural areas and in higher SES than in lower SES. And yet, the prevalence of unhealthy weight was unacceptably high in children belonging to the lowest SES (17.4% school-age children and 26.5% female adolescents) and even for children of indigenous ethnicity, considered the poorest of the poor, prevalence of unhealthy weight increased at a pace of 0.7 pp/year.
The highest contribution to the increase of unhealthy weight from 1999-2006 was overweight for school-age children and obesity for female adolescents, suggesting that early increments in overweight precede later increments in obesity during adolescence years.
The prevalence of unhealthy weight in preschool-age children deserves some consideration. Although relatively high, it remained essentially stable throughout the three surveys, suggesting that regardless of the etiological factors for obesity, their influence begins after age five. This fact is highly important from a programmatic point of view because it represents a window of opportunity to better understand the natural history of the onset of overweight and obesity and to implement primary prevention programs.
The accelerated rates of increase in unhealthy weight in the Mexican population shown here are also observed worldwide. These increasing trends of overweight and obesity are likely to be the consequence of changes in diets and physical activity patterns.27 Convincing evidence links dietary and lifestyle factors and pervading household and school environments to the risk of obesity. Regular physical activity and high intake of dietary fiber decrease the risk, while sedentary lifestyles and intake of energy-dense micronutrient-poor foods increase the risk.3 Poor availability of public places for physical activity and general lack of safety are common barriers in most cities. Over a period of 14 years in Mexico, the purchases of fruits and vegetables dropped 29.3% while purchases of high-density industrialized foods increased 6.3 and sweetened beverages 37.2%.27
These trends are of particular concern because of the increased risk of becoming obese in adulthood5,6 and the early appearance of diet-related non-communicable diseases (DR-NCD) such as DM2, hypertension, and dislipidemia,28 in addition to psychosocial consequences.29 Type 2 DM is highly prevalent in Mexico30,21 and it is one of the leading causes of mortality among the Mexican adult population.12 The onset of NR-NCD during youth and early adult ages seriously affect survival, quality of life and social productivity. In addition, it imposes a great economic burden to the health care system and the economy of families. The health cost of obesity reached approximately 3.6 million USD in 1998; that is, 10.8% of total healthcare expenditure in Mexico. In 2006, an average of 3.5% of household income was spent on health care, however, the households in the lowest decile of SES spent 7.9% of their income on medical care.**
There is an urgent need to design culturally acceptable effective interventions to prevent childhood obesity, especially with regard to how to better approach the environmental factors that are associated with and may be encouraging it. Prevention, the most cost-effective action, should include a clear understanding of the local determinants of childhood obesity and a life cycle approach.
Conclusions
This article furnished evidence that, in Mexico, the onset of obesity occurs very early in life and increases progressively with age. The current epidemic is affecting children from all age groups, SES, regions, urban and rural areas, and both indigenous and non-indigenous populations. The magnitude of the prevalence is large enough to warrant a national prevention strategy.
Acknowledgements
We would like to acknowledge Deborah Salvo-Dominguez for her help in editing this paper.
References
1. Lobstein T, Baur L, Uauy R. Obesity in children and young people: a crisis in public health. Obes Rev 2004;5(supp1):4-85. [ Links ]
2. Serdula MK, Ivery D, Coates RJ, Freedman DS, Williamson DF, Byers T. Do obese children become obese adults? A review of the literature. Prev Med 1993;22:167-177. [ Links ]
3. Joint WHO/FAO Expert Consultation on Diet, Nutrition and the Prevention of Chronic Disease 2002. Geneva: WHO, 2003. WHO Technical Report Series 916. [ Links ]
4. Anderson M. Understanding the childhood obesity epidemic. Colorado State University Extension, Nutrition Resources. [Consulted 2005 January 11]. Available at: http://www.ext.colostate.edu/pubs/foodnut/09317.html [ Links ]
5. Kuczmarski RJ, Ogden CL, Grummer-Strawn LM, Flegal KM, Guo SS, Wei R, et al. CDC growth charts: United States. Advance data from vital and health statistics;no. 314. Hyattsville, Maryland: National Center for Health Statistics, 2000. [ Links ]
6. Instituto Nacional de Salud Pública/Institute of Medicine of the National Academies. Prevención de la obesidad en niños y adolescentes de origen mexicano: taller de colaboración Estados Unidos-México. Mexico: INSP, December 2007. [ Links ]
7. Cole T, Bellizzi M. Establishing a standard definition for child overweight and obesity worldwide: international survey. BMJ 2000;320:1-6. [ Links ]
8. Hernández B, Cuevas-Nasau L, Shamah-Levy T, Monterrubio E, Ramírez-Silva CI, García-Feregrino, et al. Factores asociados con sobrepeso y obesidad en niños mexicanos de edad escolar: resultados de la Encuesta Nacional de Nutrición 1999. Salud Publica Mex 2003;45 Suppl 4:S551-S557. [ Links ]
9. Dietz WH. Health consequences of obesity in youth: childhood predictors of adult disease. Pediatrics 1998;101(3):518-525. [ Links ]
10. Reilly JJ, Methven E, McDowell ZC, Hacking B, Alexander D, Stewart L, et al. Health consequences of obesity. Arch Dis Child 2003;88:748-752. [ Links ]
11. Barquera S, Flores M, Olaiz-Fernadez G, Monterrubio E, Villalpando S, Gonzalez C, et al. Dyslipidemias and obesity in Mexico. Salud Publica Mex 2007;49 Suppl 3:S338-S347. [ Links ]
12. Olaiz-Fernández G, Rojas R, Aguilar-Salinas CA, Rauda J, Villalpando S. Diabetes mellitus en adultos mexicanos. Resultados de la Encuesta Nacional de Salud 2000. Salud Publica Mex 2007;49 supl 3:S331-S337. [ Links ]
13. Puhl RM, Latner JD. Stigma, obesity, and the health of the nation's children. Psychol Bull 2007;133(4):557-580. [ Links ]
14. Mclean L, Edwards N, Garrard M, Sims-Jones N, Clinton K, Ashley L. Obesity, stigma and public health planning. Health Promot Int 2009;24(1):88-93. [ Links ]
15. Geier AB, Foster GD, Womble LG, McLaughlin J, Borradaile KE, Nachmani J, et al. The relationship between relative weight and school attendance among elementary school children. Obesity 2007;15(8):2157-2161. [ Links ]
16. Suarez-Berenguela R, Jacoby E. Assessing the economic impact of obesity and associated chronic disease: Latin America and the Caribbean. FACTS Sheet. Washington, DC: PAHO/WHO, 2006. [ Links ]
17. Rivera J, Sepúlveda-Amor J.Conclusions from the Mexican National Nutrition Survey 1999: Translating results into nutrition policy. Salud Publica Mex 2003;45(4):565-575. [ Links ]
18. Sepúlveda-Amor J, Lezana MA, Tapia-Conyer R, Valdespino JL, Madrigal H, Kumate J. Estado nutricional de preescolares y mujeres en México: resultados de una encuesta probabilística Nacional. Gac Med Mex 1990;126(3):207-224. [ Links ]
19. Rivera-Dommarco J, Shamah-Levy T, Villalpando-Hernández S, González-de Cossío T, Hernández-Prado B, Sepúlveda J. Encuesta Nacional de Nutrición 1999. Estado nutricio de niños y mujeres en México. Cuernavaca, Morelos, México: Instituto Nacional de Salud Pública, 2001. [ Links ]
20. Shamah-Levy T, Villalpando-Hernández S, Rivera-Dommarco JA. Resultados de Nutrición de la ENSANUT 2006. Cuernavaca, Morelos, México: Instituto Nacional de Salud Pública, 2007. [ Links ]
21. Olaiz-Fernández G, Rivera-Dommarco J, Shamah-Levy T, Rojas R, Villalpando-Hernández S, Hernández-Avila M, et al. Encuesta Nacional de Salud y Nutrición 2006. Cuernavaca, Morelos, México: Instituto Nacional de Salud Pública, 2006. [ Links ]
22. Lohman T, Roche A, Martorell R, Ed. Anthropometric standardization reference manual. Champaign (IL): Human Kinetics Books, 1988. [ Links ]
23. Habicht JP. Estandarización de métodos epidemiológicos cuantitativos sobre el terreno (Standardization of anthropometric methods in the field). Bull Pan Am Health Organ 1974;76:375-384. [ Links ]
24. Hair JF, Anderson R, Tatham R, Black W. Multivariate data analysis with readings. 3rd ed. New York (NY): Macmillan Publishing Company, 1992: 223-253. [ Links ]
25. Lehtonen R, Pahkinen E. Practical methods for design and analysis of complex surveys. Chichester, England: John Wiley and Sons, 1995. [ Links ]
26. Hill JO, Wyatt HR, Reed GW, Peters JC. Obesity and the environment: Where do we go from here? Science 2003;299(5608):853-855. [ Links ]
27. Instituto Nacional de Estadística, Geografía e Informática. Encuesta Nacional de Ingresos y Gastos de los Hogares. México DF: INEGI, 1989, 1998 y 2006. [ Links ]
28. Freedman DS, Dietz WH, Srinivasan SR, Berenson GS. The relation of overweight to cardiovascular risk factors among children and adolescent: the Bogalusa Heart Study. Pediatrics 1999;103:1175-1182. [ Links ]
29. Hill AJ, Silver EK. Fat friendless and unhealthy: 9 years old children's perception of body shapes stereotypes. Int J Obes 1995;19:423-430. [ Links ]
30. Olaiz G, Rojas R, Barquera S, Shamah T, Aguilar C, Cravioto P. Encuesta Nacional de Salud 2000. Cuernavaca, Morelos, Mexico: Instituto Nacional de Salud Pública, 2003. [ Links ]
Received on: April 11, 2008
Accepted on: March 25, 2009
Address reprint requests to: Mtra. Margarita Safdie. Centro de Investigación en Nutrición y Salud, Instituto Nacional de Salud Pública. Av. Universidad 655, col. Santa María Ahuacatitlán. 62100 Cuernavaca, Morelos, México. E-mail: msafdie@insp.mx
* Counties
‡ Stata Statistical Software. Release 9.0. College Station (TX, USA): Stata Corporation, 2005.
** Lara A, Berber A, Aguilar-Salinas C. Cost of obesity in Mexico with stress in type 2 diabetes mellitus and hypertension, 2008 (in press).

