


Servicios Personalizados
Revista

Articulo
 Inglés (pdf)
 Artículo en XML
 Referencias del artículo
 Enviar artículo por email
Indicadores
 Citado por SciELO
 Links relacionados
-
 Similares en
SciELO
Similares en
SciELO
Compartir

 Permalink
Salud Pública de México
versión impresa ISSN 0036-3634
Salud pública Méx vol.51 supl.4 Cuernavaca ene. 2009
ORIGINAL ARTICLES
Methodology for the analysis of dietary data from the Mexican National Health and Nutrition Survey 2006
Metodología para el análisis de información dietética de la Encuesta Nacional de Salud y Nutrición 2006
Sonia Rodríguez-Ramírez, MSc; Verónica Mundo-Rosas, MSc; Alejandra Jiménez-Aguilar, MSc; Teresa Shamah-Levy, MSc
Centro de Investigación en Nutrición y Salud, Instituto Nacional de Salud Pública. Cuernavaca, Morelos, México
ABSTRACT
OBJECTIVE: To describe the methodology for the analysis of dietary data from the Mexican National Health and Nutrition Survey 2006 (ENSANUT 2006) carried out in Mexico.
MATERIAL AND METHODS: Dietary data from the population who participated in the ENSANUT 2006 were collected through a 7-day food-frequency questionnaire. Energy and nutrient intake of each food consumed and adequacy percentage by day were also estimated. Intakes and adequacy percentages > 5 SDs from the energy and nutrient general distribution and observations with energy adequacy percentages < 25% were excluded from the analysis.
RESULTS: Valid dietary data were obtained from 3552 children aged 1 to 4 years, 8716 children aged 5 to 11 years, 8442 adolescents, 15951 adults, and 3357 older adults.
CONCLUSIONS: It is important to detail the methodology for the analysis of dietary data to standardize data cleaning criteria and to be able to compare the results of different studies.
Key words: energy, nutrient intake analysis; nutrition surveys; Mexico
RESUMEN
OBJETIVO: Describir la metodología de análisis de la información dietética de la Encuesta Nacional de Salud y Nutrición de México (ENSANUT 2006).
MATERIAL Y MÉTODOS: Se recolectó de la ENSANUT 2006 información dietética de la población mediante un cuestionario de frecuencia de consumo de siete días. Se estimó la ingesta y porcentaje de adecuación de energía y nutrimentos. Se excluyeron del análisis porcentajes de adecuación > 5 DE de la distribución general de energía y nutrimentos y observaciones con porcentaje de energía <25%.
RESULTADOS: Se obtuvo información dietética válida de 3552 niños de entre 1 a 4 años de edad, 8716 niños de 5 a 11 años de edad, 8442 adolescentes, 15 951 adultos y 3357 adultos mayores.
CONCLUSIONES: Detallar la metodología de análisis de la información dietética sirve para estandarizar los criterios de limpieza de la información y hacer comparables los resultados entre diferentes estudios.
Palabras clave: análisis de ingestion de energía y alimentos; encuestas de nutrición; México
One of the main reasons for collecting dietary data through national surveys is to have an integral evaluation of the population nutrition status1 and to be able to provide information about the average dietary intake of a specific population group.2 The use of dietary data can be broadly classified into three categories: monitoring and nutrition surveillance, analysis of the relationship between diet and disease, and evaluation of the impact of policies and programs related to nutrition.3,4
Using methods like 24-hour recall or food frequency allows the identification of dietary indicators that can be employed to compare the intake of nutrient-rich food and its association with risk factors. They also help to establish food-intake patterns in the population.1
Care in dietary data processing (i.e. collection, input of data, cleaning and analysis) must be taken into consideration when designing national surveys to ensure data will be accurate and valid, which will help to adequately estimate energy and nutrient intakes.
Dietary data from several national nutrition surveys are available in Mexico. Dietary information from children and women of reproductive age was obtained in the 1988 survey,5 whereas dietary information from pre-school and school children, as well as from women of reproductive age, was collected in the 1999 national survey. The most recent available data come from the Mexican National Health and Nutrition Survey 2006 (ENSANUT 2006), in which dietary information was collected from pre-school and school children, adolescents, adults, and older adults, for both sexes. Data from this survey are representative at the national, regional, and local urban and rural levels.6,7
It has become necessary to timely document the tools and processes created to analyze, in a confident manner, Mexican population dietary data taken from probabilistic national samples. This paper aims to describe the methodology used for the analysis of dietary data from the ENSANUT 2006.
Material and Methods
Study population: We included data from pre-school children aged 1 to 4 years, school children aged 5 to 11 years, adolescents aged 12 to 19 years, adults aged 20 to 59 years, and older adults aged 60 years and over.
Sample selection: The ENSANUT 2006 was a nationally representative probabilistic survey stratified by clusters. It was carried out from October 2005 to May 2006. Data from 48 304 households were obtained. Collected information included general data about households, health, anthropometry, biochemical tests, and dietary quality and quantity. For determining sample size it was considered that the minor importance proportion (minimum interest prevalence) should have a value of 8.1%. It was also considered that state estimators obtained through the survey should have a 25% maximum relative error, a 95% confidence interval, a 20% nonresponse rate, and a design effect of 1.7, determining a sample size of at least 1 476 households by state. A subsample corresponding to a third of the whole sample was selected for dietary information.8
Informed consent was obtained from each subject or subject's parent or guardian for their participation in the study. The survey protocol was approved by the Ethics Committee of the National Institute of Public Health, Mexico.
Dietary data collection instrument: Dietary information was collected with an adapted version of the semiquantitative food-frequency questionnaire found in the Procedure Handbook for Nutrition Projects, published by the National Institute of Public Health (INSP).9 The questionnaire included 101 foods classified into 14 groups. For each food, number of days of intake per week, times a day, portion size, and number of portions consumed within the seven days before the date of interview were asked.
The food table included in the questionnaire, as well as the portion size (very small, small, medium, large, and very large) and mean weight of portion, for each population group, were estimated by a group of INSP researchers from the analysis of the most-consumed-foods data obtained from the National Nutrition Survey 1999. It is worth mentioning that portion sizes were different for each age group studied.
Personnel training: The food-frequency questionnaire was administered by personnel trained and standardized on collection and input of data. Details on the data collection method are available in the above-mentioned procedure handbook.9 Data were entered into HP Compaq nx 6120 and Dell Latitude D510 laptop computers. Personnel from the INSP developed and validated the electronic questionnaires for input of data into the Fox Pro program version 7. Input was backed up and data were sent daily to the INSP.
Quantity of food consumed: Per-week and per-day quantities of each food consumed was obtained from the number of days per-week, times a day, portion size (weight) and number of portions.
Cleaning of the quantity of each food consumed by setting the maximum values that corresponded to a plausible intake for each age, sex and physiological status group was carried out. Food-frequency tables for every food analyzed were generated to establish plausible intake of each food in each population group (pre-school children, school children, adolescents, adults and older adults), with the goal of observing maximum and minimum number of portions consumed per-week of each food included in the questionnaire. Maximum values considered non-biologically plausible were excluded, although exclusion should not go beyond 1% of accumulated percentage. No minimum value was excluded and all quantities below the maximum cutoff points for each food were considered as valid.
Cleaning of maximum and minimum values of corn flour and wheat flour tortillas: Because tortilla is a staple for the Mexican population, an additional cleaning procedure was performed considering the weight of both corn and wheat tortillas, with a valid interval of 10 g minimum value and 500 g maximum value. Those values came from the mean range observed on tortilla weight reported by the same population. On the basis of that range, mean weight of both corn and wheat tortillas was calculated for each state. Mean weight was also imputed to those cases outside the valid interval.
Energy, macronutrient and micronutrient intakes: Total energy and nutrients contained in each food consumed and in total diet for each individual were estimated through the nutrient composition database compiled by the INSP.* Energy, carbohydrate, protein, fat, fiber, iron (total, heme, and nonheme), zinc, vitamin C, vitamin A, folate and calcium intakes were calculated. Because information was organized by week of intake, total quantities of energy and nutrients were divided by 7 to obtain an average intake per day. With respect to vitamin C, loss during cooking was considered, so the quantity of vitamin C was adjusted depending on type of food and cooking method commonly used.10-13
Some of the items on the food-frequency table were made up of several ingredients, so an average estimation of their nutritional value was performed. That value was calculated by adding the nutrients of each ingredient or food (as specified in the nutrient composition database) employed in Mexican dishes according to the proportions indicated in the recipes. Food was considered in raw condition. Although the estimation is imprecise, not having come from a bromatological analysis, it is a good approximation of the quantity of nutrients contained in some dishes, as it takes into account loss factors and gram conversion, such as densities, edible portion and cooked-raw/raw-cooked factor.
Energy and nutrient adequacy percentage: Nutrient adequacy percentage for children, adolescents and adults was calculated from intake data using the reference values proposed by the United States Institute of Medicine (IOM). The estimation of protein, iron, zinc, vitamin C, retinol and folate adequacy was done using the Estimated Average Requirement.14-19 For calcium, Adequate Intake value was used as reference since the Estimated Average Requirement value has not yet been established because of lack of information for such calculations.20 For carbohydrates and fats, 50 and 30%, respectively, of the energy derived from those macronutrients were used as adequacy values. Reference values for the estimation of protein and micronutrient adequacy are shown in Table I.
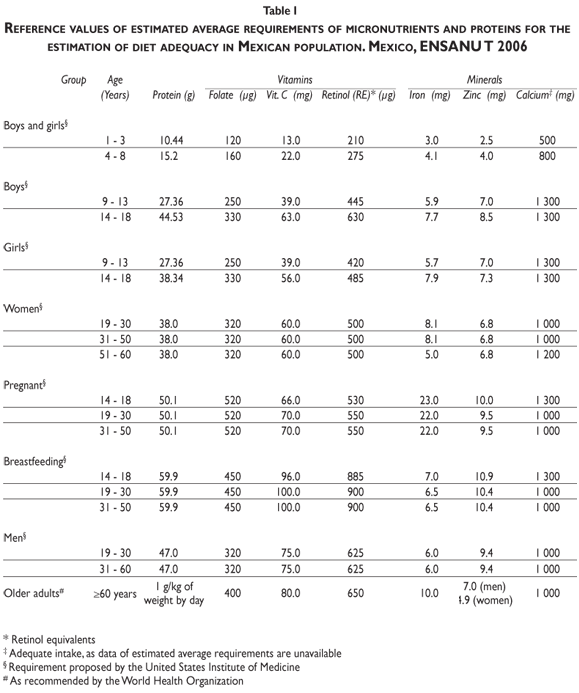
Regarding older adults over 60 years of age, adequacy percentages were calculated in accordance with the guide of nutrition needs for older adults published by the WHO.21
Energy adequacy for each individual was calculated employing the Estimated Energy Requirements as the reference.22 Therefore, it was necessary to make use of several data included in the calculation equations; those data were weight, height, age, and physiological status of each individual. Energy requirements were calculated for those individuals with a body mass index (BMI) within the normal limits for their age and sex. For adults, BMI limits were > 18.5 and < 25; for > 2-years-old children and for adolescents those limits were based on data distribution, considering as minimum value above 1% of the distribution, and as maximum value the cutoff points proposed by Cole et al.23
For those individuals with a BMI outside the normality range, weight corresponding to the BMI limit value, considering the height of the individual, was imputed. For instance, in adults with BMI > 25 the weight corresponding to a BMI of 24.9 was imputed. The same was done for the lower limit value, BMI < 18.5, by imputing the weight corresponding to a BMI of 18.5.
For those individuals without available height and weight data, median value of height and weight for the population with same age, sex, and physiological status, and with data availability, was imputed.
On the other hand, as it is well known, equations require a specific physical activity factor. There was no data on physical activity for this analysis; therefore, we used data from the 1999 National Nutrition Survey that showed that women led a sedentary life.24 Likewise, children were found to have low physical activity, in accordance with a Torun et al. study.25 Regarding men, they also showed low physical activity.
Cleaning of data on intake and percentages of energy and nutrient adequacy: As suggested in dietary analyses,6, 7 intake and adequacy observations greater than 5 SDs from the general distribution of energy, macronutrients, iron, zinc, vitamin C, vitamin A, folates and calcium were excluded from the analysis. Further on, data distribution was graphically analyzed, and those observations within 5 SDs but graphically separated from the conglomerate of the majority of data were eliminated as well. Concerning lower values, energy adequacy values less than 25% were eliminated for all age groups, as adequacy percentages less than that could not represent an intake compatible with life.
Due to the data elimination during the cleaning process, we calculated new expansion factors.
Because dietary data distribution is usually biased toward high values, data are presented as medians, 25 and 75 percentiles of the distribution. The process to obtain nutrient vectors from data was done in Access (Microsoft Office, 2003) using the Visual Basic code and SQL consults. Data cleaning was performed with Stata, version 9.2 (Stata Corporation, TX, USA) and SPSS, version 15.0 (SPSS Inc., Chicago, IL, USA).
Results
We analyzed dietary information of 39998 individuals. Data lost by the cleaning process were between 3.3 and 11.9% among the different groups of population.
Pre-school children: Dietary data from 3959 children less than 5 years old were obtained. Because 461 observations lacked data on weight and height, it was necessary to impute data from the same study population in accordance with age and sex so as to be able to calculate the percentage of energy adequacy.
After cleaning, 407 observations were excluded (10.3%). In 203 of those, there was low energy (less than 25%) or energy adequacy greater than 5 SDs from the adequacy mean. The other 204 observations had adequacies above 5 SDs from the adequacy of several nutrients. Final sample size after cleaning of all the main variables (energy, macronutrients, total iron, zinc, vitamin C, retinol equivalents, folate and calcium) was 3552 observations, which represented a total of 7 836674 children aged 1 to 4 years countrywide.
School children: Dietary data were collected from 9383 children between 5 and 11 years of age. In 396 observations it was necessary to impute height and weight of the distribution median according to age and sex since that data was not available.
Because 667 observations (7.1%) had adequacy percentages above 5 SDs for one or more of the nutrients studied, or an energy adequacy percentage less than 25%, they had to be excluded.
In total, 8716 valid complete data were analyzed, representing 15494558 children aged 5 to 11 years (Table II).

Adolescents: Data from 8 768 adolescents aged 12 to 19 years were obtained. It was necessary to impute height and weight of the distribution median in 532 and 545 observations, respectively, in accordance with age and sex, as those observations lacked that information.
After cleaning, 326 observations (3.7%) were eliminated because of energy and/or nutrient adequacy percentages above 5 SDs or energy adequacy percentage less than 25%. Therefore, 8442 observations with valid dietary information were considered, which represented 18276531 adolescents at a national level.
Adults aged 20 to 59 years: Data from 16494 adults were obtained, and 543 (3.3%) observations were eliminated as they presented intakes and adequacy percentages above 5 SDs or energy intakes less than 25%. Thus, valid information corresponded to 15951 individuals aged 20 to 59 years, who represented a population of 47946764 nationwide.
Older adults: Data from 3812 adults between 60 to 99 years old were collected, and 455 observations were eliminated (11.9%) owing to adequacies above 5 SDs from the energy and nutrient adequacy mean, or energy adequacies less than 25% of those recommended.
In total, valid information was obtained from 3357 adults who represented 11084070 older adults aged 60 years and over nationwide.
Table II shows original sample size and total number of feasible data, by age group and with valid dietary information, obtained through the different cleaning stages.
Discussion
The contribution of this paper is that it shows in detail how the methodology for processing and analyzing dietary data from the ENSANUT 2006 in Mexico was established, from its planning to the presentation of results. This methodology has been used in the presentation of descriptive dietary information of different groups from the population in the ENSANUT 2006.26-29 This paper can be useful to standardize data cleaning in different population groups and in different studies, making it possible to compare results and to handle data easily, as well as to establish criteria and to validate steps for data processing. This information is also very valuable as it comes from a nationally representative survey, which permits the extrapolation of results to all the population.
This methodology is similar to the one employed in other national nutrition surveys. This is the case of the National Nutrition Survey 2005 of Colombia and the NNS-99 in Mexico where, for several nutrients, the reference values proposed by the United States Institute of Medicine were used to estimate adequacy percentage and population at risk of dietary inadequacy. Also, weight limits and physical activity assumption were used to calculate energy adequacy. Unlike ENSANUT 2006, in Colombia 24-hours recall method was employed to obtain the dietary information.30
With regard to the cleaning process, this is similar to the process used in the NNS-99.6,7 We found that the dietary data quality is good, since we had low percentage of losses in the cleaning process (3.3 to 11.9%); the highest losses were for pre-school children (10.3%) and older adults (11.9%), possibly due to bias in the reporting of dietary information.
We consider that the methodology employed is valid since it has been used in other studies with optimal/positive results.
When developing the methodology for processing and analyzing dietary data, researchers must warrant the validity of results since its use is of great importance for evaluating population nutrition status as well as for further planning and evaluation of programs and policies related to food production and marketing, nutrition education and food assistance and security.
Acknowledgements
We are grateful to the group of researchers from the Nutrition and Health Research Center of the National Institute of Public Health, particularly to Alfonso Jesús Mendoza Ramírez, Claudia Ivonne Ramírez Silva, Juan Espinosa Montero, Lucía Hernández Barrera, and Xóchitl Ponce Martínez, for their remarks, which helped to improve the methodology.
References
1. Briefel RR, Sempos ChT, McDowell MA, Chien S (Chia-Ying), Alaimo K. Dietary methods researching the third National Health and Nutrition Examination Survey: Underreporting of energy. Am J Clin Nutr 1997:65 Suppl:1203S-1209S. [ Links ]
2. Perloff B, Rizek R, Haytowitz D. Dietary intake methodology II. USDA's nutrient data base for nationwide dietary intake surveys. J Nutr 1990;120:1530-1534. [ Links ]
3. Rizek R, Pao EM. Dietary intake methodology I. USDA survey and supporting research. J Nutr 1990;120:1525-1529. [ Links ]
4. Murphy SP. Collection and analysis of intake data from the integrated survey. J Nutr 2003;133:585S-589S. [ Links ]
5. Flores M, Melgar H, Cortes C, Rivera M, Rivera J, Sepulveda J. Energy and nutrient consumption in Mexican women in reproductive age. Salud Publica Mex 1998;40:161-171. [ Links ]
6. Barquera S, Rivera J, Espinosa-Montero J, Safdie M, Campirano F, Monterrubio E. Energy and nutrient consumption in Mexican women 12-49 years of age. Analysis of the National Nutrition Survey 1999. Salud Publica Mex 2003;45 Suppl 4:S530-S539. [ Links ]
7. Barquera S, Rivera J, Safdie M, Flores M, Campos-Nonato I, Campirano F. Energy and nutrient intake in preschool and school age Mexican children: National Nutrition Survey 1999. Salud Publica Mex 2003;45 Suppl 4:S540-S550. [ Links ]
8 . Palma O, Shamah T, Franco A, Olaiz G, Méndez I. Metodología. En: Encuesta Nacional de Salud y Nutrición (ENSANUT-2006). Cuernavaca, México: Instituto Nacional de Salud Pública, 2006: 19-33. [ Links ]
9. Ramírez I, Mundo V, Rodríguez S, Vizuet I, Hernández N, Jiménez A. Encuestas dietéticas. In: Shamah-Levy T, Villalpando-Hernández S, Rivera-Dommarco J. Manual de procedimientos para proyectos de nutrición. Cuernavaca, México: Instituto Nacional de Salud Pública, 2006: 27-108. [Consulted 2009 marzo 31]. Available at: http://www.salud.gob.mx/unidades/cdi/documentos/proy_nutricion.pdf. [ Links ]
10. Souci SW, Fachmann W, Kraut H. Food composition and nutrition tables. 6th Edition. Stuttgart, Germany: Medpharm, 2000. [ Links ]
11. Agte V, Tarwadi K, Mengale S, Hinge A, Chiplonkar S. Vitamin profile of cooked foods: how healthy is the practice of ready-to-eat foods? Int J Food Sci Nutr 2002;53(3):197-208. [ Links ]
12. Han JS, Kozukue N, Young KS, Lee KR, Friedman M. Distribution of ascorbic acid in potato tubers and in home-processed and commercial potato foods. J Agric Food Chem 2004;52 (21): 6516-6521. [ Links ]
13. Mareschi JP, Belliot JP, Fourlon C, Gey KF. Changes in vitamin C content of Bintje potatoes during storage and usual culinary preparations. Int J Vitam Nutr Res 1983;53(4):402-411. [ Links ]
14. Institute of Medicine. Protein. In: Dietary Reference Intakes for Energy, Carbohydrates, Fiber, Fat, Protein and Amino Acids (Macronutrients). Washington, DC: Institute of Medicine, The National Academies Press, 2005: 589-630. [ Links ]
15. Institute of Medicine. Vitamin C. In: Dietary reference intakes for vitamin C, vitamin E, selenium and carotenoids. Washington, DC: Institute of Medicine, The National Academies Press, 2000: 95-185. [ Links ]
16 . Institute of Medicine. Iron. In: Dietary reference intakes for vitamin A, vitamin K, arsenic, boron, chromium, copper, iodine, iron, manganese, molybdenum, nickel, silicon, vanadium and zinc. Washington, DC: Institute of Medicine, The National Academies Press, 2000. [ Links ]
17. Institute of Medicine. Vitamin A. In: Dietary reference intakes for vitamin A, vitamin K, arsenic, boron, chromium, copper, iodine, iron, manganese, molybdenum, nickel, silicon, vanadium and zinc. Washington, DC: Institute of Medicine, The National Academies Press, 2000. [ Links ]
18. Institute of Medicine. Zinc. In: Dietary reference intakes for vitamin A, vitamin K, arsenic, boron, chromium, copper, iodine, iron, manganese, molybdenum, nickel, silicon, vanadium and zinc. Washington, DC: Institute of Medicine, The National Academies Press, 2000. [ Links ]
19. Institute of Medicine. Folate: In: Dietary reference intakes for thiamin, riboflavin, niacin, vitamin B6, folate, vitamin B12, pantothenic acid, biotin and choline. Washington, DC: Institute of Medicine, The National Academies Press, 2000:196-305. [ Links ]
20. Institute of Medicine. Calcium. In: Dietary reference intakes for calcium, phosphorus, magnesium, vitamin D and fluoride. Washington, DC: Institute of Medicine, The National Academies Press, 2000:71-145. [ Links ]
21. World Health Organization, Tufts University. Keep fit for life: Meeting the nutritional needs of older persons. Geneva, Switzerland: World Health Organization, 2002. [ Links ]
22. Institute of Medicine. Energy. In: Dietary reference intakes for energy, carbohydrates, fiber, fat, protein and amino acids (macronutrients). Washington, DC: Institute of Medicine, The National Academies Press, 2005:107-264. [ Links ]
23. Cole T, Bellizzi M, Flegal K, Dietz W. Establishing a standard definition for child overweight and obesity worldwide: International survey. BMJ 2000;320:1240-1243. [ Links ]
24. Rivera-Dommarco J, Shama-Levy T, Villalpando-Hernández S, González de Cossío T, Hernández-Prado B, Sepúlveda J. Encuesta Nacional de Nutrición 1999. Estado nutricio de niños y mujeres en México. Cuernavaca, Morelos, México: Instituto Nacional de Salud Pública, 2001. [ Links ]
25. Torun B, Daviel PSW, Livingstone MBE, Poalisso M, Sackett R, Spurr GB. Energy requirements and dietary energy recommendations for children and adolescents 1 to 18 years old. Eur J Clin Nutr 1996;50:S37-S81. [ Links ]
26. Mundo V, Rodriguez S, Shamah T. Energy and nutrient intake in Mexican Children 1 to 5 years old. Results from the Mexican National Health and Nutrition Survey 2006. Salud Publica Mex 2009;51 suppl 4:S530-S539. [ Links ]
27. Flores M, Macías N, Rivera M, Barquera S, Hernández L, García A, et al. Energy and nutrient intake among Mexican school 1-age 1d children. Mexican National Health and Nutrition Survey 2006. Salud Publica Mex 2009;51 suppl 4:S540-S550. [ Links ]
28. Rodríguez-Ramírez S, Mundo-Rosas V, Shamah T, Ponce X, Jimenez A, Gonzalez-de Cossio T. Energy and nutrient intake in Mexican adolescents: Analysis of the Mexican National Health and Nutrition Survey 2006. Salud Publica Mex 2009;51 suppl 4:S551-S561. [ Links ]
29. Barquera S, Hernandez-Barrera L, Campos I, Espinosa J, Flores M, Barriguete JA, et al. Energy and nutrient consumption in adults: Analysis of the Mexican National Health and Nutrition Survey 2006. Salud Publica Mex 2009;51 suppl 4: S562-S573. [ Links ]
30. Instituto Colombiano de Bienestar Familiar. Ingesta dietética. In: Encuesta nacional de la situación nutricional en Colombia, 2005. Bogotá: Instituto Colombiano de Bienestar Familiar, 2006:; 227-316. [ Links ]
Received on: April 11, 2008
Accepted on: November 19, 2008
Address reprint requests to: Mtra. Verónica Mundo. Instituto Nacional de Salud Pública, Av. Universidad 655, col. Santa María Ahuacatitlán. 62100 Cuernavaca, Morelos, México. E-mail: vmundo@insp.mx
* INSP. Bases de datos del valor nutritivo de los alimentos. Compilación del Instituto Nacional de Salud Pública. 2004 (Unpublished document).

