


Servicios Personalizados
Revista

Articulo
 Inglés (pdf)
 Artículo en XML
 Referencias del artículo
 Enviar artículo por email
Indicadores
 Citado por SciELO
 Links relacionados
-
 Similares en
SciELO
Similares en
SciELO
Compartir

 Permalink
Salud Pública de México
versión impresa ISSN 0036-3634
Salud pública Méx vol.47 no.4 Cuernavaca jul. 2005
ARTÍCULO ORIGINAL
Obesity and overweight in IMSS female workers in Mexico City
Obesidad y sobrepeso en mujeres trabajadoras del IMSS, en la Ciudad de México
José Luis Vázquez-Martínez, MD, MScI; Héctor Gómez-Dantés, MD, MScII; Felipe Gómez-García, MDIII; María de los Angeles Lara-Rodríguez, MD, MScIV; Joel Navarrete-Espinosa, MD, MScIV; Gabriela Pérez-Pérez, MD.V
IDivisión Técnica de Información Estadística en Salud. Instituto Mexicano del Seguro Social (IMSS)
IIInstituto Mexicano del Seguro Social
IIIBoard of Orthopedics; Mocel Hospital
IVIntegrated Programs Coordination, IMSS
VBoard of Epidemiology; Integrated Programs Coordination; IMSS
ABSTRACT
OBJECTIVE: To estimate the prevalence and risk factors for overweight (OW) and obesity (OB) in women working at the Mexican Social Security Institute (IMSS, per its abbreviation in Spanish) in Mexico City, using two different classification criteria.
MATERIAL AND METHODS: A cross-sectional study was performed from July 1999 to September 2000. It included 588 women 20 to 65 years of age and who were working at the IMSS. The criteria used to estimate the prevalence of OW and OB were the WHO criteria and the Mexican Official Norm (NOM) for the integrated management of obesity in Mexico.
RESULTS: The frequency of OB, according to WHO criteria, was 27.6% (26% adjusted) and for OW 43.2% (40.2% adjusted). According to the NOM, the levels of OB in those with short height (<1.50 m) increased to 75% and to 52.2% for those with height >1.50 m. Comparison of BMI between the two height groups showed no differences. The risk factor associated with OB and OW was age. Education and exercise were protective factors.
CONCLUSIONS: The high prevalences detected in this particular working group highlight the importance of prevention and control of OB in health personnel because it can result in a high number of disability and premature retirement due to disease. The use of the NOM criteria for the identification of women at risk may be useful for early detection of high-risk groups.
Key words: obesity, overweight, health personnel, women, social security
RESUMEN
OBJETIVO: Estimar la prevalencia de obesidad (OB) y sobrepeso (SP) en mujeres trabajadoras del IMSS en la Ciudad de México, aplicando dos criterios de clasificación y su asociación con algunos factores de riesgo.
MATERIAL Y MÉTODOS: Estudio transversal realizado entre julio de 1999 y septiembre de 2000 que incluyó a 588 mujeres trabajadoras en el IMSS entre 20 y 65 años. Los criterios utilizados para medir la prevalencia de OB y SP fueron los propuestos por la OMS y la Norma Oficial Mexicana para el manejo integral de la obesidad (NOM).
RESULTADOS: La frecuencia de OB fue 27.6% (26% ajustada) y de SP de 43.2% (40.2% ajustada) al aplicar los criterios de la OMS. Conforme a la NOM, los niveles de OB en el grupo de talla baja (<1.50 m) se elevaron a 75% y en el de talla mayor a 1.50 m a 52.2%. Sin embargo, al comparar el índice de masa corporal de talla baja y talla normal no se aprecian diferencias. El factor de riesgo para OB y SP fue la edad. En forma protectora resultaron la educación y el ejercicio.
CONCLUSIONES: Las altas prevalencias de OB y SP en la población estudiada constituyen un riesgo importante para la salud de este grupo de población, que se puede traducir en altos niveles de discapacidad y pensiones con un alto costo para la Institución. Estos resultados demandan la realización de intervenciones que permitan identificar precozmente a mujeres con índices de masa corporal de riesgo. Los rangos propuestos por la NOM pueden ser de utilidad para la identificación precoz de las mujeres en riesgo.
Palabras clave: obesidad, sobrepeso, trabajadoras de la salud, mujeres, seguridad social
Obesity is defined as the physical state in which excess fat stores are associated with various health risks. The most precise way to measure obesity uses direct methods such as computerized tomography, magnetic resonance imaging and densitometry. However, these techniques are complicated, costly and unavailable or inaccessible for population studies. Hence, the estimate of body fat is done indirectly through traditional anthropometric measurements such as body weight, height, body circumferences, and skin fold thickness. A simple and widely accepted weight diagnostic method is the body mass index (BMI) or Quetelet index, which relates body weight with height and is a good indicator of overweight (OW) and obesity (OB).1
Obesity has been clearly established as a public health priority due to its clear association with the occurrence of a broad group of health conditions such as heart disease, diabetes mellitus, arterial hypertension, stroke, and some neoplasms. These conditions rank among the major causes for seeking both primary and specialized health care and result in high hospital admission rates. Moreover, these conditions rank among the major causes of death nationwide.2
The prevalence of obesity has increased remarkably in recent decades. Obesity is considered as a pandemic and is the major contributor to the overall burden of disease in both developed and developing countries.3 The total number of obese people worldwide is estimated in 250 million and the World Health Organization (WHO) has projected that by 2025, around 300 million people will be obese.4 In the Americas region, the predominant pattern shows that obesity is found mainly in urban areas, affects females more than males, has a higher prevalence among adult age groups, and is considered as a poverty-related problem. 5
The Third National Health and Nutrition Examination Survey (NHANES III) conducted in the United States reported a total of 97 million adults with overweight or obesity and 51% of females in that country are overweight.6 Even though weight loss is common in the United States, the prevalence of obesity, considered as a BMI >30 kg/m2, increased from 12% in 1991 to 17.9% in 1998, with the greatest increment (69.9%) reported in the youngest age group, ages 18-29 years. 7 In Mexico, data from the National Health Survey (ENSA-2000) report that 23.7% of Mexicans over 20 years of age are obese.8 Data of the National Nutrition Surveys (ENN- and ENN-99) show an increment in the frequency of OW from 16.4 to 31% and of OB from 18.7 to 21.7% among females.9
The increase in the number of obese people has occurred at a fast rate, both in industrialized and in developing countries, which leads us to consider obesity as a condition that is not exclusive of affluent groups. It is also important to measure these health risks in medical personnel who are directly involved in health promotion and health education to assess their compliance and understanding of their preventing activities.
We decided to conduct this study among the population of working women in the IMSS to estimate the prevalence of obesity and overweight in Mexico City by using an international standard (WHO criteria) as well as the Mexican Official Norm for the integrated management of obesity in Mexico (NOM).
Material and methods
The study was based on the weight and height measurements performed in a cross-sectional study aimed at estimating the prevalence of osteoporosis among female Mexican Social Security Institute (IMSS) workers in Mexico City from July 1999 to September 2000. The total number of female workers in the IMSS in Mexico City was 42 406. The mean age was 40.1 years (standard deviation 8.1 years), and with a mean of 14.6 years of working history in the institution (standard deviation 7.7 years). A total of 588 healthy and non-pregnant females over 20 years of age were selected to participate in the study by means of a multi-stage sampling process. The first stage of the selection process consisted of a simple random sampling of the medical and administrative units in each of the four districts (geographical-administrative divisions) in Mexico City. The number of women from each district was proportional to the total number of IMSS female workers in each district. Participants from each district were distributed according to the proportion represented by each of the following age groups: 20-29; 30-44; 45-49, and 50 and over. The final selection of women was done by a simple random sampling procedure. The body mass index was used to assess the nutritional status of women. It is obtained by dividing body weight in kilograms by the height in square meters (kg/m2). Weight was measured with the least clothing possible (wearing a gown) using a fixed calibrated scale for each measurement. The observer responsible for somatometry was trained by staff specialized in these measurements. A metallic stadiometer was used to measure height with the person barefoot. The following criteria of the Expert Panel for the Identification, Evaluation and Treatment of Adult Overweight and Obesity were used to classify the women based on their nutritional status: malnourished (BMI <18.5 kg/m2); well nourished (BMI=1.5-24.9 kg/m2); overweight (BMI=25.0-29.9 kg/m2) and obese (BMI>30 kg/m2); the latter included only one category. The resulting prevalence rates were age-adjusted according to the age distribution of the XII General Population and Household Census (Mexico) of females over 20 years of age, based on the following percentages: 20-29=33%; 30-39=26%; 40-49=17%, and >50=24%. The Mexican Official Standard criteria for obesity applied in this study considered height using a cut-off point of 1.50 m for females to establish two categories: short height (<1.50 m) and height >1.50 m. The following criteria for overweight and obesity were: for short stature, obesity was defined as a BMI >25 and overweight as a BMI of 23-25; for those with heights >1.50 m, obesity was defined as a BMI >27 and overweight as a BMI of 25-27.10 Confidence intervals of 95% were obtained for each category. Sociodemographic, schooling, job position, gynecological and obstetrics factors, and exercise data (exercise yes or no) were obtained from a structured interview by means of a questionnaire applied by previously trained staff. Physical activity was assessed by type of exercise, time in minutes, times a week, and years of practice. The number of pregnancies included four categories: stillborn; 1-2; 3-4, and >5 pregnancies. Menopause was reported as: none, natural and surgical menopause; tobacco use was classified as actual smoking, smoking in the past, and no smoking. Health risks information was limited to data collected from the survey performed during the osteoporosis study.
Data analysis included measures of central tendency and dispersion in the case of continuous variables. For categorical variables (nominal and ordinal), simple frequencies were calculated. The relation between the nutritional status (obesity, overweight and appropriate weight) and the independent variables studied (age, menopause, exercise practice, number of pregnancies, and schooling) were analyzed through contingency tables using the c2 test. Age was measured in years; menopause was defined as present or absent, doing exercise was categorical (yes and no); number of pregnancies was categorical and schooling was classified according to the following groups: primary-secondary, high school, and professional.
To establish the difference in the BMI among the groups with short and normal stature and educational level, Wilcoxon rank sum test and the Kruskal-Wallis test were used as non-parametric methods due to the skewed distribution of BMI. Since the condition of BMI variance homogeneity for schooling was not met, Bonferroni's test was applied to determine the differences among the groups, after range transformation, as recommended by Conover and Iman.11 The ordinal logistic regression method was used to evaluate the risk of OW and OB according to the risk factors available in the osteoporosis study. The principle ruling this method demands the existence of more than two categories in the dependent variable. The logit recovers the relationship (trend) between the covariables and the dependent variable. The proportional odds was used based on the premise that every logit has a different constant but shares the covariable coefficient. From these estimates one can establish the probabilities of a woman having a given BMI depending on their characteristics (covariables).12 The cumulative probability is equal to the sum of all the probabilities in each category Pr(Y>=j)=Pr(Y=1) + (Pr(y=2) + ....Pr(Y=j), where the sum represents 100%. The covariable coefficients are used to obtain a "score," where score= b1(age) + b2 (education) + b3 (pregnancies) + b4(exercise), and values correspond to the characteristics of each woman. The probability of a normal BMI was calculated as follows: Pr(normal)=1/1 + e score – cut-off value 1; for OW the formula is Pr (OW)= (1/1 + e score – cut-off value 2) - (1/1 + e score – cut-off value 1). The OB BMI is calculated by: Pr(OB)=1 – (1/1 + e score – cut-off value 2).
The database was entered in duplicate using the Epi-Info package, version 6.04, in order to detect data entry errors, and the STATA statistical package, version 7.0 was used for data analysis.
Results
The group of women studied was composed of 588 female workers ages 20 to 65 years, with a mean age of 42.4 years (±9.7). The age-group distribution was as follows: 20-29 years, 74 women (12%); 30-39 years, 152 women (25.8%); 40-49 years, 198 women (33.7%) and the group of >50 years, 164 women (27.9%). The median height was 1.54 m, which is very close to the cut-off point proposed by the NOM. The median weight was 65 kg, and the median BMI was 27.3 kg/m2, higher than the cut-off point proposed by WHO for overweight (BMI >25) and obesity (BMI >27) for normal height individuals (> 1.50 m). The median BMI by age group was: 24.6 kg/m2 for the 20-29 years group; 26.8 kg/m2 for the 30-39 years group; 27.5 kg/m2 for the 40-49 years group; and 28.4 kg/m2 for the group >50 years old.
Since only one woman, with a BMI of 17.3 kg/m2, was classified as malnourished, it was decided to delete this category from the multivariate model. The remaining 587 women had a BMI >18.5 kg/m2. Table I shows the means for age, weight, height and body mass index, together with the rates of menopause, exercise, number of pregnancies and education level, distributed according to the nutritional status.
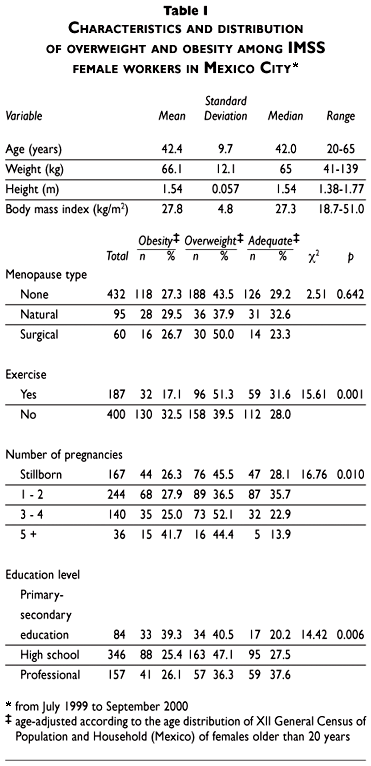
According to the WHO Expert Committee, the prevalence of obesity was 27.6% (n=162; 95% CI= 23.9-3 1.2), the prevalence of overweight was 43.3% (n=254; 95% CI= 39.2-47.2) and only 29.1% of women had an appropriate weight (n=171; CI=95%, 25.6-32.9) (figure 1).
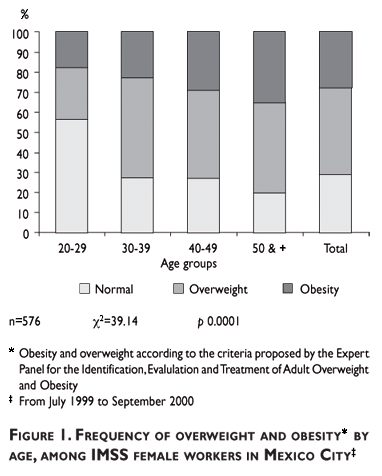
The overall age-adjusted prevalence of overweight and obesity was 25.1% and 39.6%, respectively. On the other hand, the frequency of overweight and obesity increased with increasing age (figure 2). The same effect was observed when the NOM criteria were considered, with the greatest increase reported in the 30-39 years group.
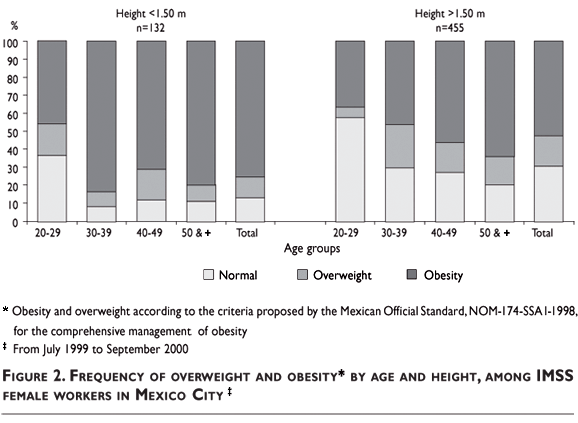
Women with height >= 1.50 m had a lower obesity rate than short height women. However, the obesity rate was higher for both groups (<1.50 m and >1.50 m) when the NOM criteria were applied (figure 3). When values of BMI distribution were compared for short stature (median=27.97) and normal (median=27.82), no significant differences were reported using the Wilcoxon rank sum test (z=0.854 p=0.3029).
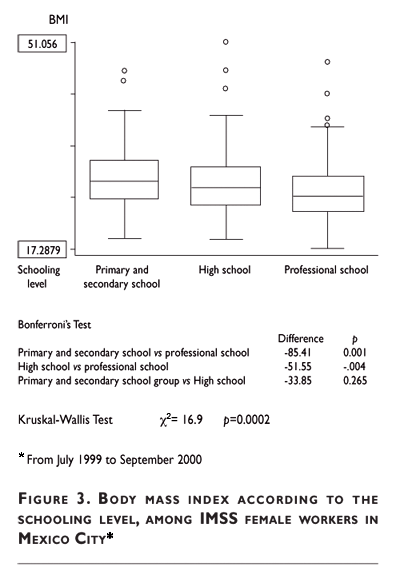
The nutritional status (obesity and overweight) was associated with menopause, exercise practice, number of pregnancies (Table I) and schooling level (Figure 3). Bonferroni's test showed differences in the BMI (transformed by ranges) between the lowest schooling category (primary-secondary grade school) and the highest schooling group (a difference of -85.41; p<0.0001). The same situation was observed when the high school group was compared with the women with the highest schooling level, with a difference of -51.55 and p<0.004. No significant differences were seen between the primary-secondary school group and the high school group (-33.85 difference; p=0.265). Smoking was not associated with BMI in any of the three categories: actual smoking (median BMI 27.1 kg/m2), past smoking (median BMI 28.0 kg/m2) and no smoking (median BMI 27.3 kg/m2). Physical activity was measured as practice of exercise (yes or no) and was positive in one third of the sample surveyed (198/588= 32.7%). By type of exercise, only two women exceeded 10%: aerobics (68/588=11.6%) and walking (65/588=11.1%), with a median time of exercise of 60 and 30 minutes respectively, for 3 to 4 times weekly and a duration of 2 to 3 years.
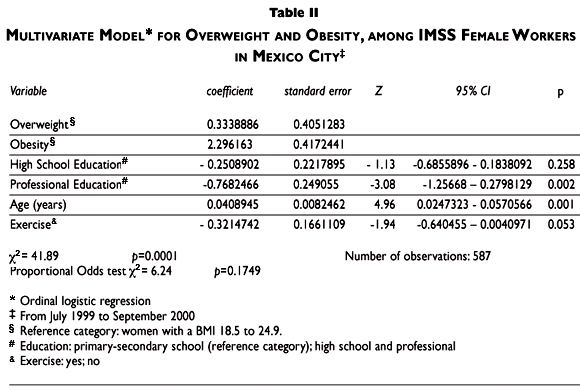
In the multivariate model, age showed an association with overweight and obesity. Education and exercise were associated as protective factors with overweight and obesity, while the effect of menopause and number of pregnancies was lost for overweight and obesity (Table II). In other words, age increases the probability of OW and OB while the opposite happens with exercise and educational attainment.
Discussion
Data available for the past two decades show an important increase in the OW and OB rates worldwide.13 It is a Pan-American ailment.5,6 In our country, the ENN-99 demonstrated an important increase in the OW and OB rates in women, as compared with the prevalence detected in 1988 (ENN-88). Differences by type of locality consisted of a higher frequency of OW and OB in urban areas and, by geographical region, in the Northern Region and Mexico City. 9,14.
The results of this study point at a higher prevalence of OW (crude: 43.3%; adjusted: 40.2%) and OB (crude: 27.6%; adjusted: 26%) in the study population, as compared with the data reported by the ENN-99 (OW: 30.6%; OB: 21.2%). The OW and OB rates from this study were higher than those reported by the ENN-99 for urban localities (OW: 31.5%; OB: 19.8%). These frequencies highlight that two thirds of female workers (28 072 out of 42 406) have OW or OB and are at risk of suffering the medical consequences linked to these conditions: diabetes, high blood pressure, ischemic heart disease, and cerebrovascular diseases. This profile results in a financial burden to the IMSS because of the high indices of disability and increased pensions due to premature morbidity and mortality.22
The OW and OB rates grow as age increases and this same pattern has been observed in various populations, such as the one surveyed by the NHANES III in the United States and by the First Obesity Survey in Uruguay. Both of them showed that OW and OB rates went up as age increased and that this increase was more pronounced in women than in men after age 55.6,15
The higher OW and OB rates from our study are alarming due to the demographic transition our country is going through, which involves an increase in chronic conditions associated with OW and OB that are expressed directly on the female population in general, and particularly in the female working population.16 This phenomenon may become even more critical in the medium and long term due to the frequency of obesity among boys (5%) and girls (6%) ages 0-5 years in our country.9 Recently imposed lifestyles, such as the intake of carbohydrate and fat-rich foods lead to assume that this problem has a rising trend in the Mexican society.17,l8
The findings reported using the two criteria in this study did not reveal any substantial differences in the prevalences of BMI between the two height groups; nevertheless, we stand in favor of detecting and preventing those diseases linked to OB and OW before the WHO criteria are met. The criteria established by the NOM could be used with that purpose in mind, otherwise, there is no sense in having that Mexican standard. The application of the NOM criteria for OW and OB resulted in a higher prevalence of OB in the study population. This is because the cut-off points proposed by the NOM to define obesity are lower and more useful, since the risk for various chronic conditions goes up directly as the BMI increases. Huan Z et al have found that as the BMI goes up, the risk of hypertension is higher, and vice versa –as the former goes down, the latter decreases.19 The same findings were reported by the National Health Survey (ENSA-2000) in Mexico, which reported the same increased risk of hypertension with higher BMI figures.20
Other conditions, such as diabetes mellitus, dyslipidemias and albuminuria were also associated with increases in the BMI. A BMI >25 kg/m2 represents a high risk for these conditions.21,22 Data confirm that the risk of stroke in women occurs at a BMI >27 kg/m2.23 In our study, the median BMI was 27.3 kg/m2, which means that 50% of the women are already at risk of stroke. Women 40 years old are at considerable risk since their median BMI was 27.5 kg/m2.
Our study findings are consistent with those from other reports. Climacteric women undergo endocrine changes that affect the make-up and distribution of body fat and make them prone to obesity and to various chronic conditions. In the study population menopause was associated with a higher obesity rate, but the association was lost after adjusting for age. However, other studies support an increase in BMI among women during menopause.24,25 This study reports overweight and obesity rates among women who perform little physical activity, but no risk gradients could be established between OW and OB and the degree of physical activity. A limitation of this study is the temporal ambiguity between BMI and exercise where no causal relationship can be ascertained. Nevertheless, physical activity and exercise have been associated with decreases in the BMI.26 Education was a protective factor against OW and OB and this same effect was reported by Lahti-Koski M. et. al, who found an increased BMI with lower schooling levels, assuming that low educational level is associated with a low level of knowledge of obesity and its links to other diseases.27
One of the limitations of this study is the absence of an effect of diet on the OW and OB rates, the reason being that the survey was aimed at specifically measuring calcium and hence important food variables for OW and OB were omitted.
The overweight and obesity rates reported for the IMSS female working population represent an important risk for chronic conditions both in the short and long term. Thus, there is a need to emphasize prevention and control programs aimed at this population, particularly considering the decreased incidence of chronic conditions that is associated with a decrease in BMI. This is especially relevant, since due to their occupation, one would think that this population would be more informed about preventive programs and have more access to them. The IMSS has launched an intensive preventive strategy (PREVENIMSS) directed to the population at large, to the working population, and to the health personnel in its medical units, where detection of overweight and obesity is an outstanding component of the early detection program. While health interventions are focused on individual lifestyle changes, the health personnel is responsible for counseling the population about exercise and change in diet, as well as promoting healthy lifestyles. Thus we cannot expect this kind of programs to succeed and have an impact on the general population if this important risk factor is not properly controlled among a population group that is better informed than the general population and, moreover, is constantly exposed to risk reduction and healthy life-style campaigns.
References
1. World Health Organization. Physical status: the use and interpretation of anthropometry. Report of a WHO Expert Committee. World Health Organ Tech Rep Ser. 1995;854:1-452. [ Links ]
2. Fundación Mexicana para la Salud. Obesidad en México. Grupo Nacional de Consenso en Obesidad. México, DF: FUNSALUD, 1997. [ Links ]
3. Visscher TLS, Seidell J C The public health impact of obesity. Annu Rev Public Health 2001;22:355-75. [ Links ]
4. World Health Organization. Life in the 21st Century: a vision for all. The World Health Rep. Geneva Switzerland:WHO,1998. [ Links ]
5. Peña M, Bacallao J. La Obesidad en la pobreza: un problema emergente en las Américas. En: Un nuevo reto para la salud pública. Washington, D.C: Organización Pan Americana de la Salud; 2000:3-11. (Publicación Cientifica No. 5769). [ Links ]
6. Flegal KM, Carrol MD, Kuczmarski RJ, Johnson CL. Overweight and obesity in the United States: prevalence and trends, 1960-1994. Int J Obes Relat Metab Disord 1998;22(1):39-47. [ Links ]
7. Mokdad AH, Serdula MK, Dietz WH, Bowman BA, Marks JS, Koplan JP. The spread of the obesity epidemic in the United Stares, 1991-1998. JAMA 1999,282(16):1519-1522. [ Links ]
8. Olaiz G, Rojas R, Barquera S, Shamah T, Aguilar C, Cravioto P, López P, Hernández M, Tapia R, Sepúlveda J. Encuesta Nacional de Salud 2000. Tomo 2. La salud de los adultos. Cuernavaca, Morelos, México: Instituto Nacional de Salud Pública, 2003:36-46. [ Links ]
9. Rivera Dommarco J, Shamah Levy T, Villalpando Hernández S, González de Cossío T, Hernández Prado B, Sepúlveda J. Encuesta Nacional de Nutrición 1999. Estado nutricio de niños y mujeres en México. Cuernavaca, Morelos, México: Instituto Nacional de Salud Pública, 2001. [ Links ]
10. Secretaria de Salud. Norma Oficial Mexicana NOM-174-SSA1-1998, Para el manejo integral de la obesidad. México: SSA,1998. [ Links ]
11. Conover WJ, Iman RL. Rank transformations as a bridge between parametric and nonparametric statistics. Amer Statistician 1981;35:124-133. [ Links ]
12. Ananth CV, Kleinbaum DG. Regression Models for Ordinal Responses: A review of Methods an Applications. Int J Epidemiol 1997;26(6):1323-33. [ Links ]
13. World Health Organization. Obesity: preventing and managing the global epidemic. Report of a WHO Consultation presented at: the World Health Organization; June3-5, 1997; Geneva, Switzerland. Publication WHO/NUT/NCD/98.1. [ Links ]
14. Hernández B, Peterson K, Sobol A, Rivera J, Sepúlveda J, Lezana MA. Obesity among 12-49 year-old women and children aged under five in Mexico. Salud Publica Mex 1996;38:178-188. [ Links ]
15. Pisabarro R, Irrazábal E, Recalde A. Primera Encuesta Nacional de Sobrepeso y Obesidad (ENSO I). Rev Med Uruguay 2000;16:31-38. [ Links ]
16. Stern C. Tuirán R. Transición demográfica y desigualdad social en México. Ponencia presentada en la IV Conferencia Latinoamericana de Población. La transición demográfica y desigualdad social en América Latina y el Caribe, México, marzo de 1993. [ Links ]
17. Hernandez B, Gortmaker SL, Colditz GA, Peterson KE, Laird NM, Parra-Cabrera S. Association of obesity with physical activity, television programs and other forms of video viewing among children in Mexico City. Int J Obes 1999;23(8):845-54. [ Links ]
18. Dietz WH. Gortmaker SL. Preventing Obesity in Children and Adolescents. Annu Rev Public Health 2001;22:337-53. [ Links ]
19. Huang Z, Willet WC, Manson JE, Rosner B, Stampfer MJ, Speizer FE, Colditz GA. Body weight, weight change, and risk for hypertension in women. Ann Intern Med 1998;128:81-88. [ Links ]
20.Velázquez-Monroy O, Rosas-Peralta M, Lara-Esqueda A, Gustavo Pastelín-Hernández G. Hipertensión arterial en México: Resultados de la Encuesta Nacional de Salud (ENSA) 2000. Arch Cardiol Mex 2002;72:71-84. [ Links ]
21. Ko GTC, Chan JCN, Cockram CS, Woo J. Prediction of hypertension, diabetes, dyslipidaemia or albuminuria using simple anthropometric indexes in Hong Kong Chinese. Int J Obes Relat Metab Disord 1999;23:1136-1142. [ Links ]
22. National Institute of Health, NHLBI. Obesity Education Initiative; North American Association for the Study of Obesity. The practical guide to the identification, evaluation and treatment of overweight and obesity in adults. Bethesda, Maryland:NIH;2000. [ Links ]
23. Rexrode KM, Hennekens CH, Willett WC, Colditz GA, Stampfer MJ, Rich-Edwards J, Speizer JE, Manson JE. A prospective study of body mass index, weight change, and risk of stroke in women. JAMA 1997;277:1539-1545. [ Links ]
24. Poehlman ET, Toth MJ, Gardner AW. Changes in energy balance and body composition at menopause: A controlled longitudinal study. Ann Intern Med 1995; 123: 673-5. [ Links ]
25. Pisabarro R. Metabolismo y climaterio: la visión de un endocrinólogo. Rev Med Uruguay 2000;16:144-151. [ Links ]
26. French SA, Store M, Jeffery RW. Environmental Influences on Eating and Physical Activity. Annu Rev Public Health 2001; 22:309-35. [ Links ]
27. Lahtí-Koski M , Vartiainen E, Mansito S, Pietinen P. Age, education and occupation as determinants of trends in body mass index in Finland, 1982 to 1997. Int J Obes Relat Metab Disord 2000;24(12):1669-76. [ Links ]
Received on: May 25, 2005
Accepted on: July 1, 2005
Address reprint requests to: Dr. José Luis Vázquez Martínez. División Técnica de Información Estadística en Salud. Instituto Mexicano del Seguro Social (IMSS). Durango 289-6º piso, Col. Roma Código Postal 06700, México, D.F., México.E-mail: jose.vazquezma@imss.gob.mx

