


Services on Demand
Journal

Article
 English (pdf)
 Article in xml format
 Article references
 Send this article by e-mail
Indicators
 Cited by SciELO
 Related links
-
 Similars in
SciELO
Similars in
SciELO
Share

 Permalink
Salud Pública de México
Print version ISSN 0036-3634
Salud pública Méx vol.45 suppl.4 Cuernavaca Jan. 2003
ORIGINAL ARTICLE
Energy and nutrient consumption in Mexican women 12-49 years of age: analysis of the National Nutrition Survey 1999
Consumo de energía y nutrimentos en mujeres mexicanas de entre 12 a 49 años de edad: análisis de la Encuesta Nacional de Nutrición 1999
Simón Barquera, MD, MSc; Juan A Rivera, MS, PhD; Juan Espinosa-Montero, BS; Margarita Safdie, MSc; Fabricio Campirano, MSc; Eric A Monterrubio, BS
Centro de Investigación en Nutrición y Salud, Instituto Nacional de Salud Pública, Cuernavaca, Morelos, México
ABSTRACT
OBJECTIVE: To describe the reported energy and nutrient intake and adequacies in Mexican women.
MATERIAL AND METHODS: A 24-hour dietary recall was used to obtain nutrient intake in a representative sub-sample of 2 630 women from 12 to 49 years of age from the National Nutrition Survey 1999. Nutrient adequacies were estimated using the Dietary Reference Intakes and stratified according to region, area (urban or rural), socioeconomic status and obesity status (non-obese: BMI <30 kg/m2, obese: >30 kg/m2). Differences were analyzed using linear regression for complex surveys of log-transformed intake and adequacy, adjusting for multiple comparisons with the Bonferroni test.
RESULTS: The median national energy intake was 1 471 kcal. The Risk of Inadequacy (RI) (prevalence of adequacy <50%) was: vitamin A:38.3%, vitamin C: 45.5%, and folate: 34.3%. Carbohydrates, folate, iron and calcium intake was significantly higher in rural than in urban areas. The RI was higher in women of the lowest socioeconomic status tertile for all nutrients with the exception of carbohydrates and calcium. Macro-nutrient adequacies were significantly higher in non-obese women.
CONCLUSIONS: Differences within the country among regions, rural and urban areas, and socioeconomic status tertile reflect an increasing availability of inexpensive calorie-dense foods in marginal groups. However, total energy, cholesterol, saturated and total fat were consumed in greater quantities by women from the higher socioeconomic status tertile and from urban areas. These patterns could be a contributing factor to the rise of obesity and other non-communicable nutrition-related chronic diseases in Mexico. The English version of this paper is available at: http://www.insp.mx/salud/index.html
Key words: diet; nutritional transition; epidemiologic transition; obesity, dietary reference intake; probabilistic survey; Mexico
RESUMEN
OBJETIVO: Describir la ingesta reportada de energía y nutrimentos en mujeres mexicanas.
MATERIAL Y MÉTODOS: Se utilizó un recordatorio de 24 horas para obtener la ingesta de energía en una submuestra representativa de 2 630 mujeres de 12 a 49 años de edad de la Encuesta Nacional de Nutrición 1999. Las adecuaciones nutrimentales se estimaron utilizando las Referencias de Ingesta Dietética y fueron estratificadas por región, área urbana o rural, nivel socioeconómico y presencia de obesidad (no-obesas: IMC <30 kg/m2, obesas: >30 kg/m2). Las diferencias se analizaron utilizando modelos de regresión lineal para encuestas complejas del logaritmo de la ingesta y la adecuación, ajustando para comparaciones múltiples con la prueba de Bonferroni.
RESULTADOS: La media nacional de ingesta de energía fue de 1 471 kcal. El riesgo de inadecuación (prevalencia de adecuación <50%) fue vitamina A: 38.3%, vitamina C: 45.5% y folato: 34.3%. La ingesta de carbohidratos, folato, hierro y calcio fue significativamente más alta en áreas rurales que en las urbanas. El riesgo de inadecuación fue mayor en mujeres del nivel socioeconómico más bajo para todos los nutrimentos con excepción de carbohidratos y calcio. Las adecuaciones de macro-nutrimentos fueron significativamente mayores en mujeres no-obesas.
CONCLUSIONES: Las diferencias entre las regiones, áreas del país y terciles de nivel socioeconómico reflejan una disponibilidad creciente de alimentos densamente calóricos de bajo costo en grupos marginales. Sin embargo, la energía total, colesterol y la grasa saturada y total se consumieron en mayores cantidades por mujeres del tercil de nivel socioeconómico más alto y áreas urbanas. Estos patrones pueden estar contribuyendo al incremento de la obesidad y otras enfermedades no transmisibles en México. El texto completo en inglés de este artículo también está disponible en: http://www.insp.mx/salud/index.html
Palabras clave: dieta; transición nutricional; transición epidemiológica; obesidad; ingesta dietética de referencia; encuesta probabilística; México
Dietary studies are relevant for improving our understanding of the role of nutrition in preventing certain diseases, for identifying causes of public health problems and cost-effective interventions aimed at reducing potential health risks. Changes in food patterns and intake in countries such as Mexico experiencing an epidemiological transition must be carefully analyzed. The co-existence of non-communicable chronic diseases and nutrient deficiencies present a difficult challenge to health planners.1-5 Diverse socioeconomic, environmental and demographic factors affect dietary consumption. In addition, cultural perceptions and traditions influence food intake.6,7 Finally, the growing urbanization with increased access to energy-dense industrialized foods has an effect on dietary patterns with potential health consequences, in particular for marginal vulnerable populations.8-10
National consumption of energy and nutrients in the Mexican diet has been described using data collected 11 years previous to the present study.11,12 The target group for this questionnaire were women between 12 and 49 years of age. This group has been considered a priority due to their fertility status, central role in the household food resource allocation and family health care.12-14 Nutritional status of women of childbearing age affects not only their health but also contributes to the newborn's health, with a potential transgenerational impact.15-20
The objective of this analysis is to describe the reported energy and nutrient intake in women 12-49 years of age, obtained from the National Nutrition Survey (NNS) 1999.
Material and Methods
The National Nutrition Survey 1999
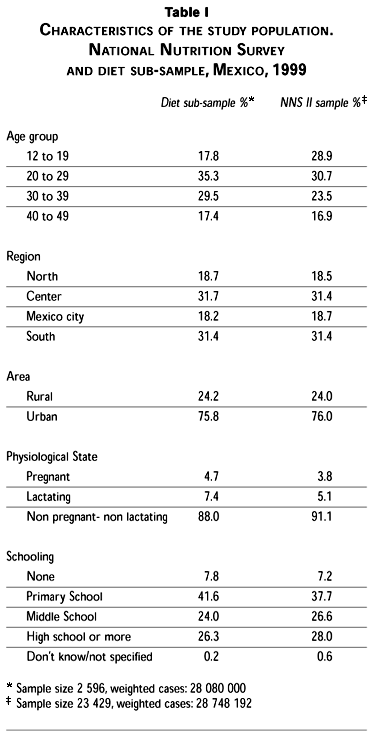
This analysis used data obtained from the NNS II (1999); a national probabilistic survey representative of the country with sampling power to disaggregate into urban (Pop>2 500) and rural (Pop<2 500) areas or by four country regions: a) North (Baja California, Baja California Sur, Coahuila, Chihuahua, Durango, Nuevo León, Sonora, Tamaulipas); b) Center (Aguascalientes, Colima, Estado de México, Guanajuato, Jalisco, Michoacán, Morelos, Nayarit, Querétaro, San Luis Potosí, Sinaloa, Zacatecas); c) Mexico City, and d) South (Campeche, Chiapas, Guerrero, Hidalgo, Oaxaca, Puebla, Quintana Roo, Tabasco, Tlaxcala, Veracruz, Yucatán). The objective of this survey was to characterize the nutritional status as well as the food and nutrient patterns of pre-school and school-age children, and women of childbearing age in Mexico. A detailed description of the sampling procedures and survey methodology has been published elsewhere.21,22 Approximately 4 200 women of childbearing age (12 to 49 years of age) from the selected households participated in this survey.
Socioeconomic status index
The NNS 1999 collected socioeconomic information such as household conditions (flooring material, ceiling, walls, number of persons residing in the household), basic services infrastructure (i.e., water source and disposal) and possession of domestic appliances (i.e., radio, television and refrigerator). A principal component analysis was constructed following a methodology previously reported in the first National Nutrition Survey (1998).3 With this information a main factor explaining 56.1% of the socioeconomic information variability was extracted. This factor had large loadings for household and community characteristics such as sewer system and indoor plumbing. It was divided into tertiles and used as a proxy for low, medium and high socioeconomic status.
Dietary information
To estimate food consumption of women and children in the first and second National Nutrition Surveys, a previously validated 24-hour dietary recall (24-h DR) was used. Nutrient intake information in a sub-sample of 2 630 women from 12 to 49 years of age was obtained. This sub-sample was representative of the country and its regions. It included one of every 5 households in the sample and one woman per household. A detailed description of the sampling strategy has been published previously.21 Standardized personnel applied the questionnaires and converted each reported preparation into grams or milliliters of individual foods. Nutrient intake was then estimated using a comprehensive nutrient composition database compiled from diverse references.23-28
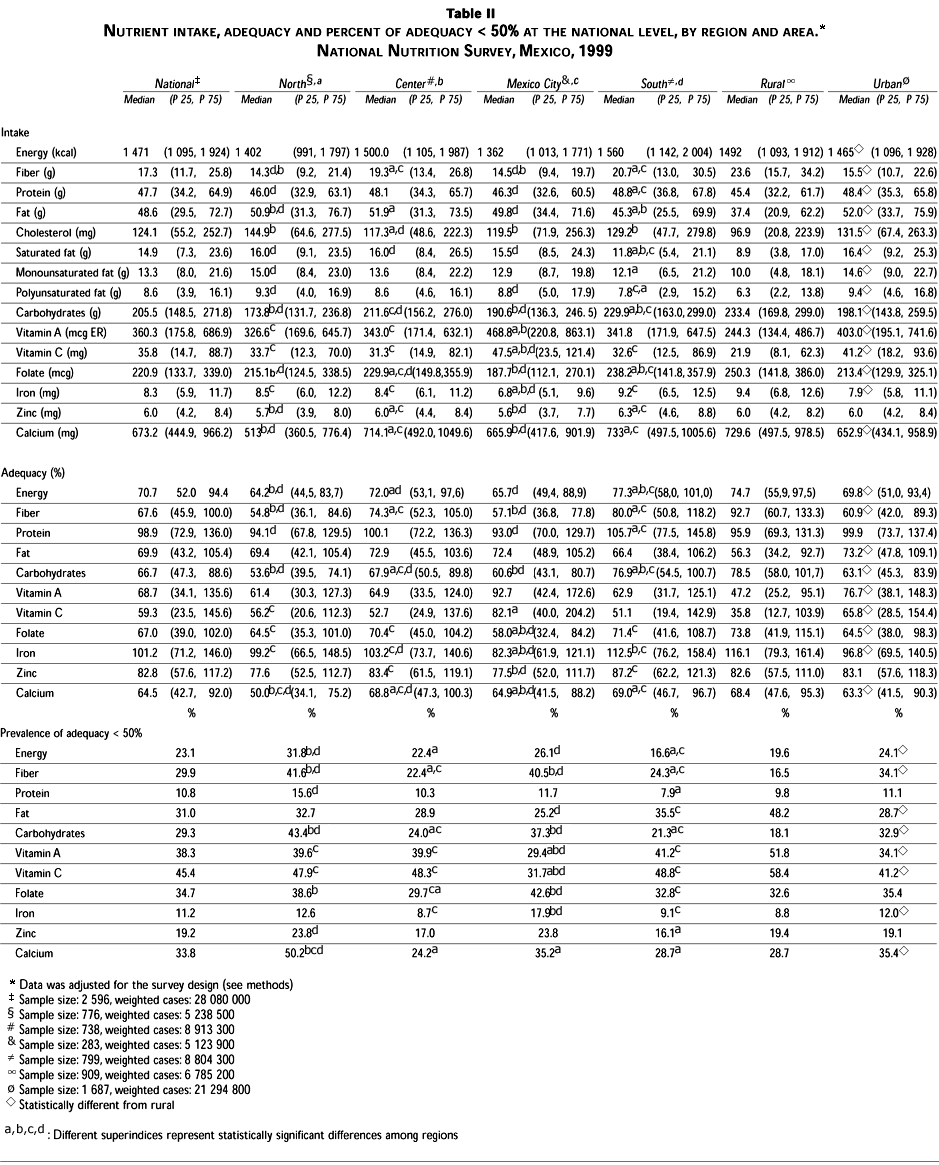
Nutrient adequacies were estimated using as reference the following Dietary Reference Intakes (DRIs): Estimated Average Requirement (EAR) for vitamin A, vitamin C, folate, iron, zinc and calcium and Adequate Intakes (AI) for energy, protein, fat (using 30% of the total caloric intake as the cut-off point), carbohydrates and fiber.29-33 Aberrant reported consumptions and adequacies were reviewed case by case and corrected when possible. If the value was not biologically plausible but information to correct it was not available, the case was eliminated. Adequacy was then estimated as the percentage of consumption relative to the requirement. Requirements for women with a Body Mass Index (BMI) <19 kg/m2 (1.9%) or with missing anthropometric information (3.5%), were estimated based only on the corresponding adequacy for age. The requirements for pregnant (4.9%) or lactating (8.2%) women were considered. Only half of the energy DRI for lactating women was added when partial breast-feeding (breast milk plus formula or foods) was reported.34 Due to missing or aberrant information 34 cases (1.29%) were excluded from this analysis.
Data analysis
Once the nutrient intake database was cleaned of aberrant values, nutrient intakes were calculated for all women and stratified according to the following factors: region (North, Center, Mexico City, South), area (urban or rural), socioeconomic index tertiles and, for non-pregnant and non-lactating women >18 years of age, in body mass index group (non-obese: <30 kg/m2 and obese: BMI >30 kg/m2).
Nutrient consumption was expressed as nutrient quantity and percentage of adequacy. Due to the skewed distribution of nutrient intake consumption, data were reported as medians with interquartile range instead of means to avoid overestimating consumption. Risk of inadequacy was evaluated calculating the prevalence below 50% of the estimated adequacy. To test for statistical differences across the factors of interest in nutrient intakes and adequacies, we used generalized linear models for complex surveys with the log-transformed nutrient and adequacy as independent variable and the Bonferroni method to adjust for multiple comparisons, for the risk of inadequacy differences were established using logistic regression.35,36 The median caloric consumption by age was analyzed comparing rural and urban cases and both non-obese and obese women >18 years old (BMI >30 kg/m2). All statistical calculations were done applying the expansion factors, using SPSS version 10 (SPSS Inc., Chicago IL, USA).36 To adjust for the complex survey design effects, we used the ''svy'' command from STATA Statistical Software, Release 7.0 (Stata Corporation College Station, Texas, USA).37
Results
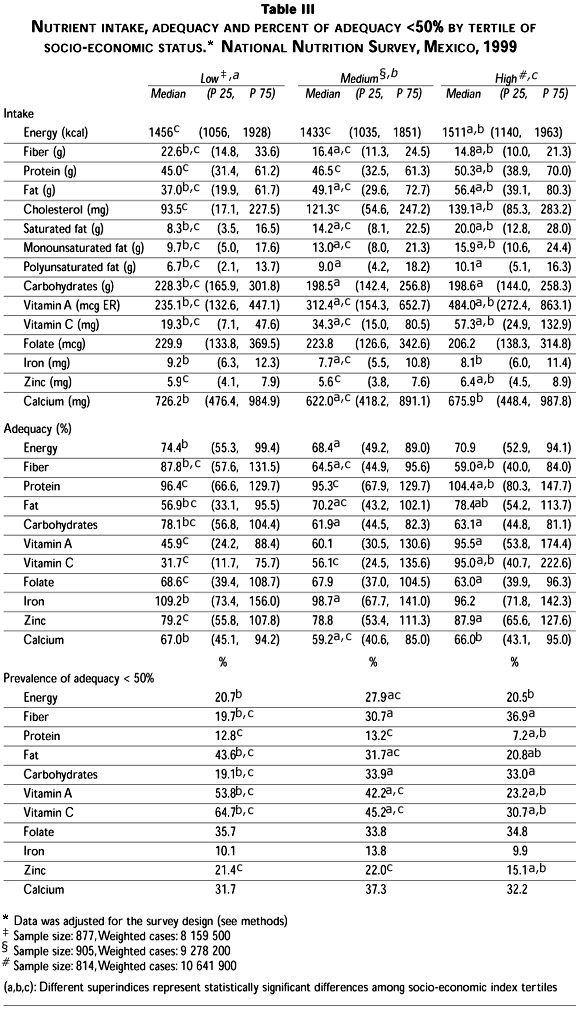
The total valid sample of women (n=2 596) represented 28 080 000 cases at the national level. From this sample, a total of 64.8% cases were between 20 and 39 years of age, 88% were non-pregnant and non-lactating and 75.8% lived in urban areas. Additional characteristics of the population and the diet sub-sample are shown in Table I. Energy and nutrient intake as well as adequacy relative to the DRIs is presented in Table II. Nutrient adequacies for all nutrients were <71% at the national level except for protein (98.9%), iron (101.2%) and zinc (82.8%). The median energy consumption at the national level was 1 471 calories and 23.1% of the women were at risk of energy inadequacy. The higher reported median energy adequacy by region was observed in the South (77.3%) and Center (72%) regions. Energy adequacy by area was slightly higher in rural than in urban and this difference was statistically significant. Fiber consumption at the national level was 17.3g with higher consumption in the South region and in rural areas. The same occurred for carbohydrates, folate, iron and calcium consumption. Fat intake was higher in urban areas and the risk of fat inadequacy was higher in the South and in the rural areas of the country. Protein was the nutrient with the lowest risk of inadequacy at the national level with a prevalence of only 10.8% (Table II). When intake and adequacy were compared by SES, fiber, carbohydrates, folate, iron and calcium consumption were higher in the lowest SES tertile. Energy and the remainder of the analyzed nutrients were higher in the highest SES tertile (Table III).
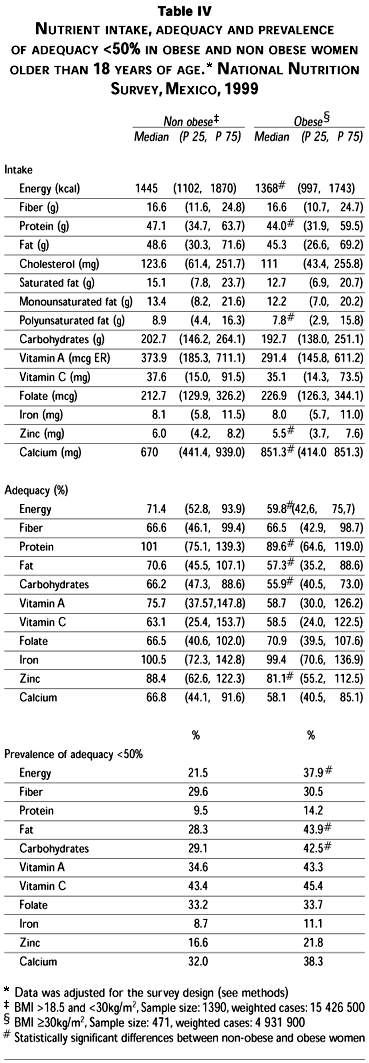
The estimated adequacy of energy and nutrients compared by BMI status (non-obese: <30, or obese: >30 kg/m2) was higher for all macronutrients (total energy, protein, fat and carbohydrates), and zinc in non-obese women. Fiber, vitamin A, C, folate, iron, and calcium intakes showed no significant differences between groups. Reported total, saturated, monounsaturated and polyunsaturated fat intake were higher in non-obese women. However, only polyunsaturated fat was statistically significant. Zinc intake was significantly higher among non-obese women. Calcium intake was significantly higher among obese women (Table IV).
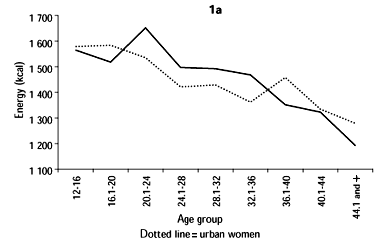
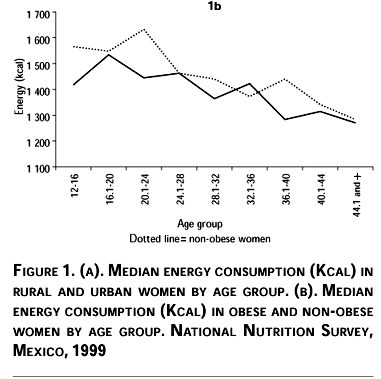
Analyzing reported energy intake by age groups and area, urban women between the ages of 20 and 36 years reported less energy intake; younger and older urban women reported higher intake than women living in rural areas. Obese women reported intakes lower than or similar to non-obese women across most of the age groups (Figures 1a and 1b).
Discussion
The stratification of the data shows interesting patterns related to the epidemiological and nutritional transition: the rural areas, the South region, and the lower Socio-Economic Status (SES) index tertile showed the highest fiber and carbohydrate intake and the lowest saturated fat intake.5,38 Protein adequacy and intake were significantly higher in the South region; with the lowest saturated fat intake reflecting a relevant contribution of beans and cereals to this picture. Women from urban areas and from the higher socioeconomic status tertile had higher protein intakes.
Since the SES index was built using household and family characteristics, the extracted factor could reflect access to certain conditions such as sanitation (water quality and disposal) and information (radio and TV) rather than a precise socio-economic status. Thus, our indicator must be interpreted with caution as a rough estimate. However, a previous analysis showed a significant association between the lowest tertile of a similar index and poor nutritional status indicators.3
The 24-h DR has been recognized as a useful method for quantifying consumption in large surveys since it is inexpensive and relatively easy to apply. Furthermore, it is known to have good compliance.39 Nevertheless, it has been described that some frequently reported foods in the Mexican diet (such as tortillas, sugar and oil) tend to be underestimated.40 In addition, a previous analysis with this information identified an almost twofold under-reporting in obese (36%) vs. non-obese women (20%), controlling for confounders. This underreporting was higher in the North and Mexico City regions compared to the Center and South regions, but without urban-rural differences.41 These results are in the same direction as other recent nutrition surveys in developed and developing countries.42 Therefore, although the median energy intake was below the RDA, an important percentage of energy consumption is not detected with this instrument.
Energy, protein, carbohydrate and lipid intakes reported in this survey were slightly lower than those reported in the First NNS (1988). Energy consumption decreased from a median of 1 586 to 1 470. The only exception was total fat, increasing from 41.2 g to 48.6 g.12 However, these differences must be considered with caution since obesity and overweight have increased substantially from the first to the second national nutrition survey. Thus, a higher under-reporting in the latter could be suspected, partially explaining lower median consumptions and adequacies.1 As other studies have shown, under-reporting of energy intake is associated with bias in estimates of macronutrient intake (low energy intake reporters tend to report a higher percentage of energy from protein and a lower percentage of energy from fat while energy from total carbohydrate is variable).43 In addition, we applied an updated nutrient composition database with more precise information but different from the one used to analyze the previous survey. Therefore, comparisons between both are limited and must be done carefully.
Our data suggest that protein intake quantity in women is adequate; however, an analysis of the protein quality must be done since there must be clear differences among regions. Consumption of nutrients in this descriptive analysis is not adjusted for energy; therefore, adequacies could reflect in some cases a higher net intake rather than better diet quality when comparing factors.44 Fiber consumption had a prevalence of inadequacy of 29.9% at the national level. By region the Center and South (less developed) had a clearly lower risk of inadequacy than the North and Mexico City regions (22.4 and 24.3 vs. 41.6 and 40.5% respectively). This is due mainly to the fiber content of tortillas, beans and other cereals, since fruit and vegetable intake is low, as suggested from the low micronutrient adequacies and consumption (in particular vitamins A, C and folate). Folate and iron consumption were higher in rural areas, lowest socioeconomic index tertile and the South region of the country. This could be explained by the contribution of beans to the diet, an iron and folate-rich food. However, even though beans contain folate and iron, their phytic acid content decreases the absorption and bioavailability, and the cooking process affects folate dramatically. Fortified foods such as corn and wheat flour, the national vitamin A supplementation program and the National Health, Nutrition and Education programs could be contributing to improve the micronutrient intake in marginal areas.45 The impact of these policies is currently under evaluation.
Energy consumption decreased with age, reaching the maximum median consumption approximately at 20 years of age and decreasing steadily. This is consistent with results obtained from the U.S. Nutrition Surveys in the American population.46 Rural women reported higher caloric consumption than urban women from 20 to 36 years of age; this could be explained by a higher energy demand due to higher physical activity and less under-reporting of the 24-h DR questionnaire. Obese women reported less energy consumption than non-obese women across most of the age groups (Figure 1).
Differences within the country among regions, rural and urban areas, and socioeconomic tertiles could indicate that inexpensive calorie-dense foods are becoming more available explaining the higher carbohydrate consumption for marginal groups. On the other hand, cholesterol and saturated and total fat were more frequently consumed by women in the higher SES and urban areas. Micronutrient adequacies were low reflecting a poor consumption of fruits and vegetables throughout the country. These patterns have been associated with increased non-communicable chronic disease morbidity and mortality in a number of studies47-52 and could be associated with the rising prevalence of obesity and other non-communicable chronic diseases currently reported in Mexico.
Acknowledgments
We would like to acknowledge the collaboration of Lourdes Flores-López, MSc in data cleaning, Ivonne Ramírez, BS for assistance in database management, Maribel Porcayo,BS for assistance in compiling the nutrient composition database and Noemí Figueroa, BS for assistance in the computer-generated nutrient vectors.
References
1. González-Cossío T, Rivera J, Shamah T, Barquera S, Hernández B, Sepúlveda J. Obesity in Mexico: A growing national epidemic. Ann Nutr Metabol 2001;45:405. [ Links ]
2. Romieu I, Hernández-Avila M, Rivera JA, Ruel MT, Parra S. Dietary studies in countries experiencing a health transition: Mexico and Central America. Am J Clin Nutr 1997;65:1159s-1165s. [ Links ]
3. Hernández-Díaz S, Peterson K, Dixit S, Hernández B, Parra S, Barquera S et al. Association of maternal short stature with stunting in Mexican children: common genes vs common environment. Eur J Clin Nutr 1999;53:938-945. [ Links ]
4. Hernández B, Peterson K, Sobol A, Rivera J, Sepúlveda J, Lezana MA. Overweight in 12-49 year-old women and children under 5 years of age in Mexico. Salud Publica Mex 1996;38:178-188. [ Links ]
5. Drewnowski A, Popkin BM. The nutrition transition: New trends in the global diet. Nutr Rev 1997;55:31-43. [ Links ]
6. Murphy S, Rose D, Hudes M, Viteri F. Demographic and economic factors associated with dietary quality for adults in the 1987–88 nationwide food consumption survey. J Am Diet Assoc 1992;92: 1352-1357. [ Links ]
7. Zeitlin M, Ghassemi H, Mansour M. Positive deviance in child nutrition with emphasis on psychosocial and behavioural aspects and implications for development. Tokyo: The United Nations University, 1990. Vol. Food and Nutrition Bulletin Supplement 141:153. [ Links ]
8. Loslier L. Ambiocontrol as a primary factor of health. Soc Sci Med 1993;37:735-743. [ Links ]
9. Duhl LJ. Urbanization, poverty, and health. Bull New York Acad Med 1966;42:369-379. [ Links ]
10. Harpham T, Stephens C. Urbanization and health in developing countries. World Health Statistics Quarterly Report Trimestriel de Statistiques Sanitaires Mondiales 1991;44:62-69. [ Links ]
11. Sepúlveda-Amor J, Angel Lezana M, Tapia-Conyer R, Valdespino J, Madrigal H, Kumate J. Nutritional status of pre-school children and women in Mexico: Results of a probabilistic national survey. Gaceta Med Mex 1990;126:207-224. [ Links ]
12. Flores M, Melgar H, Cortés C, Rivera M, Rivera J, Sepúlveda J. Energy and nutrient consumption in Mexican women in reproductive age. Salud Publica Mex 1998;40:161-171. [ Links ]
13. Secretaría de Salud. Programa Nacional de Salud 2001-2006. México DF: SA, 2000:205. [ Links ]
14. Zeitlin MF, Ahmed NU, Beiser AS, Zeitlin JA, Super CM, Guldan GS. Developmental, behavioural, and environmental risk factors for diarrhoea among rural Bangladesh children of less than two years. J Diarrhoeal Dis Res 1995;13:99-105. [ Links ]
15. Barker DJ. Fetal growth and adult disease. Br J Obstet Gynaecol 1992;99:275-276. [ Links ]
16. Barker DJ, Hales CN, Fall CH, Osmond C, Phipps K, Clark PM. Type 2 (non-insulin-dependent) diabetes mellitus, hypertension and hyperlipidaemia (syndrome X): Relation to reduced fetal growth. Diabetologia 1993;36:62-67. [ Links ]
17. Hales CN. Metabolic consequences of intrauterine growth retardation. Acta Paediatr 1997;423(Suppl):184-187. [ Links ]
18. Barker DJ, Osmond C, Simmonds SJ, Wield GA. The relation of small head circumference and thinness at birth to death from cardiovascular disease in adult life. BMJ 1993;306:422-426. [ Links ]
19. Hales CN, Barker DJ. Type 2 (non-insulin-dependent) diabetes mellitus: The thrifty phenotype hypothesis. Diabetologia 1992;35: 595-601. [ Links ]
20. Barker DJ. Maternal nutrition, fetal nutrition, and disease in later life. J Nutr 1997;13:807-813. [ Links ]
21. Resano-Pérez E, Vicencio-Acevedo C, Landeros-Díaz A, Shamah-Levy T, Rivera-Dommarco J. Metodología. En: Rivera-Dommarco J, Shamah-Levy T, Villalpando-Hernández S, González-Cossío T, Hernández-Prado B, Sepúlveda-Amor J, ed. Encuesta Nacional de Nutrición II: Estado nutricio de niños y mujeres en México. Cuernavaca, Morelos: Instituto Nacional de Salud Pública, 2000:21-28. [ Links ]
22. Rivera-Dommarco J, Shamah-Levy T, Villalpando-Hernández S, González-Cossío T, Hernández-Prado B, Sepúlveda-Amor J, ed. Encuesta Nacional de Nutrición II: Estado Nutricio de Niños y Mujeres en México. Cuernavaca, Morelos: Instituto Nacional de Salud Pública, 2000. [ Links ]
23. US Department of Agriculture, Agricultural Research Service. USDA Nutrient Database for Standard Reference, Release 13. Nutrient Data Laboratory, 1999. [ Links ]
24. Food composition database. Davis (CA): University of California-Davis, 1998. [ Links ]
25. Instituto de Nutrición de Centroamérica y Panamá. Tabla de composición de alimentos para uso en América Latina. Guatemala: Panamerican Health Organization-Instituto de Nutrición de Centroamérica y Panama, 1961-98. [ Links ]
26. Morales J, Babinsky V, Bourges H, Camacho M. Tablas de composición de alimentos mexicanos del Instituto Nacional de Ciencias Médicas y Nutrición Salvador Zubirán. Mexico DF.: Instituto Nacional de Nutrición, 1999. [ Links ]
27. Muñoz M, Chávez A, Pérez-Gil F, Roldán JA, Ledesma JA, Hernández-Cordero SL. Tablas de valor nutritivo de los alimentos de mayor consumo en México. Mexico, DF: Editorial Pax, 1996:330. [ Links ]
28. Souci S, Fachmann W, Kraut H. Food composition and nutrition tables. En: Senser HSuF, Ed. Stuttgart: Medpharm Scientific Publications/CRC Press, 2000. [ Links ]
29. Institute of Medicine Dietary reference intakes for: Calcium, phosphorus, magnesium, vitamin D and fluoride. Washington, DC: Institute of Medicine, National Academy Press, 2000:432. [ Links ]
30. Institute of Medicine Dietary reference intakes for: Vitamin C, vitamin E, selenium and carotenoids. Washington, DC: Institute of Medicine, National Academy Press, 2000:506. [ Links ]
31. Institute of Medicine Dietary reference intakes for: Thiamin, riboflavin, niacin, vitamin B6, folate, vitamin B12, panthothenic acid, biotin, and choline. Washington, DC: Institute of Medicine, National Academy Press, 2000:564. [ Links ]
32. Institute of Medicine Dietary reference intakes for: Vitamin A, vitamin K, arsenic, boron, chromium, copper, iodine, iron, manganese, molybdenum, nickel, silicon, vanadium, and zinc. Washington, DC: Institute of Medicine, National Academy Press, 2001:650. [ Links ]
33. Institute of Medicine Dietary reference intakes for energy, carbohydrate, fiber, fat, fatty acids, cholesterol, protein, and amino acids (macronutrients). Washington, DC: Institute of Medicine, National Academy Press, 2002: 207-608. [ Links ]
34. National Research Council. Recommended dietary allowances. Washington, DC: National Academy Press, 1989. [ Links ]
35. Millns H, Woodward M, Bolton-Smith C. Is it necessary to transform nutrient variables prior to statistical analyses? Am J Epidemiol 1995;141:251-262. [ Links ]
36. SPSS for Windows. Release 10.0. Chicago (IL): SPSS Inc., 1999. [ Links ]
37. Stata Corp. Stata Reference Manual Release 7. Texas: Stata Press, 2001;Vol. 1-4. [ Links ]
38. Popkin BM. The nutrition transition in low-income countries: An emerging crisis. Nutr Rev 1994;52:285-298. [ Links ]
39. Gibson R. Principles of nutritional assessment. Nueva York (NY): Oxford University Press, 1990:691. [ Links ]
40. Madrigal H, Martínez H. Manual de encuestas de dieta. Cuernavaca, Morelos: Instituto Nacional de Salud Pública, 1996;Perspectiva en Salud Pública 23. [ Links ]
41. Campirano F, Barquera S, Rivera J, Hernández-Prado B, Flores M, Monterrubio E. Estimation of energy under-reporting in obese and non-obese Mexican women using different equations: Analysis of the Mexican Nutrition Survey. Ann Nutr Metabol 2001;45:146. [ Links ]
42. Briefel R, Sempos C, McDowell M, Chien S, Alaimo K. Dietary methods research in the third National Health and Nutrition Examination Surveys: Underreporting of energy intake. Ame J Clin Nutr 1997;65:1203S-1209S. [ Links ]
43. Livingstone B Black A. Markers of the validity of reported energy intake. J Nutr 2003 Mar; 133 (Suppl 3):895S-920S. [ Links ]
44. Willett W. Implications of total energy intake for epidemiologic analyses. Nutritional Epidemiology. Nueva York (NY): Oxford University Press, 1990:396. [ Links ]
45. Barquera S, Rivera J, Gasca-García A. Políticas y programas de alimentación y nutrición en México [Food and nutrition policy and programs in Mexico]. Salud Publica Mex 2001;43:1-14. [ Links ]
46. Bray G. Etiology and pathogenesis of obesity. Clin Cornerstone 1999;2:1-15. [ Links ]
47. Hu FB, Manson JE, Stampfer MJ, Colditz G, Liu S, Solomon CG et al. Diet, lifestyle, and the risk of type 2 diabetes mellitus in women. N Engl J Med 2001;345:790-797. [ Links ]
48. Hu FB, Willett WC. Diet and coronary heart disease: Findings from the Nurses' Health Study and Health Professionals' Follow-up Study. J Nutr Health Aging 2001;5:132-138. [ Links ]
49. Liu S, Manson JE, Lee IM, Cole SR, Hennekens CH, Willett WC et al. Fruit and vegetable intake and risk of cardiovascular disease: The Women's Health Study. Am J Clin Nutr 2000;72:922-928. [ Links ]
50. Liu S, Buring JE, Sesso HD, Rimm EB, Willett WC, Manson JE. A prospective study of dietary fiber intake and risk of cardiovascular disease among women. J Am Coll Cardiol 2002;39:49-56. [ Links ]
51. Fung TT, Willett WC, Stampfer MJ, Manson JE, Hu FB. Dietary patterns and the risk of coronary heart disease in women. Arch Intern Med 2001;161:1857-1862. [ Links ]
52. Tucker K, Selhub J, Wilson P, Rosenberg I. Dietary intake pattern relates to plasma folate and homocysteine concentrations in the Framingham Heart Study. J Nutr 1996;126:3025-3031. [ Links ]
Address reprint requests to
Dr. Simón Barquera
Centro de Investigación en Nutrición y Salud, Instituto Nacional de Salud Pública
Avenida Universidad 655
colonia Santa María Ahuacatitlán
62508 Cuernavaca, Morelos, México
E-mail: sbarquera@insp.mx
Received on: August 20, 2002
Acepted on: September 22, 2003

