


 nueva página del texto (beta)
 Inglés (pdf)
 Artículo en XML
 Referencias del artículo
 Enviar artículo por email
 Citado por SciELO
  Similares en
SciELO
Similares en
SciELO 
 Permalink
1. Introduction
A glow discharge is characterized by the presence of distinct regions between the cathode and anode (Aston’s dark space, Crooke’s dark space, Faraday’s dark space, the positive column, and the anode dark and luminescent space) placed within a vacuum chamber. The physical characteristics of the discharge depend on various parameters (pressure, distance between the electrodes, and gas) that, depending on the application, become variables that can be modified1,2. Paschen’s curves describe the relationship between the electric breakdown voltage (VB) and product between the pressure (p) and distance (d) of the electrodes gap, i.e., VB = ƒ(pd). Experimentally, it is possible to modify the parameters of distance and pressure3. The characteristic curve that is plotted by taking (pd) along the x axis and VB along the y axis is called the Paschen curve4. As a potential difference is applied, the electric field between the electrodes accelerates any existing free charge, free electrons are present in the system due to the different mechanisms of interaction between species that are in the atmosphere of the mixture. When an electron interacts with an electric field increases its energy, this can result in ionization and creation of a new electron and free ion, due to the inelastic collisions generated. The new free electron can repeat the process and create a chain reaction, and this represents Townsend’s first ionization coefficient (α), which indicates the ionization per unit length5,6. Additionally, when the ion is accelerated toward the cathode and hits it, there is a possibility that it will release an electron, this process is called secondary emission and is given by the second Townsend coefficient (γ), being responsible for the production of electrons that can sustain the discharge . The coefficient (γ) describes the number of electrons generated from the cathode per incident particle. Based on Touwnsend’s criterion,
or
where α and γ are Townsend’s first and second coefficients respectively, A is the saturation ionization in the gas, and B is a constant related to the excitation and ionization energies. Both are gas-dependent constants for an E/p ratio, where E indicates the intensity of electric field8.
By relating (1) and (2) we can rewrite
The final form of Paschen’s law can be written according to (4):
The electrical breakdown voltage is simplified by expressing it as
Also, in Paschen’s law the electric breakdown voltage is a function of the d/r ratio, where r is the radius of the electrode9. The expression is written as
It has been experimentally10 shown that the breakdown voltage depends not only on the product between the pressure and the distance of the electrodes, but also on the quotient between the separation distance of the electrodes and their radius. For this experiment, the dependence of d/r is studied and circular copper electrodes with radii of 2.5, 2.0 and 1.5 cm are used.
2. Experimental Setup
The experimental system (Fig. 1) consists of a cylindrical aluminum vacuum chamber with three outputs, two of these correspond to the electrical feedthroughs, and the third corresponds to the Langmuir probe. The electrical crossings are made up of three parts: a spark plug, a cylindrical steel bar, and circular copper electrodes with diameters of 5.0, 4.0, and 3.0 cm. In this experiment, the separation between the electrodes was varying, from 0.5 to 2.5 cm with intervals of 0.5 cm.
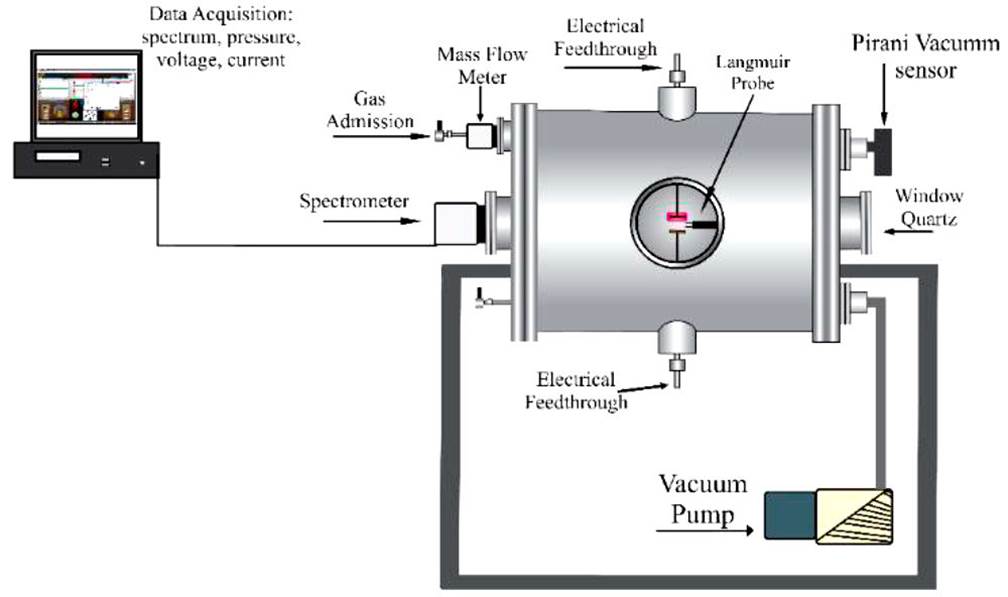
The electrical and optical properties of the discharge are determined by the nature of the gas (CH3CH2H and CH3OH) and by the electrode’s geometry and electrodes material, circular and copper respectively. The presence of small traces of impurity in the electrical discharge can create large defects in ionization, and it is therefore necessary to ensure the high purity of the atmosphere, in this context, a previous vacuum of the order is generated 10-3 Torr; this is achieved with the vacuum produced by the VARIAN DS302 pump in the chamber where the discharge takes place and then is filled with high purity gas at the work pressure (0.07, 0.08, 0.09, 0.10, 0.20, 0.30, 0.40, 0.50, 0.60, 0.70, 0.80, 0.90, 1.00, 2.00, 3.00, 4.00, and 5.00 Torr). The ethanol and methanol are introduced by a flowmeter (MATHESON TRI-GAS) with 3 psig of constant flux; the pressure of the atmosphere (1.0 Torr) of ethyl alcohol in the tube was measured with a vacuum SenTorr (VARIAN VACUUM GAUGE Type 0536).
A glow discharge was generated between the two electrodes at different pressures. The high voltage power supply used was Spellman SA4. The plasma optical emission spectra were obtained using an Ocean Optics FLAME-T-UV-vis spectrometer with a resolution of 0.1-10 nm and an optical fiber with an efficiency of 90% in the visible spectrum. Optical emission spectroscopy values were obtained in a range of 200-900 nm. Subsequent analysis of the plasma spectra was conduct regarding the National Institute of Standards and Technology (NIST) database.
To obtain the measurements of the breaking voltage, a profile was established for the different pressures, and these were maintained. Subsequently, the voltage increased until an electrical disruption was generated between the electrodes. Measurements were taken in the pressure range adjusted to the profile to obtain the Paschen curve, and this was to determine the lowest breakpoint.
3. Results
3.1. Paschen’s Law Ethanol
The behavior of the graphs obtained experimentally for an ethanol (CH3CH2H) glow discharge is congruent with a Paschen curve and its ratio (pd - V)11-16. The ionization generated in the reaction chamber occurs when the electric field between the copper electrodes became sufficiently intense to accelerate the electrons at velocity that allowed the ionization of the ethanol molecules. The ions that were also accelerated in this field released new electrons from the copper electrodes through elastic collisions, and the breakdown occurred when this process became sustainable. From these data, the Paschen curve for ethanol (CH3CH2H) was constructed, as shown Fig. 2.

When the pd parameters increased beyond the curve’s minimum, the collisions may have been too frequent. In this regime, an electron on its way to the anode may collide with molecules of gas phase so often that a higher input voltage is required to accumulate enough energy to ionize a neutral atom. Therefore, the behavior of the Paschen curve was observed when the pd increased. The uncertainty corresponded to the error propagation of coefficient γ according to Eq. (1) of Paschen’s model and to that obtained with the voltage reading of the multimeter Δ. The minimum breakdown voltage in an ethanol (CH3CH2OH) discharge at different pressures occurs as shown in the Table I.
Table I Minimum breakdown voltage parameters in the Paschen curves.
| Minimum breakdown voltage (kv) | Pressure (Torr) | gap (cm) |
|---|---|---|
| 0.51 | 1.0 | 0.5 |
| 0.44 | 0.9 | 1.0 |
| 0.46 | 1.53 | 1.5 |
| 0.47 | 0.8 | 2.0 |
| 0.47 | 1.0 | 2.5 |
The fitting was made according to Paschen’s model, with the function of Eq. (4) and C = ln(A/ln(1+[1/(])) obtaining the following fitting coefficients, R2, for ethanol.
The fitting was made according to Paschen’s model, with the function of Eq. (4) and C = ln(A/ln(1+[1/(])) which indicates the processes in which electrons are released from the cathode due to first and second species collisions and photoelectric effect, which are referred to the gamma constant, obtaining the following coefficients C and fitting coefficients, R2, for ethanol.
Table II also shows the values obtained from the ratio d/r, where r is the radius of the electrode in the variation of Paschen’s law. The curves show a behavior already known in these types of discharges for which Paschen’s law states that the gas-related dielectric breakdown voltage depends only on the pd value.
Table II Fitting and d=r coefficients for ethanol (CH3CH2OH).
| d (cm) | d/r | Ethanol (R2) | C | B (V/am-torr) |
|---|---|---|---|---|
| 0.5 | 0.2 | 0.99878 | 6.72 | 310.65 |
| 1.0 | 0.4 | 0.99547 | 2.81 | 411.12 |
| 1.5 | 0.6 | 0.98687 | 5.88 | 665.16 |
| 2.0 | 0.8 | 0.99584 | 4.05 | 686.78 |
| 2.5 | 1.0 | 0.99654 | 4.95 | 838.21 |
However, the results obtained indicate that for the same pd value, the breakdown voltages are different for each of the Paschen curves, which, in turn, correspond to different values of d/r, and this was due to the difference in the distribution of the electric field and the mean free path. This dictates the probability of collision of the electrons with the ethanol atoms, in which case, depending on whether the breakdown voltage is higher or lower, this changes.
3.2. Paschen’s law of methanol
By generating a pressure difference in the reaction chamber, a certain density of gas particles will begin to ionize when the voltage applied between the electrodes is greater than or equal to the breakdown voltage. For this to occur, there must be a free electron or some free electrons that induce ionization by interacting with the neutral particles present between the circular copper electrodes, and these electrons produce an amplification in the concentration of the ions and electrons in the gas.
The different methanol (CH3OH) Paschen curves were obtained by varying the distance between the electrodes for the pressures (0.07, 0.08, 0.09, 0.10, 0.20, 0.30, 0.40, 0.50, 0.60, 0.70, 0.80, 0.90, 1.00, 2.00, 3.00, 4.00, and 5.00 Torr) and they are shown from Figs. 3a) to 3b) In all curves, a decreasing behavior of the voltage as a function of the product is shown between the distance and pressure until the minimum is reached. After this, the voltage increases. The uncertainty corresponds to the error propagation of coefficient γ according to Eq. (1) of Paschen’s model and to that obtained with the reading of the multimeter ΔV.
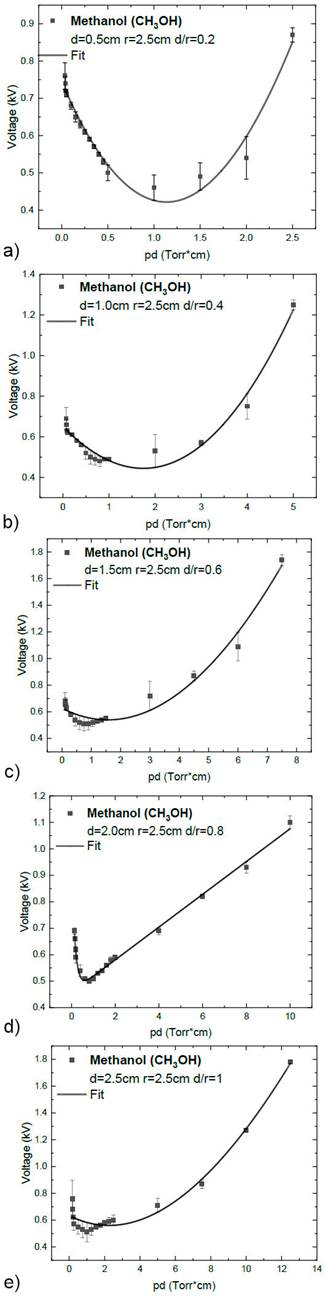
Figure 3 Paschen curve of methanol (CH3OH) at a 2a: d=0.5, 2b: d=1.0, 2c: 1.5, 2d: 2.0 and 2e: 2.5 cm.
The minimum breakdown voltages in the methanol (CH3OH) discharges at different pressures are shown in Table III.
Table III Minimum breakdown voltage parameters in the Paschen curves.
| Minimum breakdown voltage (kv) | Pressure (Torr) | gap (cm) |
|---|---|---|
| 0.46 | 1.0 | 0.5 |
| 0.48 | 0.8 | 1.0 |
| 0.51 | 0.75 | 1.5 |
| 0.50 | 0.8 | 2.0 |
| 0.51 | 1.0 | 2.5 |
In Table IV, the fit according to the Paschen model can be seen with the function of Equation (4) and C = ln(A/ln[1+[1/(]) for methanol (CH3OH).
Analysis of these values allows better understanding of the discharge in a methanol atmosphere. For regions where the minimum pressure is low and the mean free path is large, the probability of electron collision with methanol atoms is lower, and a higher voltage is required for ionization. In regions where the pressure is high and, therefore, the mean free path is small, there will be a higher incidence of collision between the electrons and atoms.
3.3 Paschen’s Law of Ethanol-methanol mixture
The Paschen curves were obtained from the 50% ethanol-methanol mixture in which the distance between the electrodes was varied (0.5-2.5 cm) (Figs. 4 to 4) In all curves, a decreasing behavior of the voltage as a function of the product between the distance and pressure is shown until the minimum is reached. This is followed by an increase, which, as mentioned before, is a characteristic of glow discharges at low pressures. The uncertainty corresponds to the error propagation of coefficient γ according to (1) of Paschen’s model and to that obtained with the voltage reading of the multimeter ΔV.

Figure 4 Paschen curve of the mixture at 50 % at a 2a: d=0.5, 2b: d=1.0, 2c: 1.5, 2d: 2.0 and 2e: 2.5 cm.
Table V illustrates the fitting, according to the Paschen model, with the function of Eq. (4 and C = ln(A/ln[1+[1/(]) for the mixture (50% CH3CH2OH-50 % CH3OH).
Table V Fitting and d/r coefficients for ethanol (CH3CH2OH) and methanol (CH3OH).
| d (cm) | d/r | Ethanol (R2) | C | B (V/am-torr) |
|---|---|---|---|---|
| 0.5 | 0.2 | 0.99291 | 5.26 | 563.56 |
| 1.0 | 0.4 | 0.99423 | 6.23 | 596.32 |
| 1.5 | 0.6 | 0.98999 | 8.91 | 621.89. |
| 2.0 | 0.8 | 0.99186 | 4.27 | 891.46 |
| 2.5 | 1.0 | 0.98569 | 5.62 | 1132.58 |
The minimum breakdown voltage at the 50 % ethanol-methanol mixture discharge at different pressures is displays in Table VI.
Table VI Minimum breakdown voltage parameters in the Paschen curves.
| Minimum breakdown voltage (kv) | Pressure (Torr) | gap (cm) |
|---|---|---|
| 0.48 | 1.0 | 0.5 |
| 0.41 | 0.8 | 1.0 |
| 0.43 | 0.75 | 1.5 |
| 0.44 | 0.8 | 2.0 |
| 0.50 | 1.0 | 2.5 |
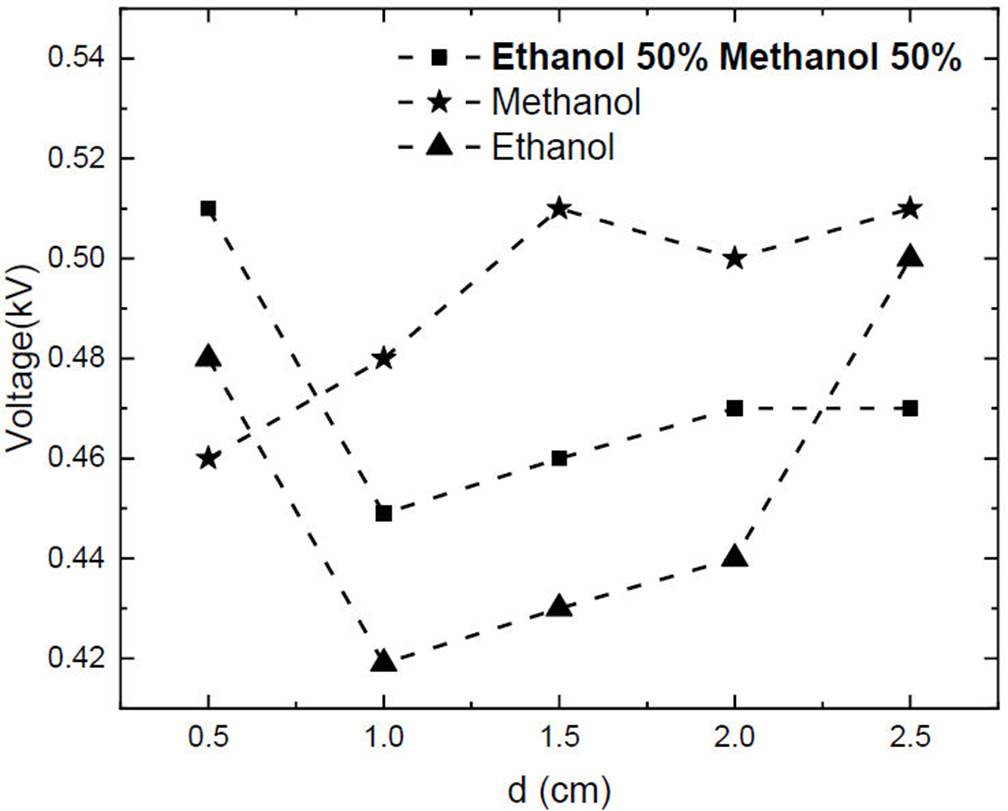
Usually, the function of the breakdown voltage is a smooth curve with a minimum as shown in Figs. 2 and 3 The behavior of these graphs allows the appreciation of the minimum voltage from which the breakdown of a gas (ethanol, methanol, and a 50% mixture) can occur under electric fields (produced in this experiment using an external voltage source and circular copper electrodes). Figure 5 shows the minimums obtained during ethanol, methanol, and the 50 % mixture discharges at different distances (0.5-2.5 cm), the behavior of ethanol and the 50 % mixture of ethanol and methanol are similar between 0.5 to 2.0 electrodes gap, showing a minimum breakdown voltage a 1.0 cm of electrodes gap. While the behavior of methanol displays an increasing trend. The similarity of the ethanol and mixture could be due to same tendency of the first and second Townsend coefficients, which can be seen from the B and C values. So, it can infer that the behavior of the mixture is mainly influenced by ethanol.
3.4. Modification to Paschen’s Law of Ethanol
The effect of the electrode separation length (d) and electrode radius (r) on the dielectric breakdown voltage is analyzed in the following Paschen curves. These curves are obtained experimentally for a luminescent discharge of ethanol, methanol, and a 50 %mixture of both at five different separation distances between the electrodes (0.5-2.5 cm) and three different radii (1.5, 2.0, and 2.5 cm). The Paschen curves and different d/r values corresponding to each curve are shown from Figs. 6a to 6e.
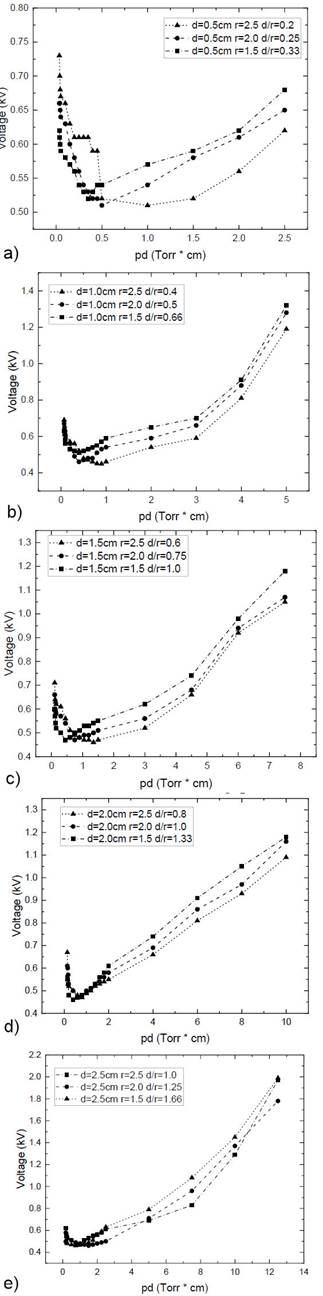
Figure 6 Paschen curves of CH3OH at r = 1.5, 2.0, and 2.5 cm and a 2a: d=0.5, 2b: d=1.0, 2c: 1.5, 2d: 2.0 and 2e: 2.5 cm
Each of the above graphs exhibits the same behavior of the Paschen curve made with a copper electrode of 2.5 cm radius in an ethanol-ionized atmosphere. These curves show intersections at different pressures due to the length of the average free path of the electrons and the first ionization coefficient α. This is an exponential function of the electric field produced by the difference of the potential between the electrodes since it represents the number of free electrons that is capable of producing an electron per unit of average free path length in the direction of the applied electric field. Together, these curves cause the intersection between the graphs with different radii (1.5, 2.0, and 2.5 cm).
3.5. Modification to Paschen’s Law of Methanol
The Paschen curves and different d/r values corresponding to a methanol light discharge at five different electrode distances (0.5-2.5 cm) and three different radii (1.5, 2.0, and 2.5 cm) are shown from Figs. 7a) to 7e).

Figure 7 Paschen curves of CH3OH at r = 1.5, 2.0, and 2.5 cm and a 2a: d=0.5, 2b: d=1.0, 2c: 1.5, 2d: 2.0 and 2e: 2.5 cm
The behavior of the graphs allows the visualization of the minimum dielectric strength at the lowest pressures so that the number of collisions of the electron atoms and methanol is minimal. Therefore, only a limited number of ions are produced because of the inelastic collisions resulting from α processes.
3.6. Modification of the Paschen curves with 50 % ethanol- 50 % methanol
The Paschen curves corresponding to the modification of the Paschen law are made experimentally using a luminescent discharge of the 50 % ethanol-methanol mixture at five different separation distances between the electrodes (0.5-2.5 cm) and three different radii (1.5, 2.0, and 2.5 cm) are display form Figs. 8a) to 8e), respectively.

Figure 8 Paschen curves of CH3OH 50 % and CH3CH2OH 50 % at r = 1.5, 2.0, and 2.5 cm and a 2a: d=0.5, 2b: d=1.0, 2c: 1.5, 2d: 2.0 and 2e: 2.5 cm
Paschen’s law without the modification dictates that the dielectric breakdown voltage in our reaction chamber depends only on the value of the pressure (p) multiplied by the distance (d). However, in the graphs shown above, it is evident that for the same pd value, the breakdown voltages are different for the different Paschen curves that correspond to different d/r values. Therefore, these curves clearly illustrate the deviations from Paschen’s law.
The analysis of the behavior of these graphs allows the visualization of each region. On the left-hand side, there is not much difference in the breaking voltages for each of the three curves made experimentally, but on the right-hand side, the breakdown voltage presents a greater degree of variation. When the electrode radius is small (1.5 cm), all the ions cannot interact with the cathode to produce secondary electrons that result from 𝛾 processes, and the corresponding breakdown voltages are larger. When the electrode radius is large, the area of the uniform electric field is also large and is directly proportional to its increase and the loss of ions will be less. This explains the decrease in breakdown voltages for low d/r values, as shown in the graphs above. In Fig. 8a) the curve at r = 2.5 cm and d/r = 0.2 does not follow the trend of the other two cases at low pd values, that may be due to the low ratio of distance and radius of the electrodes, which produces an intense electric field affecting the first and second Townsend coefficients and the breakdown voltage.
3.7. Optical emission spectroscopy
To characterize the glow discharge, the optical emission spectrum was obtained (Fig. 9), and the main lines and bands present in each case were identified. The spectra were obtained (200 and 900 nm) of the discharges are presented for Ethanol (CH3CH2OH) and Methanol (CH3OH) and the mixture of both respectively at 50 %. According to the assignment, the ethanol plasma spectra are characterized by bands and lines due to the species CHO (357.01 nm, 367.898 nm, 379.78 nm), O2 (391.01 nm), CO (411.70 nm, 450.02 nm, 457.95 nm, 482.62 nm, 519.82 nm, 606.99 nm), CH (430.40 nm), OH (433.89 nm), CO2 (464.44 nm, 468.89 nm), Hβ (485.844 nm), H2 (493.07 nm), O+2 (559.87 nm) and Hα (656.22 nm), where species obtained as a result of some processes among which dissociation stands out (R1 - R3).

Figure 9 Optical emission spectra of a discharge of Ethanol, Methanol and a mixture of both at 50 %.
Methanol plasma spectra are characterized by bands and lines due to CH (488.90 nm), CO (Angstrom s. B1Σ-A1Π), Hβ, and Hα species (R4 - R6).
In the present experiment, the line or band with the highest intensity observed by OES measurement was the species Hα. The presence of C2 and CH species in ethanol discharge can be taken as an indication of the formation of solid carbon and hydrocarbons since these species are typically found as intermediate radicals in the formation mechanism of these products.
4. Conclusions
Paschen’s curves for the glow discharges of ethanol, methanol, and a 50 % mixture of both were obtained experimentally using the dependence that existed between the dielectric breakdown voltage and function between the pressure product and the separation distance between the electrodes, as established by Paschen’s law. The graphs obtained experimentally showed the expected behavior of the Paschen curves for each of the alcohols, experimentally obtaining the constants B and C associated to α and γ. Additionally, the d/r coefficient was obtained through the variation of Paschen’s law, considering the electrode radius (2.5 cm) that gives a linear behavior. The experimental results showed that the breakdown voltages for the gas discharge also depended on the d/r values, in addition to the pd values. Conventional Paschen’s law predicts that the gas breakdown voltage depends only on the pd value, but in the graphs obtained with the modification of the radii of the electrodes, it is clear that for the same pd value, the breakdown voltages are different for the different Paschen curves that correspond to different d/r values. To corroborate these results, the same experiment was performed for each of the alcohols using electrodes with three different radii (1.5, 2.0, and 2.5 cm). In these experiments, the electrode separation was kept constant. The Paschen curves obtained show that in the right zone of (pd), the breakdown voltage is high for the Paschen curves that correspond to a large d/r value. It can also be seen that when the radius of the electrode is small (1.5 cm), none of the ions can interact with the cathode to produce secondary electrons, and the corresponding breakdown voltages are higher. When the electrode radius is large (2.5 cm), the electric field area is also large, and the ion loss is less. This explains the decrease in breakdown voltages for low d/r values, as shown in the graphs in the Paschen’s law modification section. The OES obtained show the different species that occur during the discharge, highlighting CO (389.32 and 561.02 nm), H2 (468.38 and 603.19 nm), Hβ (468.38 nm), and Hα (656.27 nm), along with some smaller bands due to the species CH (430.40 nm) and C2 (516.52 nm).

