


 nova página do texto(beta)
 Inglês (pdf)
 Artigo em XML
 Referências do artigo
 Enviar este artigo por email
 Citado por SciELO
  Similares em
SciELO
Similares em
SciELO 
 Permalink
1. Introduction
The world is facing significant environmental challenges such as improving the quality of water. Several efforts are currently focusing on detecting pollutants and treating them using photocatalytic processes to stop further pollution. For several applications one must develop precise techniques for detecting trace amounts in low samples’ volumes, existing a lack of simple, cheap, reliable, and sensitive techniques for measuring minimal optical absorbance in liquids in small spaces. Because conventional spectroscopies measure transmitted light through a sample, they fail when treating highly transparent samples since both transmitted and incident energy are almost the same. Photothermal techniques overcome this limitation because they are based on measuring the fraction of the incoming energy that is absorbed and transformed into heat via non-radiative processes, representing an alternative in this field [1]. One of these techniques is the thermal lens spectroscopy (TLS) [2,3]. In this method, a refractive index periodical change is produced by the absorption of an intensity modulated laser beam (called the excitation beam), which induces a phase shift in another laser beam (the probe) passing through the same heated region of the sample. The consequent intensity changes in the probe beam are measured by a photodiode and provide the thermal lens signal. Among other applications, TLS has been widely used for sensitive detection of a wide class of species dissolved in dissimilar media [1-9] and for the study of different photodegradation processes [4,5]. When the excitation beam is highly focused onto a micrometric region of the sample the technique is called thermal lens microscopy (TLM), with the main advantage that very low amounts of samples can be characterized [6]. Recently, a variant of TLM has been proposed that uses coaxial counter propagating excitation and probe beams and a passive optical resonator to enhance sensitivity and reduce limits of detection (LOD). For example, LODs at the parts per trillion level have been achieved for Fe-II [7] and Cr-VI [8] in water and, recently, its application to monitor the kinetics of the photocatalytic reduction of Cr-VI was demonstrated using TiO2:Fe thin films [9]and CdS powder [4] as photocatalyst materials. However, none of the mentioned papers provided any comparison between the kinetic observed using TLM and by means of any other analytic technique, to show the expected agreement between the results they offer. Therefore, it is the goal of the present paper to provide a comparison between TLM and the often-used UV-Vis optical transmission spectroscopy technique (we will be name it here OT, for short) for the photocatalytic reduction of methylene blue dissolved in water, of course in a dye concentration range in which both techniques are functional. To do this, an optical transmittance (OT) measurement at the excitation laser wavelength was incorporated in the same TLM set-up after properly calibration using a commercial spectrometer. The catalyst used was a ZnO thin film deposited on a glass substrate by the spray-pyrolysis technique and the photocatalytic reaction was induced by UV-violet light, taking care to avoid photobleaching of this molecule due to light absorption [5]. We resorted to the use of a ZnO film because it is a semiconductor that has been proposed as an alternative photocatalyst due to its lower cost, thermal stability [10], narrower bandgap [11] and higher photo-efficiency [12-15] when compared with other materials such as the widely used anatase TiO2. Moreover, it does not further contaminate the solvent at the end of the photocatalytic reaction, as can happen when powdered compounds are used.
2. Experimental details
2.1. The catalyst
ZnO thin films were synthetized using the spray pyrolysis technique. They were deposited on Corningr glass substrates (1.8 mm thick) using as precursor a solution of zinc acetate dehydrated (Zn(CH3COO)2 2H2O) with 0.1 molar concentration diluted in deionized water. The glass substrate, maintained at 400◦C, was coated placing it in front of the mist under a constant flow of nitrogen (7 mL·min−1) for 15 minutes. The thickness (984 nm) of the resultant thin film was determined using a Dektak 3 surface profilometer (Veeco). Scanning electron microscopy (SEM) images demonstrated a uniform and compact granular surface with a morphology less ordered than common rods, plates and flowers favoring light absorption due to the high surface area, and the generation of electron-hole pairs. Energy dispersive Xray spectroscopy (XEDS) measurements made in combination with SEM and X-ray diffraction (XRD) have shown the formation of wurtzite, the most thermally stable morphology of ZnO. More details on sample’s characterization by these techniques are given in a recent published paper [16]. The bandgap energy value, E g , of the ZnO film was calculated from optical reflectance spectra (measured with an Ocean optics, Flame-T-UV-VIS-ES spectrometer) using the Tauc graph for direct band-gap semiconductors [4], i.e., the graph of (αhν)2 as a function of hν, where α and hν are the optical absorption coefficient and the photons energy, respectively (Fig. 1). The value of E g = 3.19 eV was determined by extrapolation of the linear part of this plot.
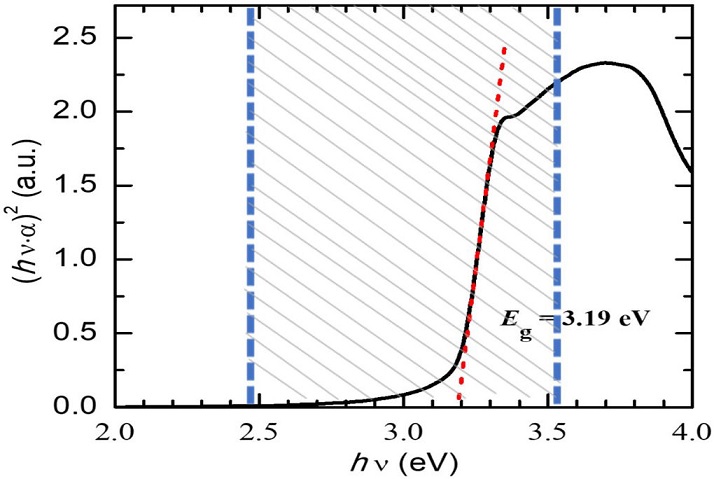
FIGURE 1 Tauc plot used for bandgap energy determination. The dashed region shows the light energy range of the lamp incident onto the photocatalyst. The value of E g = 3.19 eV was determined by extrapolation of the linear part of this plot, as shown by the red line (color only in the online version).
2.2 The TLM method
Figure 2a shows a schema of the TLM experimental set-up. It is described with more detail elsewhere [9]. Here a modification is made to incorporate the OT measurement in the same set-up. Briefly, the set-up consists of the following.
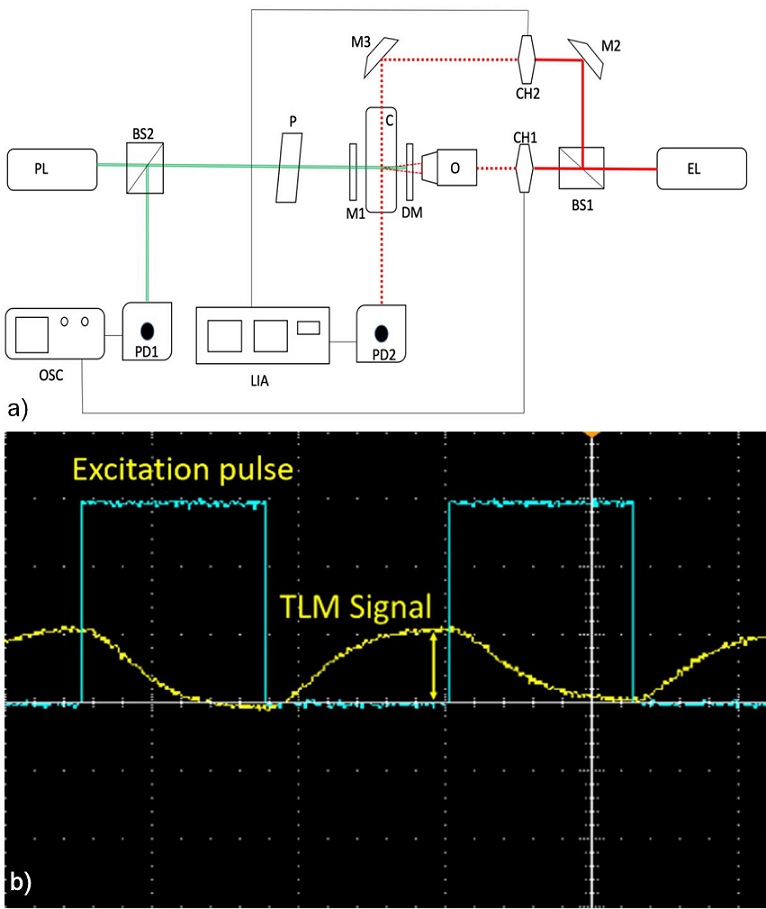
FIGURE 2 a) Schema of the experimental set-up. EL: Excitation laser. PL: Probe laser. CH1, CH2: Mechanical Modulators (Choppers). O: Objective (focusing) lens. DM: Dichroic mirror. M1, M2, M3: Mirrors. BS1, BS2: Beam splitters. P: Polarizer. PD1, PD2: Photodiodes. OSC: Oscilloscope. LIA: Lock-in Amplifier. C: Quartz cuvette containing the sample. (color only in on-line version). b) Typical oscilloscope snapshot of the probe and excitation beams intensities (yellow and blue curve, respectively) as a function of time (abscissa axis). The arrow shows what is defined here as the TLM signal (color only in the online version).
The sample is enclosed in a 10 mm thick quartz cuvette, C (Hellma Z803111-1EA). The excitation laser EL (COHERENT-OBIS 640, wavelength λ
e
= 640 nm, power P
e
= 8 mW) beam (red in the on-line color version) is divided by a beam splitter (BS1). One part of the beam is used for OT measurement. The beam’s intensity is periodically modulated at 50% duty-cycle by a chopper CH2 (THORLABS MC2000) at a frequency f = 30 Hz (this is an arbitrarily chosen value) and propagates through a sample region located far-away of the TL region, being partially transmitted. The incident and the transmitted beam intensities are measured with a photodiode PD2 (THORLABS-DET36A/M) whose output is connected to a lock-in amplifier (LIA) (SR830) synchronized at the modulation frequency (for measuring the incident beam intensity, the detector PD2 is placed in front of the sample). From the OT measurement, the sample’s absorbance is calculated as usual as A = log10(I
i
/I
T
), where I
i
is the intensity of the light impinging on the sample and I
T
is the transmitted intensity. Undesirable excess heating of the sample is avoided due to the very low intensity of the laser beam. Obtained absorbance values for test samples are compared with those measured by a commercial UV-Vis spectrophotometer (OCEAN OPTICS-FLAMET-UV-VIS-ES) showing a good agreement. The other part of the excitation laser beam is focused onto a small region of the sample using a microscope objective (O). It is used to excite the TL signal after being modulated in intensity by a mechanical chopper CH1 (THORLABS MC2000) at a frequency f = 1 Hz. This value was selected so that the 1second-long time duration of each excitation cycle becomes much greater than the characteristic time for the formation of the TL signal, which under the conditions of this experiment is about 0.7 ms. It was calculated as
2.3. Methodology
Both the TLM and the OT techniques are used to measure the concentration of the analyte of interest by comparing the sample to a known reference standard. For this, several samples of known concentrations of methylene blue in water were prepared, and standard calibration curves were constructed. For OT, the calibration curve will be the absorbance as a function of concentration, while for TLM the signal will be plotted as a function of concentration. The concentration of an unknown sample can then be obtained by interpolation using these curves. In this way, the curves of concentration as a function of the time measured from the beginning of a photocatalytic process can be measured using both detection methods and can be compared with each other.
3. Results and discussion
3.1. Samples
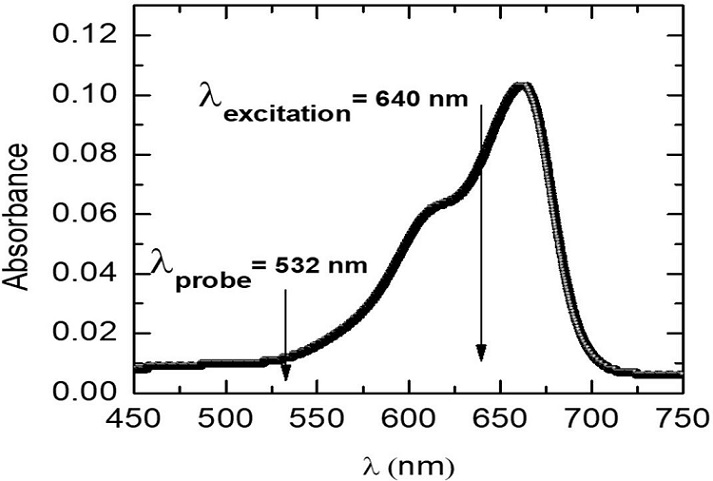
A series of calibration samples was prepared using analyticalreagent grade methylene blue (MB, Hycel de México, S.A. DE C.V) and deionized water. Optical spectrophotometric measurements showed a broad absorption band centered near 650 nm for the obtained solutions as shown in Fig. 3 for a sample of 0.46 ppm w (0.46 mg/L) of MB in water, so that a laser (λ e = 640 nm) emitting very near this wavelength was chosen for excitation. The probe laser wavelength (532 nm) was selected so that it is within the very low absorption region.
3.2. Calibration curves
Figures 4a) and b) show the obtained calibration curves, i.e., the TLM signal and the absorbance determined by OT measurement at the excitation laser wavelength, respectively, as a function of the methylene blue concentration.
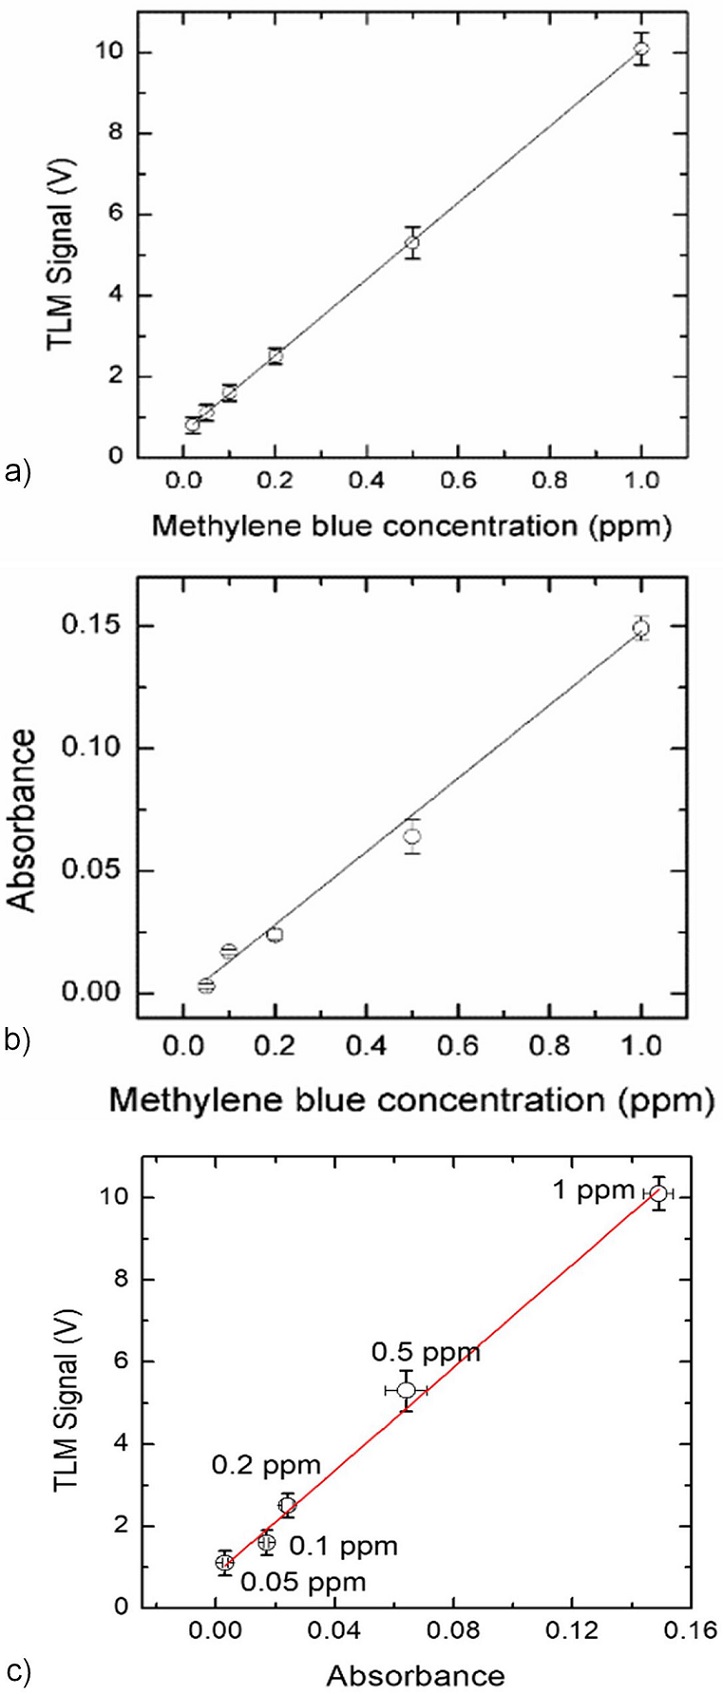
FIGURE 4 TLM signal amplitude a) and optical absorbance obtained from OT measurements b) as a function of the methylene blue concentration in water. Each point represents the mean value of ten independent measurements and the Lock-in amplifier acquisition was programmed so that each lecture was repeated 100 times before an average value was recorded. The mean relative standard deviations were 5 and 7% for TLM and OT, respectively. c) TLM signal versus absorbance for the different MB concentrations in water. Solid curves are the best least squares linear fits. Linear fit data a) Correlation Coefficient R 2 = 0.999; Intercept = (0.6 ± 0.1) V; Slope = (9.4 ± 0.4) V/ppm; b) R 2 = 0.960; Intercept = (0.0018 ± 0.0008) absorbance units; Slope = (0.149 ± 0.005) absorbance units/ppm; c) R 2 = 0.993; Intercept = (0.8±0.2) V; Slope = (63±3) V/absorbance units.
The Limits of Detection (LOD) for each technique were determined as three times the standard deviation of the ordinate intercept divided by the slope of the calibration curve [17]. The obtained values were (6.34 ± 0.07) ppb for TLM and (80 ± 4) ppb for TLM and for OT, respectively. The most accepted model for the calculation of the TL signal in weakly absorbed media for the mode mismatched dualbeam configuration is described by Shen et al. [36] for a small phase shift of the probe beam, and a further approximation of this model for the configuration used here with a focused excitation beam and a highly collimated probe beam was described by Marcano et al. [37]. This model predicts a linear relationship between the TLM signal and sample’s absorbance, with a proportionality factor depending on well-known experimental parameters as the excitation beam power, the probe beam wavelength, the thermal conductivity, and the temperature coefficient of the refractive index of the solvent. However, this commonly used model does not work well for the third reflection order used here to amplify the signal, because the phase of the probe beam is affected by the multiple reflections within the optical cavity so there may be deviations of the proportionality factor from the predicted value, although the linearity between thermal lens signal and absorbance is preserved. Due to this reason, we cannot convert measured thermal lens signal values into absorbances. In Fig. 4c the thermal lens signal amplitude is plotted as a function of the absorbance to show the expected linear behavior between both magnitudes. The solid curve is the best least squares linear fit from which a slope of (63±3)V/(absorbance units) was obtained.
3.3. Monitoring of the photocatalytic reaction
Methylene blue photodegradation using different photocatalysts has been widely studied [18-35]. A solution of 1 ppm of methylene blue in water was placed into a measurement cell in contact with the ZnO film catalyst, which was irradiated with the lamp light. The initial volume of the methylene blue solution was kept constant, at 1.0 mL. Special care was taken to avoid irradiation of the film with the excitation and probe beams. Because there are reports on the degradation of MB via photolysis [23,24], here we performed an experiment whose results demonstrated that both the OT and the TLM signal did not change during more than two hours with and without the UV-violet lamp excitation and in the presence of the excitation and probe beams (It is worth mentioning that in Refs. 23 and 24 the initial MB concentrations are greater than the 1 ppm used here). Using the calibration curves of Fig. 4, the methylene blue concentrations were determined for irradiation times ranging from 0 to 135 minutes by OT and TLM techniques. Since the main goal of the present work is to compare OT and TLM techniques for monitoring the photodegradation of methylene blue, a comparative analysis was performed on the obtained data from both techniques. The results are shown in Fig. 5a), where the concentration evolution with time as measured by both TLM (squares) and OT (circles) techniques is represented. The solid and dashed curves are the results of the best least squares linear fits for the data resulting from the TLM and OT methods, respectively. The obtained slopes and intercept values are given in Table I. The discrepancy in the slopes is about 20%, a value that reduces to about 8% if we consider only the first 105 minutes (see inset and Table I). To strengthen the comparative analysis, in Fig. 5b), the graph of the concentrations obtained by TLM vs. those measured by OT is presented, where the dashed line corresponds to the case for which there is a perfect agreement between the results obtained by means of both techniques, i.e., a slope equal to the unity. The solid line is the result of the best least squares linear fit having a slope of 1.2±0.1, with a coefficient of correlation (R 2) of 0.9431. Additionally, Fig. 5c) shows a Bland-Altman plot, where ∆C is the difference between the methylene blue concentrations obtained with both techniques at each irradiation time, and 〈C〉 is the mean value of them. Notice that 60% of the ∆C values lie within the 95% confidence bonds.
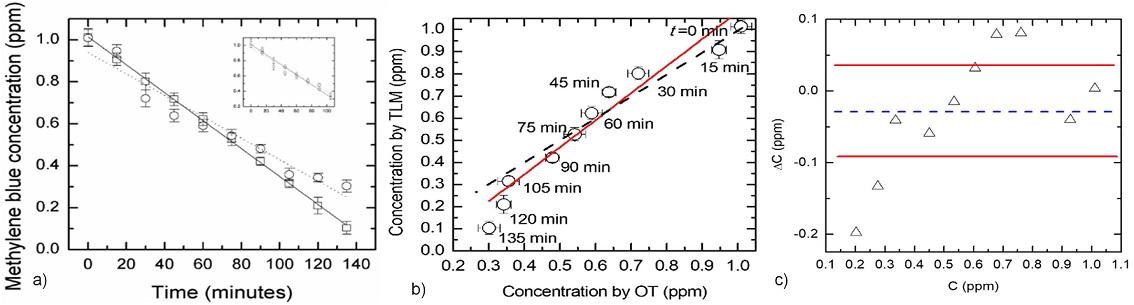
FIGURE 5 a) Concentration as a function of the time measured from the beginning of the irradiation with UV-violet light. The solid and dashed curves result from the best least squares linear fits for the data resulted from the TLM (squares) and OT (circles) methods, respectively. The inset shows the same data and best fitting curves for the first 105 minutes. (see Table I for linear fits’ data). b) Comparison between concentrations determined by both techniques, showing the ideal agreement (dashed line) and the best least squares linear fit (solid line) between them. c) Bland-Altman plot showing the concentration differences mean value (dashed line) and the 95% confidence bounds (solid lines). A t-Student distribution was considered for calculations.
TABLE I Results from the best least squares linear fits for the data shown in Fig. 5a).
| Full measurement range | First 105 minutes | |||||
| Method | Slope ×10−3 ppm/min | Intercept ppm | R2 | Slope ×10−3 ppm/min | Intercept ppm | R2 |
| TLM | −6.66×0.07 | 1.01±0.01 | 0.999 | −6.54±0.09 | 1.01±0.01 | 0.999 |
| OT | −5.5×0.5 | 0.94±0.04 | 0.947 | −6.0±0.7 | 0.97±0.04 | 0.949 |
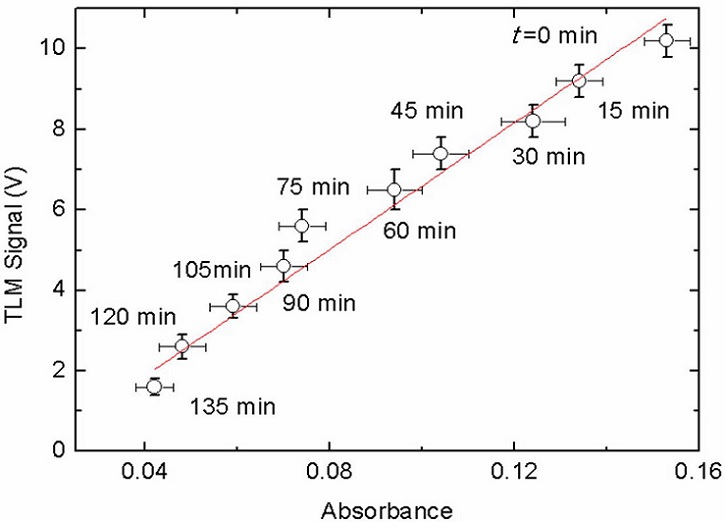
In Fig. 5a), the experimental points from the TLM measurements show a smaller deviation from linearity than those obtained by OT (see Fig. 5a) and R2-values in Table I). Notice that the measurements of Fig. 5 were made in-situ during the photocatalytic reaction. The OT technique is designed for stationary measurements. The monitoring of this kind of dynamic processes by OT is mostly performed in aliquots extracted from the sample or under conditions where the photoreaction is stopped. The minor deviations from linearity observed in the TLM results when compared with those of OT could be due to the advantage of the former, namely a transient method, to characterize time evolutive processes insitu. Note that the characteristic times for the formation of the thermal lens signal are of the order of milliseconds, i.e., much smaller than those necessary for a change in the concentration of the solute due to its photodegradation to be appreciated. Nonetheless, good linearity is observed between TLM signal and absorbance values measured at different times, as shown in Fig. 6. A solid curve is the best least squares fit with a slope (66 ± 4) V/(absorbance units), comparable to that obtained from the same kind of graphs constructed from the calibration curves (Fig. 4c)).
4. Conclusions
A comparison was made between the thermal lens microscopy (TLM) and the optical transmission (OT) techniques for the monitoring of the methylene blue concentration evolution with photocatalytic reaction time, within the concentration range in water, in which both methods have sensitivity. The OT facility was incorporated in TLM set-up. A ZnO thin film grown on a glass substrate by spray pyrolysis technique was used as catalyst, and the reaction was induced by UV-violet light. A linear behavior was observed in the concentration versus time curves obtained with both methods during the photocatalytic process, but deviations from linearity are smaller for the TLM technique. Therefore, this method can be used straightforwardly for monitoring the time-dynamics of a photocatalytic reaction at low solute concentrations.

