


 nova página do texto(beta)
 Inglês (pdf)
 Artigo em XML
 Referências do artigo
 Enviar este artigo por email
 Citado por SciELO
  Similares em
SciELO
Similares em
SciELO 
 Permalink
1. Introduction
The binary alloys based on Ag and Pd have been under intensive investigations due to their promising technological applications, e.g. dental implant/repair and other biomedical products [1,2], optical and dielectric applications, catalytic process [3], as a highly resistive medium against hydrogen embrittlement and permeation membranes for high purity hydrogen (H2) gas production (a clean energy source) [4-6], hydrogen gas (H2) sensing [7], brazing of alloys [8] etc. Ag-Pd is one of the simplest binary system due to presence of continuous solid solubility over the entire range of compositions and temperatures with no structural transformations for all compositions below solidus line [9]. In the past Ag-Pd alloys have been investigated extensively, e.g. thermodynamic properties [9,10-13], temperature dependent lattice parameters [14,15], low temperature magnetic susceptibility [16], thermal and electrical conductivity [17] etc. Later studies on Ag-Pd alloys have been conducted on thin films [5], as H2 gas sensing [3,7], phase diagram predictions by first-principles calculations [18-19] and AgPd nanoparticles as catalyst for CO2 reduction [20] etc. Recent studies on these alloys have shown anomalies in the behavior of electrical resistivity, thermal expansion and differential thermal studies for the alloy with equiatomic composition [21]. However, fundamental physical features of equiatomic alloy are still far from clear. It is expected that these anomalies are linked to an orderdisorder transformation with T c around 300◦C. A direct confirmation of this hypothesis with X-ray, electron and neutron diffraction techniques is presently not possible as the scattering powers of Ag and Pd are nearly similar. Owing to this drawback, the structure of this alloy appears to have not been investigated to the full extent.
This paper deals with the equiatomic Ag-Pd alloy. In-situ X-ray diffraction, electrical resistivity and thermal analysis techniques were employed to investigate structure of this alloy. The results of these experiments are presented here and finally discussed by taking into consideration the relevant literature.
2. Experimental procedure
Samples of Ag50Pd50 were prepared by using the conventional arc-melting for the proposed investigations. The starting alloy materials were 99.999% pure. These polycrystalline samples in the form of buttons were heat treated at 1173 K in vacuum ≥10−6 Torr for two weeks and furnace cooled in order to ensure the homogeneity of the alloy constituents. The chemical composition of the alloy was determined by electron probe microanalysis (EPMA) which revealed that the homogeneity variation of the alloy was at < 1%.
Samples of size 40×3×0.5 mm were then cut from cold rolled homogenized buttons to carry out an isochronal annealing experiment to observe the dependence of residual electrical resistivity on the annealing temperature. The cut sample was annealed at 1123 K for 1 week and quenched before the resistivity experiment. During resistivity measurements of the Ag50Pd50 alloy, the annealing time at each annealing step was one hour per step and the temperature was increased in steps of 298 K from 373-1123 K. The samples were transferred to a cryostat kept constantly at liquid nitrogen temperature. This enabled to keep the contribution of phonons to the resistivity constant. The measurements were performed relative to a reference sample of the same material placed besides the actual sample in the cryostat, by employing a Thompson bridge with an accuracy of ±5%.
In order to determine order-disorder transformation temperature of the alloy, the DTA and DSC experiments were performed. For this purpose part of the button was converted into powder manually. The powder was then annealed at 623 K under vacuum to relieve the residual stresses. The DTA experiment was performed at a heating rate of 1 K/min in the temperature range of 0-973 K using the DTA (Seiko TG/DTA32-L013-59) instrument under purified argon gas atmosphere and an alumina pan. On the other hand, specific heat (Cp) was measured using a DSC (MTC 3100S) instrument in argon atmosphere and aluminum pan at a heating rate of 0.5 K/min. X-ray diffraction experiments were performed using a Philips X’Pert diffractometer fitted with a Cu target and a Ni-filter in two stages. In the first or initial stage, the sample was studied for determination of basic structure and room temperature lattice parameter followed by determination of type of ordered structure of the alloy. For this purpose, fine powder was prepared manually from bulk specimen. The powder so formed was then annealed in a vacuum ≥10−6 Torr for one week at 1073 K and then furnace cooled to 573 K and annealed again for one month to achieve the equilibrium state of the structure at this temperature. The operating parameters of the X-ray tube were 45 kV and 40 mA. The room temperature structure and lattice parameters were determined with the help of Cu Kα radiation. However, for order-disorder study, monochromatic Cu Kβ radiation was chosen for the purpose. Since, the X-ray diffraction patterns usually show a well resolved Cu Kα doublet at higher angle peaks but in this particular case the splitting was difficult to observe due to expected tetragonality of structure.
In the second phase, temperature dependent X-ray diffraction experiments were performed to study the changes in lattice parameter. The temperature was increased in steps of 10 K with a holding time of 10 minutes per step. The data was recorded in the step scanning mode with a step of 0.01◦ in 2θ in the angle range of 20-140◦. The lattice parameter was calculated with the usual least squares fitting of NilsonRiley plots.
3. Results and discussion
3.1. Residual electrical resistivity measurements
The temperature dependent resistivity data measured for the equiatomic alloy (Ag50Pd50) is shown in Fig. 1. The resistivity is seen to increase in the low temperature range but a sharp decrease is observed with the increase of temperature reaching minimum at ∼523 K. The resistivity thereafter exhibits an increasing behavior up to ∼923 K with further rise in temperature and then decreases again. These effects are attributed to the simultaneous formation of short- and long range order in this alloy. Aarts et al. has also concluded through their studies on the same alloy that the resistivity changes are due to ordering [22].
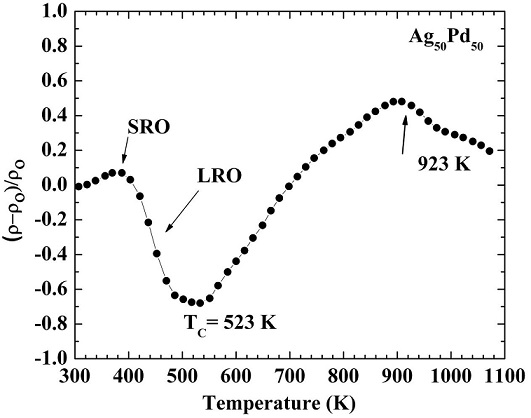
FIGURE 1 Normalized residual electrical resistivity of the Ag50Pd50 alloy measured as a function of temperature during isochronal annealing experiment.
The sample has a large number of quenched-in vacancies initially. When the sample is annealed isochronally, the quenched in vacancies anneal out and a rearrangement of atomic species takes place (formation of short range order) due to which the resistivity increases during the first few annealing steps. Such behavior is typical for these type of alloys because more number of atomic jumps are required for achieving the equilibrium state of the long range order as compared to those required for the formation of short range order. The reason is that diffusion rate is slow for long range order formation as compared to that in the case of short range order. The resistivity therefore decreases with the increasing temperature upto ∼523 K where the order-disorder transition takes place. With further rise in temperature > 523 K, disorder increases which results an increase in the resistivity. The decrease of resistivity at 923 K is linked to the inadequate quenching rate. This shows that the diffusion rate above this temperature is very high and the quenching rate is inadequate to freeze the states corresponding to the temperature. It is thus concluded that the transition temperature for the assumed order-disorder transformation in this alloy is around 523 K.
3.2. Differential thermal analysis and differential scanning calorimetry experiments
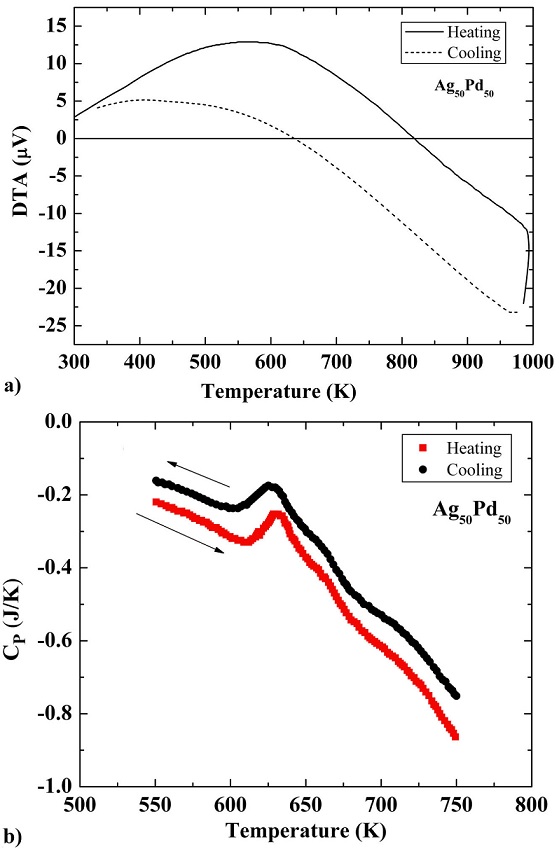
The results of differential thermal analysis (DTA) test for Ag50Pd50 alloy are shown in Fig. 2a). A maximum can be clearly seen during both heating and cooling with peak temperatures of ∼ 627 K and ∼ 630 K, respectively, exhibiting a normal thermal hysteresis in the investigated temperature range. This broad peak is endothermic indicating kinetic nature of the phase transformation taking place at this temperature. Similarly an endothermic peak can be observed in differential scanning calorimetry (DSC) test result curve in almost the same temperature range as that of DTA as shown in Fig. 2(b). Thus, the results of DSC, DTA, and resistivity data are consistent for the alloy.
3.3. X-ray Diffraction Studies
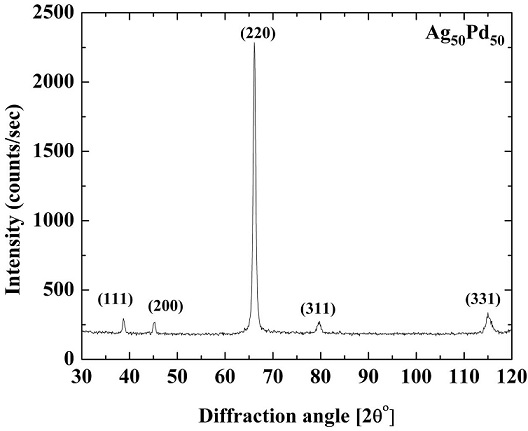
Initial X-ray diffraction pattern generated for the alloy is shown in Fig. 3 which is that of complete solid solution FCC structure with no superstructure peaks visible. It can be seen from Fig. 3 that the intensities of the diffraction peaks deviate from the expected theoretical intensities. This is due to presence of preferred orientation (which could not be eliminated even by annealing) in the polycrystalline samples resulting from cold rolling of alloy into thin sheets. The lattice parameter determined by the least squares fitting of the Nelson-Riley function was 3.977±0.001 Å, whereas Vegard’s rule suggests that it should be 3.99 Å. Thus, there is a negative deviation of the measured value of lattice parameter from that shown by the Vegard’s rule. The measured lattice parameter is in agreement with the findings of other researchers [14]. Similar observation on negative deviation of measured value of lattice parameter to that calculated with the Vegard’s rule has also been reported by Venudhar et al. [15].
As proved by the electrical resistivity measurements, DTA- and DSC- experiments, order-disorder transformation takes place around 523-573 K in this alloy. Therefore, the lattice parameter is expected to change drastically around the order-disorder transition temperature. We therefore performed the in-situ X-ray diffraction experiments to study the change in lattice parameter as a function of temperature. Figure 4 shows the change in lattice parameter as a function of annealing temperature for this alloy. It can be seen that the value of lattice parameter changes drastically at ∼523 K. This low temperature anomaly exhibited by the lattice parameter is attributed to an order-disorder transformation at ∼523 K. From Fig. 4 it is clear that the lattice parameter in the disordered state is an order or magnitude higher than that in the ordered state because the ordered structure is more compact than the disordered one.
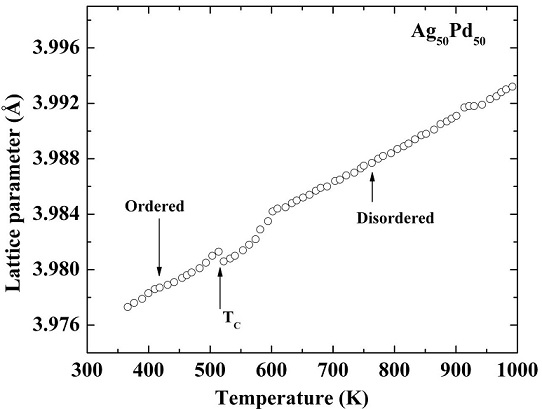
FIGURE 4 The variation in the lattice parameter of Ag50Pd50 as a function of temperature determined from the in-situ X-ray diffraction experiments.
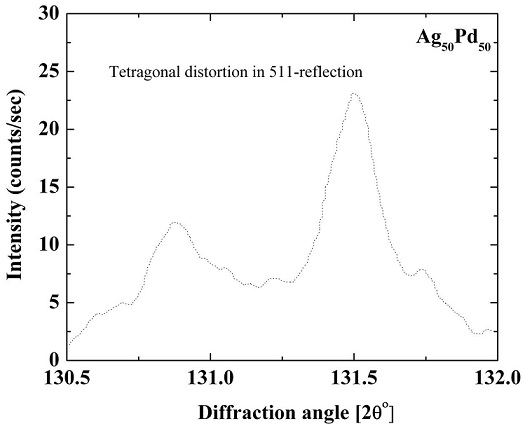
As already mentioned, X-ray diffraction pattern was recorded in order to determine the type of ordered structure using the CuKβ radiation (λ=1.392 Å) in the angle range of 45-47±, 130-132±. This is the range where (200) and (511) peaks lie. Although, it has less intensity than CuKα radiation, yet it has a single wavelength which enables the observation of peak splitting due to FCC to tetragonal ODPT in the diffraction patterns.
Figure 5 shows the intensity data recorded for the high angle (511)- fundamental peak using the CuKβ-radiation. The data was corrected for instrumental broadening and background. The pattern (not shown here) shows sharp fundamental peaks in the low angle range but no tetragonal splitting was observed. In the high angle range, we were able to see a small asymmetric distribution of the (511)-peak as indicated in Fig. 5. This suggests that there is some tetragonal distortion of the lattice owing to the formation of the L10-type ordered structure in this alloy [18-19]. Although, a few theoretical studies have shown the formation of super lattice of L10-type in this alloy which has tetragonal structure, but due to the similarity of scattering factors of Ag and Pd, the superstructure peaks cannot be observed in the diffraction patterns. The splitting of the 511-peak can be explained as follows: if we consider, e.g., (200), (020), (002) peaks in the diffraction pattern of this alloy, then for cubic structure a = b = c so all three peaks will overlap, but for the tetragonal structure a = b ≠ c so there is a separation of these peaks in case of the formation of L10-type structure, the diffraction patterns for this alloy should show some splitting of high angle peaks as described above. The c=a ratio is then either calculated by taking the ratio of the corresponding d-values of the splitted peaks or the Hull-Davey graphical method. Attributing the splitting observed here to the formation of L10-type ordered structure in this alloy, the c=a ratio was found to be 1.0028 following the Hull-Davey method and intensity ratio for the splitted peaks was calculated to be 1:1.94, which is in accordance with the expectations for the splitting of a Bragg reflection due to tetragonality.
4. Conclusions
In this study, the structure of Ag50Pd50 alloy has been studied with various techniques. It has been found that the alloy exhibits a single phase with FCC structure. No evidence of super structure was found; however, the measured lattice parameter showed negative deviation from the value calculated with Vegard’s rule. Electrical resistivity measurements, DTA and DSC analysis have shown that an order-disorder transformation occurs in the temperature range of 523-573 K. The same was confirmed through in-situ X-ray diffraction which revealed sudden change in the lattice parameter at ~523 K. A very well annealed sample was then further investigated by X-ray diffraction with Cu Kβ-radiation and it showed that the structure indeed exhibits tetragonal distortion due to L10-FCC type order-disorder phase transformation.

