


 nueva página del texto (beta)
 Inglés (pdf)
 Artículo en XML
 Referencias del artículo
 Enviar artículo por email
 Citado por SciELO
  Similares en
SciELO
Similares en
SciELO 
 Permalink
1. Introduction
The phenomenon of a swelling network in low molecular weight liquid crystal solvents has been the subject of many studies for several decades [1-6]. In particular, Flory and Rehner [7] proposed a theoretical model of rubber elasticity based on the swelling equilibrium between the osmotic pressure of the swelling solvent and the elastic forces at crosslinks opposing network strands extension. Other theories were developed based on a variety of arguments; for example, the concepts of scaling and the blob hypothesis proposed by de Gennes for polymers in strong solutions or melts were used to networks [8-10]. F. Brochard [11] has established a fundamental theory on polymer networks in anisotropic solvents. Tanaka et al. [12-14] developed a theoretical formalism describing the dynamics of swelling and deswelling of the gel. Nowadays, swelling properties of responsive gels are still among the topics that get more attention [15-17]. In literature, only a few experimental studies are focused on the swelling behavior using LC compounds [18-21]. The swelling behavior of poly(n-butyl acrylate/1,6hexane-diol-di-acrylate) networks in a eutectic nematic mixture of cyanoparaphenylenes (E7) was investigated [22]. The parameters influencing the swelling extent of a polymer network are, generally, solvent nature, crosslinking density, and temperature.
In this article, to optimize the choice of these parameters and thus find a better correlation of them on the swelling properties of poly(HBMA-co-EHA/crosslinker) networks in the LC 5CB, the experimental design method [23-26] was used. So far, considerable attention has been centered on the application of the central composite design methodology, which has aroused considerable interest [27-31].
Solvent swelling is a common process in polymeric materials [32], and understanding the molecular scale thermodynamically processes associated with swelling may provide new insights into the physical characteristics of polymeric materials.
The parameters influencing the swelling rate are several. In our study, we focused on the influence of the crosslinking density, nature of the crosslinking agent, and temperature. In the conventional methods, the experiments were done by systematically varying studied parameters while holding constant all other. This should be repeated for all influential parameters, which results in a high and unreliable number of experiments. To optimize the effective parameters with the minimum number of experiments, the experimental design methodologies can be useful. One of the experimental design techniques, commonly used for process analysis and modeling, is the response surface methodology (RSM) based on the face-centered central composite design (FC-CCD). This approach allows optimizing the response surface by evaluating the influence on the process of various parameters [33-35]. Using RSM, it is possible to estimate linear, interaction, and quadratic effects of the factors and to predict the model for the response [36-38]. In this way, RSM designs could be used to find optimal process settings in efficient use of resources.
In this study, we used three different crosslinking agents (PPGDA 900, TPGDA, and HDDA), and three concentrations (1, 2, and 3wt − %) for each crosslinking agent. Therefore, we have elaborated nine different copolymer networks by varying the nature and the crosslinking agent density. In this regard, three samples of different degrees of crosslinking with the same rate of monofunctional monomers (HBMA/EHA mass ratio = 1/1) were elaborated. In each precursor mixtures, 0.5wt −% of Darocur 1173 was added as a photoinitiator. Optical microscopy technic was used to determine the variation in the network sizes from initial to swollen states at different temperatures.
2. Experimental part
2.1. Material
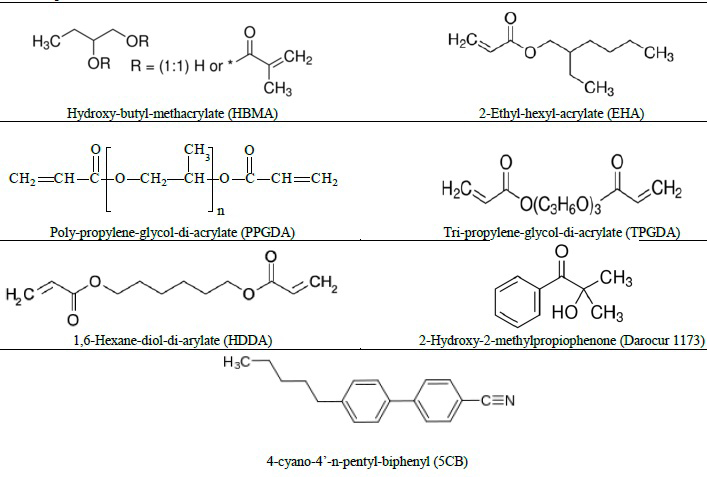
Monofunctional monomers hydroxy-butyl-methacrylate (HBMA) and 2-ethyl-hexyl-acrylate (EHA) were obtained from Sigma-Aldrich (Germany). Bifunctional cross-linking agents, poly-propylene-glycol-di-acrylate (PPGDA 900) and tri-propylene-glycol-di-acrylate (TPGDA) were obtained from Sigma-Aldrich (Japan) and (USA) respectively, and 1,6hexane-diol-di-acrylate (HDDA) were donated from SigmaAldrich (Japan), whereas the photoinitiator 2-hydroxy-2methylpropiophenone (Darocur 1173) is from Sigma-Aldrich (Italy). The nematic liquid crystal 4-cyano-4’-n-pentylbiphenyl (5CB) was purchased from Synthon GmbH (Germany). 5CB shows a single nematic to isotropic transition temperature T NI = 35.3◦C.
2.2. Sample Preparation
Synthesis of the copolymer networks consists of preparing initial formulations of different natures and crosslinking densities while keeping the same composition of the copolymer (HBMA/EHA mass ratio = 1/1), whereas the amount of crosslinking densities was fixed at the desired value. The mass fraction of the photoinitiator was kept constant at 0.5wt − %. To prepare the copolymer networks of different crosslinking degrees, nine distinct solutions have been formulated. Mixtures thus prepared in different weight fractions are: HBMA/EHA/PPGDA/Darocur 1173 = 49.25/49.25/1/0.5 wt−%, 48.75/48.75/2/0.5 wt−%, and 48.25/48.25/3/0.5 wt −%. The same formulations have been prepared with TPGDA and HDDA crosslinking agents. Chemical structures of different initial components of mixtures before UV curing are given in Fig. 1.
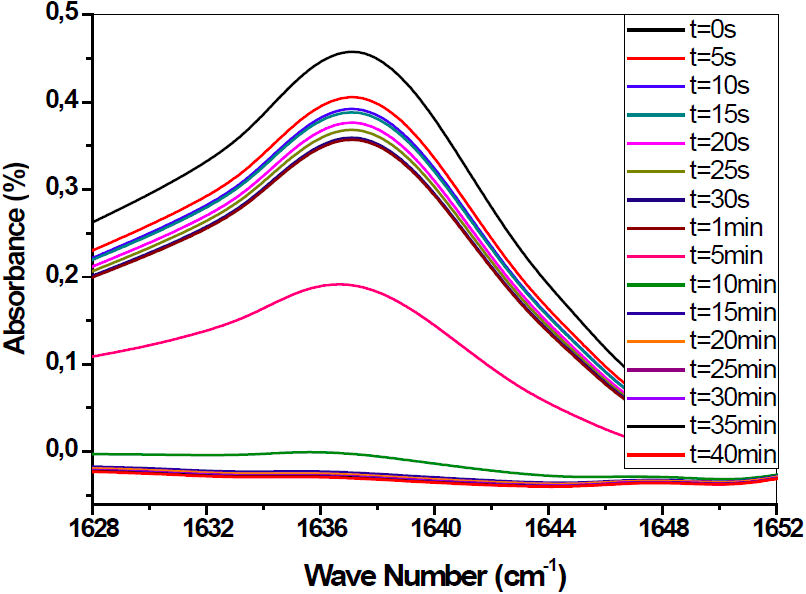
The initial mixtures were stirred mechanically for some hours to obtain a homogeneous solution before the polymerization. The samples were exposed to UV radiation under the nitrogen atmosphere, using Philips TL 08 UV lamps with a wavelength λ = 365 nm and an intensity I 0 = 1.5 mW/cm2. Corresponding bands to the acrylic double bonds C = C are located at 810 cm−1 and 1637 cm−1. Figure 2 illustrates the evolution of the conversion rate of the acrylic functions versus the exposure time to UV irradiation of the precursor monomer mixture HBMA/EHA/2wt−% HDDA/Darocur 1173 corresponding to the band (C = C) at 1637 cm−1. In this figure, we present a zoom of the infrared spectra corresponding to the photo polymerization/crosslinking kinetics of the same precursor monomer mixture. The UV irradiation time of the initial mixtures to obtain a quasi-total conversion of monomers into perfect isotropic networks is t = 40 mn. The obtained conversion rate is 99%.
2.3. Experimental procedures
Square shaped samples were cut from the networks obtained by photopolymerization. To verify the network swelling homogeneity in all directions, the six dimensions of the dry and swollen samples were measured respectively. Dry and swollen samples are shown in Figs. 3a) and 3b), respectively.
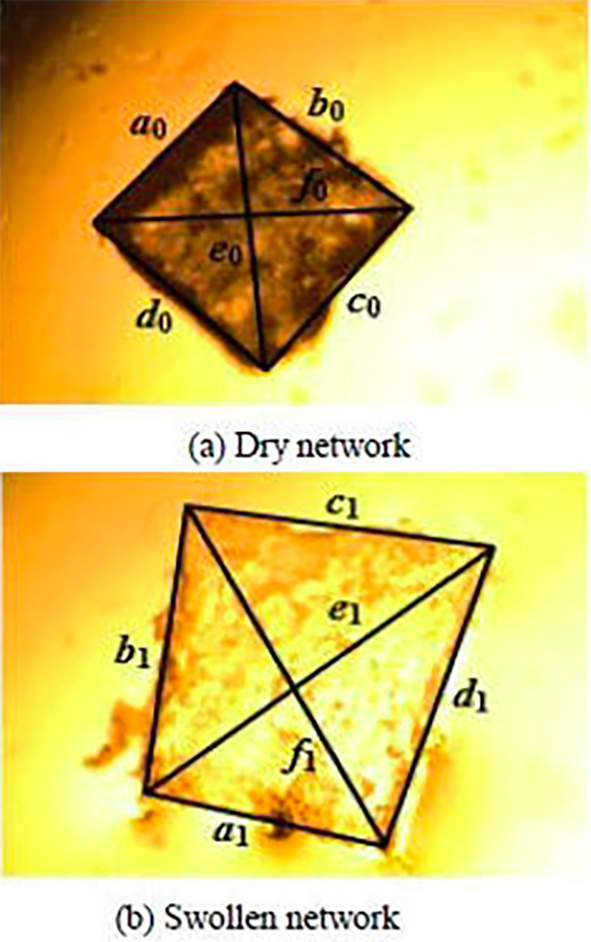
FIGURE 3 Images from optical microscopy observations of poly(HBMA-co-EHA-2%TPGDA) network at T = 25◦C (dry state) and T = 120◦C (higher temperature).
The thermo-optical studies were carried out using a Leitz polarization optical microscope, equipped with a Linkam THMS 600 heating/cooling stage associated with a TMS temperature control unit. The copolymer networks were cut to obtain submillimeter-sized samples, approximately 500×500 µm and thickness of roughly 50 µm (see Fig. 3a)). These samples thus obtained were immersed in an excess of liquid crystal 5CB at room temperature. The swelling behavior of immersed copolymer networks in the 5CB was controlled by observations via optical microscopy. The ratio of the gel size of swollen to dry states makes it possible to determine the degree of swelling of the gel over a wide temperature range from 20 to 120◦C. Micrographs were taken in intervals of 1◦C/mn until the swollen polymer samples reached thermodynamic equilibrium at each given temperature. Smaller temperature intervals were chosen around the nematic-isotropic phase transition temperature of the LC.
2.4. Optimization Method
The ptimization of the swelling ratio of the copolymer/LC system is achieved by using the RSM based on Multiple Linear Regression (MLR) [39]. RSM adopts both mathematical and statistical techniques, which are useful for modeling and analyzing problems in which a response of interest is influenced by several variables, and the objective is to optimize this response. Many different experimental designs can be used to fit response surfaces, and central composite design (CCD) is the most popular design [40]. In particular, the FC-CCD [41,42] is used to study the empirical relationships between response and two factors, temperature and concentration of crosslinker.
The behavior of the system is explained by the following quadratic equation:
where y is the matrix of responses, X i are the coded independent variables of the system, b 0 is the intercept, b i , b ii and b ij are the linear, pure quadratic and interaction regression coefficients, respectively. ∈ represents the statistical random error term.
The b’s are obtained by minimizing the total random error based on least-squares fitting as;
where X is the M × N information matrix. N shows the number of a run, and M is the number of b coefficients. In this work, the value of N and M were 11 and 5, respectively. Eleven experiments are used to estimate the model coefficients. The corresponding two variables central composite design is shown in Table I. The variables are coded according to the following equation:
where X i is the coded value of the i th independent variable, x i represents the natural value of the ith independent variable, x 0 is the natural value of the i th independent variable at the center point at the investigated area, and ∆x presents the step range [43,44].
TABLE I Levels of variables and factors considered for experimental design
| Levels | ||||
|---|---|---|---|---|
| Variables | Factors | -1 | 0 | +1 |
| X1 | U1 : Temperature(◦C) | 20 | 70 | 120 |
| X2 | U2 : Concentration (wt-%) | 1 | 2 | 3 |
The RSM with a minimum number of experimental runs can evaluate the interaction effects of variables without preliminary screening tests.
3. Results and discussion
3.1. Swelling Kinetic Study
Figure 3 shows the unidirectional swelling degree from average diameters in the dry l 0 and the swollen l state obtained by the optical micrograph at the thermodynamic equilibrium. The unidirectional swelling ratio λ can be obtained using the Eq. (4)
where V represents the sample volume in the swollen state, and V 0 is the initial volume of the dry sample. The LC volume fraction (( LC was calculated from
where:
Q represents the swelling degree of the gel volume. The parameters α 0, α 1, b 0, b 1, c 0, c 1, d 0, d 1, e 0, e 1, f 0 and f 1, obtained following the illustrations of Fig. 3, corresponds to the average of the network dimensions.
Figure 4 represents the swelling kinetics curves of the poly (HBMA-co-EHA) networks in the liquid crystal 5CB, versus the crosslinking agent nature and the temperature. These results were obtained with a large number of samples prepared under the same conditions and analyzed by optical microscopy. The temperature range is between ambient temperature of 20◦C and 120◦C. Depending on the behavior of the LC 5CB phase, this graph is divided into two distinct areas. The first is located between the ambient temperature and the nematic-isotropic phase transition temperature T NI of the LC 5CB, while the second is located beyond the T NI . The vertical dotted line corresponds to the nematic-isotropic transition temperature T NI of LC 5CB.
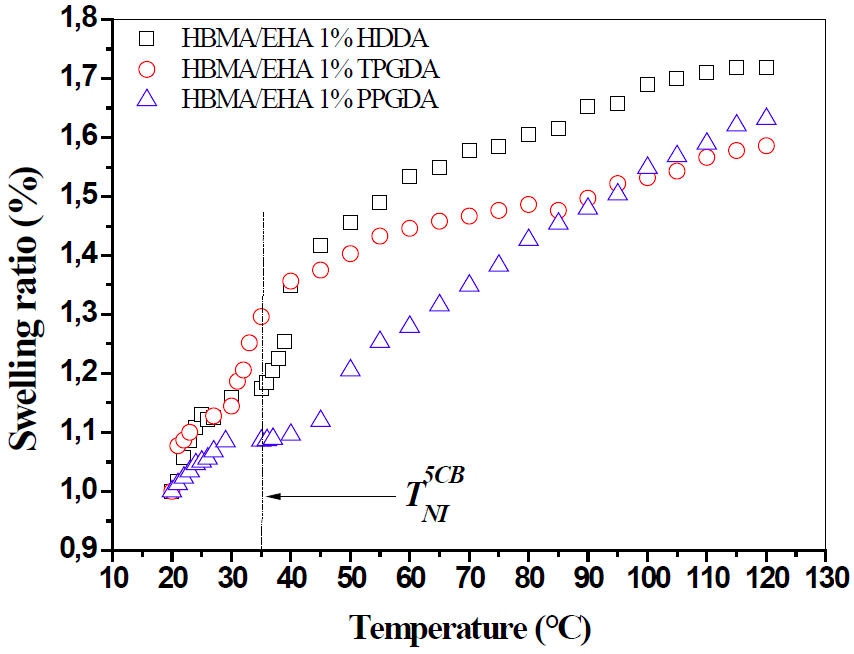
FIGURE 4 The swelling behavior of poly(HBMA-co-EHA/1wt− % crosslinker) networks in LC solvent 5CB in terms of the nature of crosslinker and temperature.
To permit easy reading of the results analyzes, the
poly(HBMA/EHA/1wt − %HDDA/Darocur 1173),
poly(HBMA/EHA/1wt − %TPGDA/Darocur 1173) and
poly(HBMA/EHA/1wt−% PPGDA/Darocur 1173) networks are
respectively designated by network 1.a, network 1.b,
and network 1.c. Between 20 and 30◦C, a slow swelling
kinetics is observed for the three networks. Around the
It can be concluded that for a concentration of 1wt−% of crosslinking agent, the network 1.c (PPGDA) is more flexible and can still swell, but the heating device we have is limited to 120◦C. The network 1. b (TPGDA) is less flexible than the first network, while network 1. a (HDDA) is the least flexible of the three networks. Indeed, the PPGDA owns the longest chain of three crosslinking agents, which allows the network a largest free volume compared to the other two networks. In contrast, the HDDA monomer owns the shortest chain, and thus allows the network to have a faster thermodynamic equilibrium than that of the other two networks.
To verify the crosslinking agent concentration effect, we then studied the same networks but crosslinked at 2% by weight and under the same conditions.
The poly(HBMA/EHA/2wt − %HDDA/Darocur 1173), poly(HBMA/EHA/2wt − %TPGDA/Darocur 1173) and poly(HBMA/EHA/2wt−%PPGDA/Darocur 1173) networks are respectively designated by network 2.a, network 2.b, and network 2.c. The swelling kinetics curves of these systems are presented in Fig. 5.
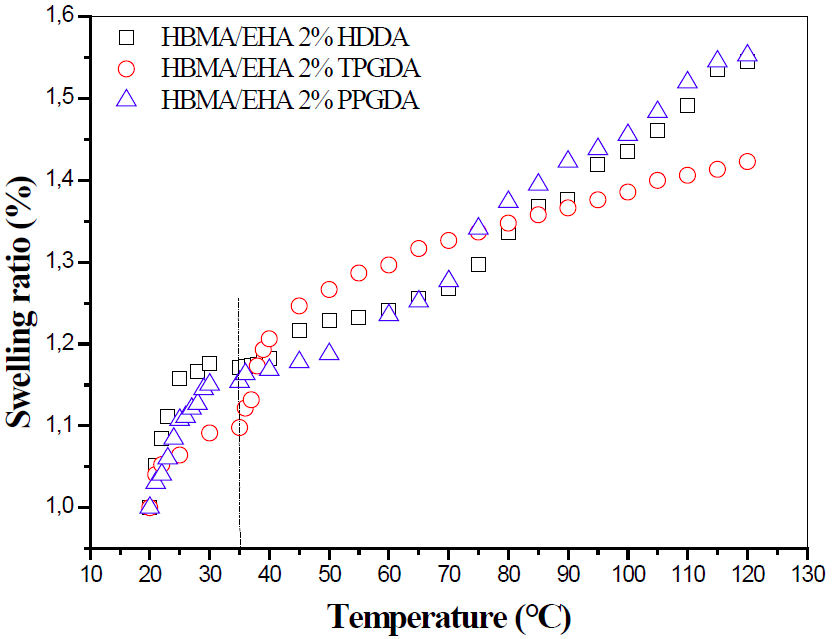
FIGURE 5 The swelling behavior of poly(HBMA-co-EHA/2wt− % crosslinker) networks in LC solvent 5CB in terms of the nature of crosslinker and temperature.
Before the
After 2%, we studied the same networks, crosslinked to 3%, and under the same conditions. The poly (HBMA/EHA/3wt − %HDDA/Darocur 1173), poly(HBMA/EHA/3wt−%TPGDA/Darocur 1173) and poly (HBMA/EHA/3wt −%PPGDA/Darocur 1173) networks are respectively designated by network 3.a, network 3.b, and network 3.c. Figure 6 illustrates the swelling kinetics curves of these systems.
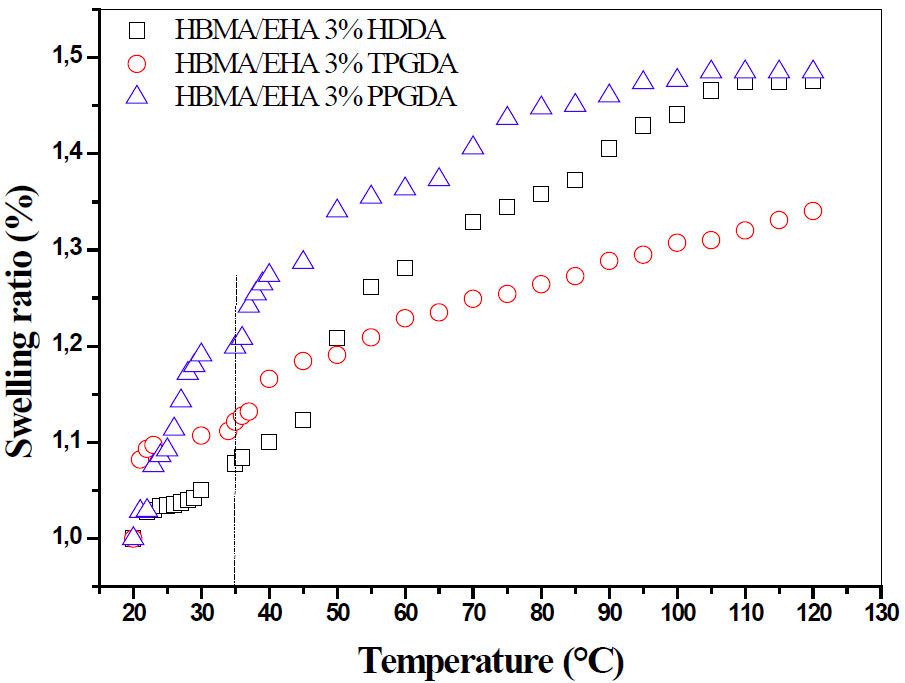
FIGURE 6 The swelling behavior of poly(HBMA-co-EHA) networks crosslinked with 3% in LC solvent 5CB in terms of the nature of crosslinker and temperature.
Before the
A significant swelling beyond T NI can be explained by entropic arguments. The transition of the LC molecules disorder in the isotropic phase to a unidirectional order in the nematic phase leads to an important increase in the LC molecules’ mobility, thus facilitating the diffusion into the network.
In this regard, this situation was in agreement with the investigation reported by R. Vendamme et al. [45] which states that the swelling of poly(Abu/HDDA/Darocur 1173) networks in the presence of LC solvent increases with increasing temperature and decrease in crosslinking density. It can be concluded that the swelling rate depends closely on the temperature, the crosslinking degree, and their interaction.
3.2. Optimization procedure
To achieve the optimal experimental conditions of the swelling behavior, we used the FC-CCD 22. The experimental design and statistical analysis were carried out using MODDE Software Version 9.1.
During the preliminary study, factors that could have a stronger influence, were extracted for further analysis. Two input factors; temperature and crosslinking density, and three value levels were defined; low, zero, and high. Details are given in Table I.
Eleven swelling rates were designed applying this experimental design, which can be divided into three parts and can be distinguished in Table II.
TABLE II Matrix X for experimental design and swelling ratios.
| Exp. N◦ | Run Order | X1 | X2 | Swelling rates (%) | ||||
| Coded | Real | Coded | Real | PPGDA | TPGDA | HDDA | ||
| 1 | 11 | -1 | 20 | -1 | 1 | 1.01 | 1.10 | 1.01 |
| 2 | 3 | +1 | 120 | -1 | 1 | 1.63 | 1.60 | 1.70 |
| 3 | 10 | -1 | 20 | +1 | 3 | 1.02 | 1.02 | 1.02 |
| 4 | 7 | +1 | 120 | +1 | 3 | 1.53 | 1.34 | 1.49 |
| 5 | 2 | -1 | 20 | 0 | 2 | 1.03 | 1.00 | 1.00 |
| 6 | 4 | +1 | 120 | 0 | 2 | 1.55 | 1.42 | 1.53 |
| 7 | 9 | 0 | 70 | -1 | 1 | 1.35 | 1.46 | 1.45 |
| 8 | 6 | 0 | 70 | +1 | 3 | 1.28 | 1.24 | 1.32 |
| 9 | 1 | 0 | 70 | 0 | 2 | 1.28 | 1.32 | 1.26 |
| 10 | 5 | 0 | 70 | 0 | 2 | 1.29 | 1.33 | 1.27 |
| 11 | 8 | 0 | 70 | 0 | 2 | 1.30 | 1.34 | 1.28 |
Experiments 1-4: N F = 22 factorial experiments carried out at the corners of the cube.
Experiments 5-8: N α = 2×2 axial experiments carried out on the axes at a distance of ±α from the center. The distance α is calculated to obtain ratability. The value of star experiments can be obtained as well as α = ±1
Experiments 9-11: N 0 experiments are carried out at the center of the experimental domain. The replication of the central experiment is a requirement for a better understanding of random errors.
The correlation coefficient R2 quantitatively evaluates the correlation between the experimental data and the predicted responses. Q2 is the variation percentage of the predicted response by the model according to cross validation. Adjusted R2 designated by R2 Adj. is also a measure of the quality of a fit. The experimental results and the predicted values obtained from the model were compared. It was found that the predicted values matched reasonably the experimental values. Statistical results of the experimental design model are reported in Table III.
TABLE III Statistical results of the experimental design model
| PPGDA | TPGDA | HDDA | |
| R2 | 0.997 | 0.995 | 0.991 |
| R2 Adj | 0.994 | 0.989 | 0.981 |
| Q2 | 0.976 | 0.957 | 0.931 |
| R.S.D. | 0.01598 | 0.01919 | 0.03126 |
| Conf. lev. | 0.95 | 0.95 | 0.95 |
In addition to the correlation coefficient, the adequacy of the models was also evaluated by the correlation of observed values of the experimental swelling ratio in relation to predicted values of the response obtained from the experimental design model (see Fig. 7). The high values of R2 and R2 Adj. indicate a high dependence and correlation between the observed and the predicted response values. These results indicate good agreements between the experimental and predicted values of the swelling ratio.
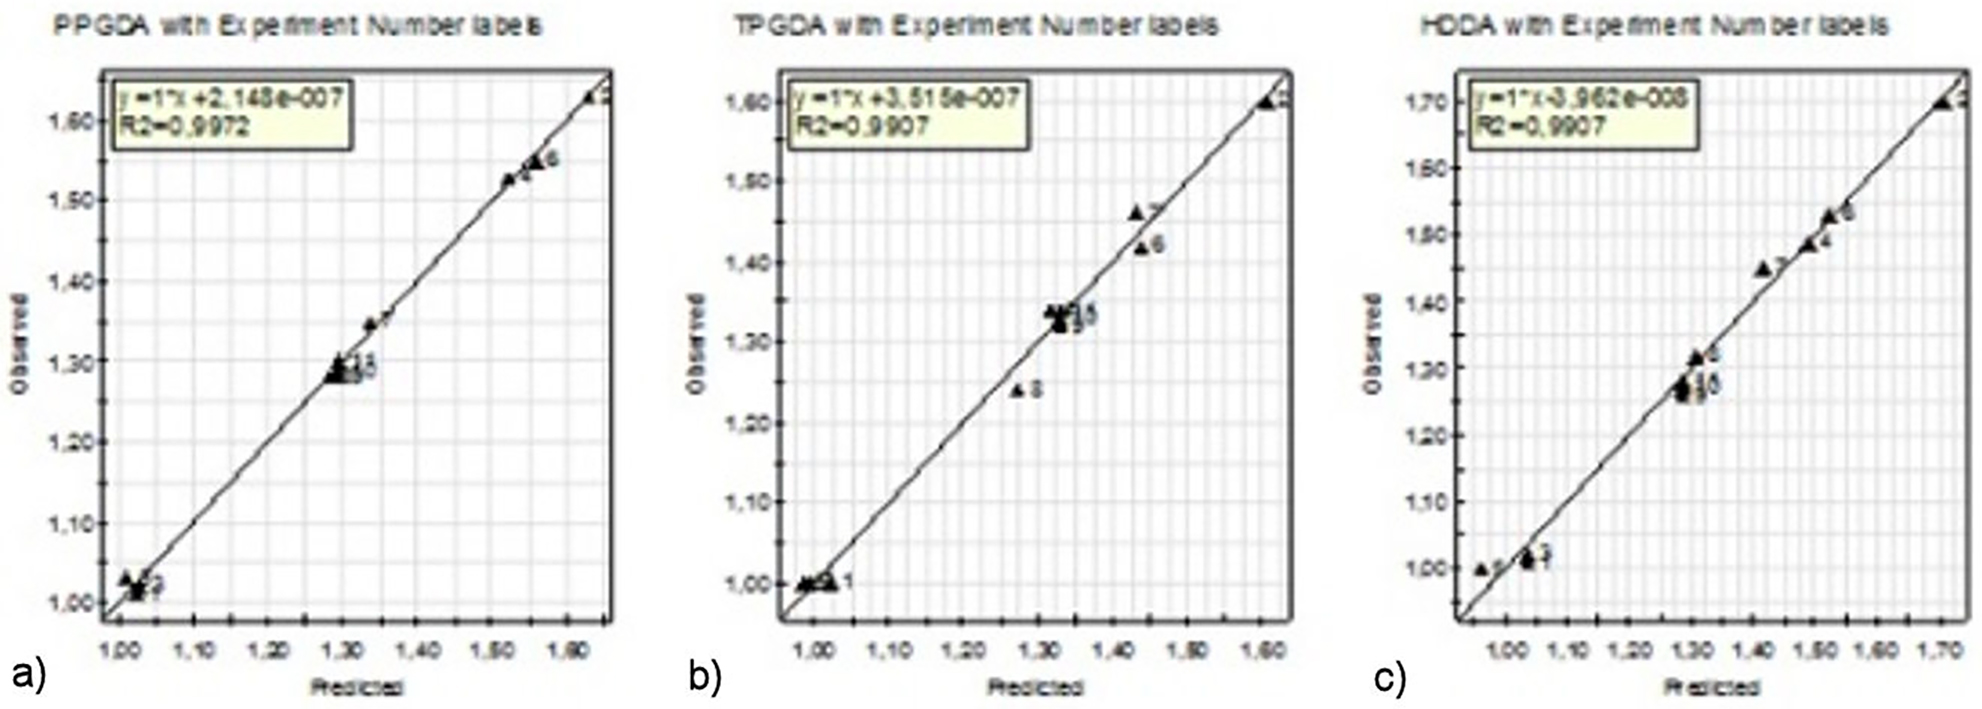
FIGURE 7 Comparison of swelling ratios of predicted values and experiment data for the three copolymers.
The coefficients of factors effects (b 0, b 1 (temperature), b 2 (concentration)) and the coefficients of interactions between these factors (b 11 (temperature / temperature), b 22 (concentration / concentration), b 12 (temperature / concentration)), obtained from the experimental design model are presented in Table IV. The coefficient is significant (different from the noise) when the confidence interval doesn’t cross zero.
TABLE IV Coefficients of the factor effects (b0, b1, b 2), and coefficients of interactions between these factors (b11, b22, b12), obtained from the experimental design model.
| PPGDA | TPGDA | HDDA | |
| b0 | 1.29895 | 1.32263 | 1.28579 |
| b1 | 0.275 | 0.206667 | 0.281667 |
| b2 | -0.026666 | -0.093333 | -0.055 |
| b11 | -0.012368 | - 0.101579 | -0.044473 |
| b22 | 0.012631 | 0.038421 | 0.075526 |
| b12 | -0.0275 | -0.045 | -0.055 |
To analyze the influential and negligible effects, the histograms of the effects of the coefficients effects on the swelling rate are shown in Fig. 8. In the case of poly(HBMA/EHA/PPGDA) network (Fig. 8a)), we note that the coefficient b 1 is the most influential, while the coefficients b 2 and b 12 are identical and much less influential. Moreover, the coefficients b 11 and b 22 are negligible.
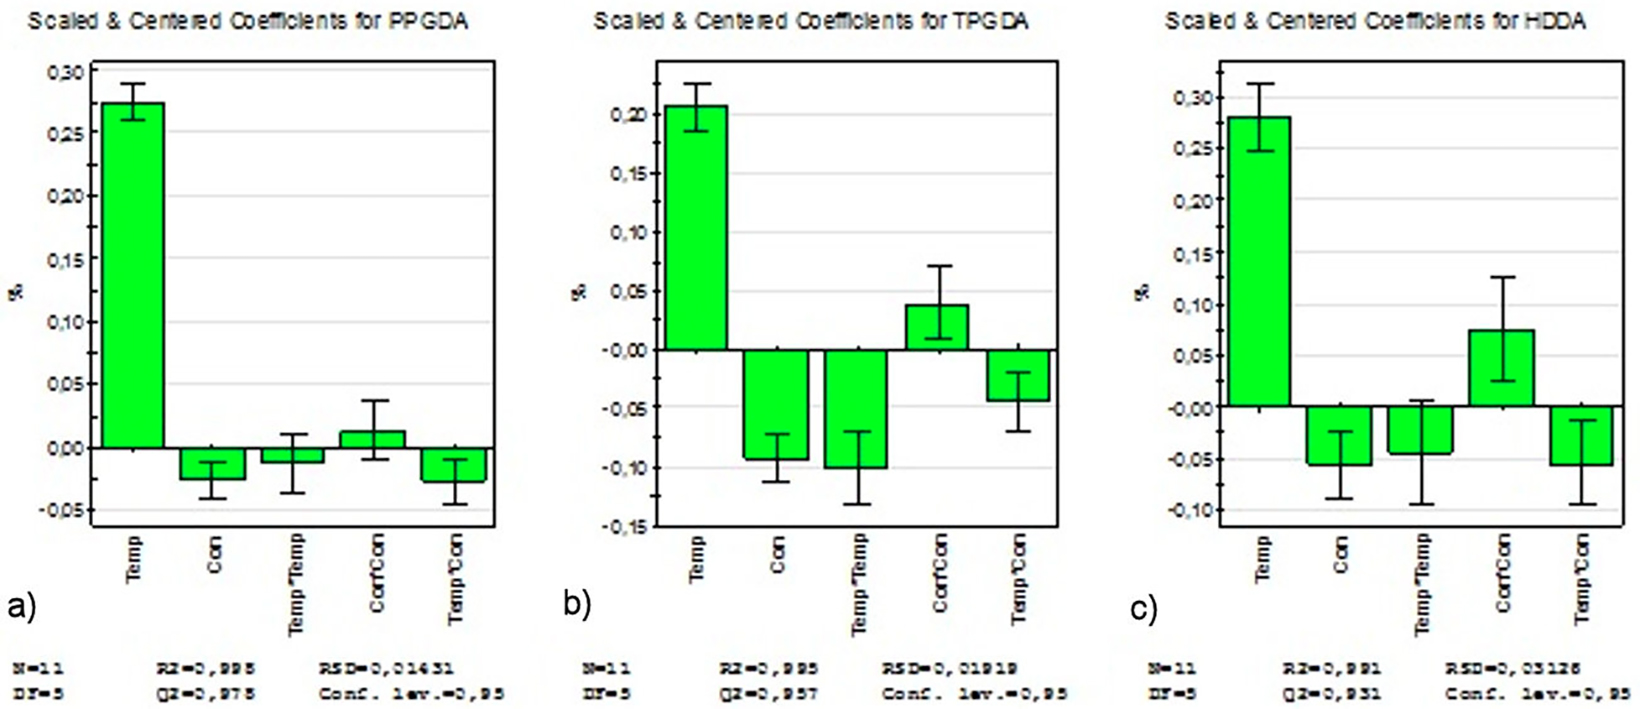
In the case of the poly(HBMA/EHA/TPGDA) network (Fig. 8b)), the coefficient b 1 is the most influential, while the coefficients b 2 and b 11 are almost identical and represent the half of b 1. Moreover, the coefficients b 22 and b 12 are less influential, but not negligible.
Finally, for the poly(HBMA/EHA/HDDA) (Fig. 8c)), the coefficient b 1 is the most influential, followed by b 22 while the coefficients b 2 and b 12 are almost identical and have the lowest influence. Moreover, the coefficient b 11 is negligible.
Analysis of these results indicates that the swelling rates of these copolymers essentially depend on the temperature factor and to a lesser extent on that of concentration. The effect of the interaction (Temperature/Temperature) is greater than that of the concentration in the case of the poly network (HEMA/EHA/TPGDA/Darocur 1173), while it is negligible for the other two networks. However, the effect of the interaction (Concentration/Concentration) is greater in the case of the ploy network (HEMA/EHA/HDDA/Darocur 1173) than that of the concentration. As a result, it can be said that in an experiment taking into account only the influential parameters without taking into account those of the interactions leads to a bad response, hence the interest of experimental designs.
Based on Eq. 1, the regression models for the swelling rate in terms of coded factors are given by:
Studying these responses y i , we can confirm our experimental results, since the swelling rate of the poly(HBMA/EHA/PPGDA) network is the higher, followed by that of the poly(HBMA/EHA/HDDA), and finally that of the poly(HBMA/EHA/TPGDA).
Comparing these findings with those obtained with the poly(Abu/HDDA)-E7 [22], we notice that the temperature/concentration interaction effect (b 12 = −0,08) is the most influential, followed by the concentration effect (b 2 = −0,0472), then that of the temperature quadratic effect factor (b 11 = −0,0371). The observed results are different because these two systems have different architectures and a different liquid crystal. So we can say that the effects coefficients depend closely on the studied factors.
The contour plot is the projection of the response surface in the form of a two-dimensional plane. This analysis provides a better understanding of the variables influence and their interaction on the response. Figures 9 and 10 illustrate the contour curves and the response surface curves between the temperature and the crosslinking concentration on the swelling rate.
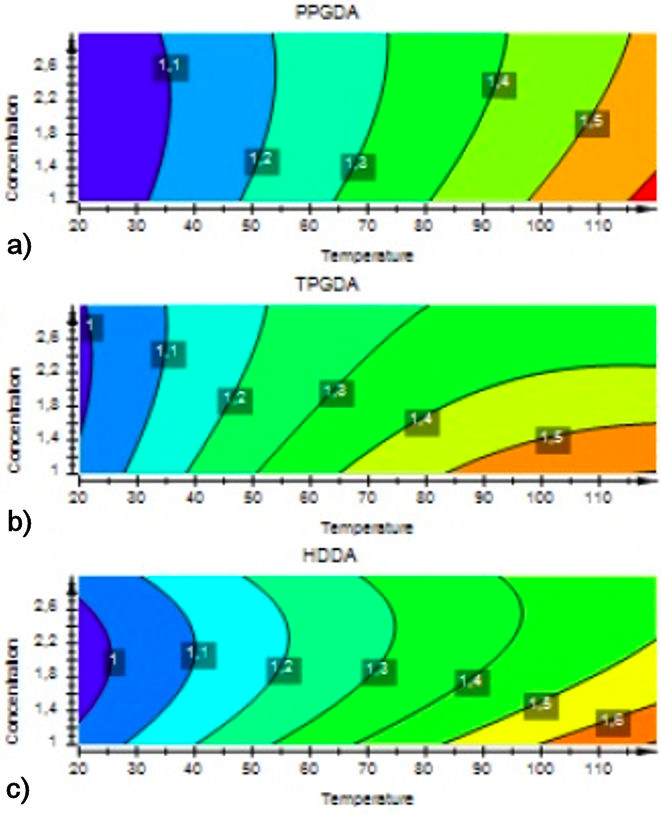
FIGURE 9 Contour plot of effect of the temperature and concentration of crosslinker on swelling ratio.
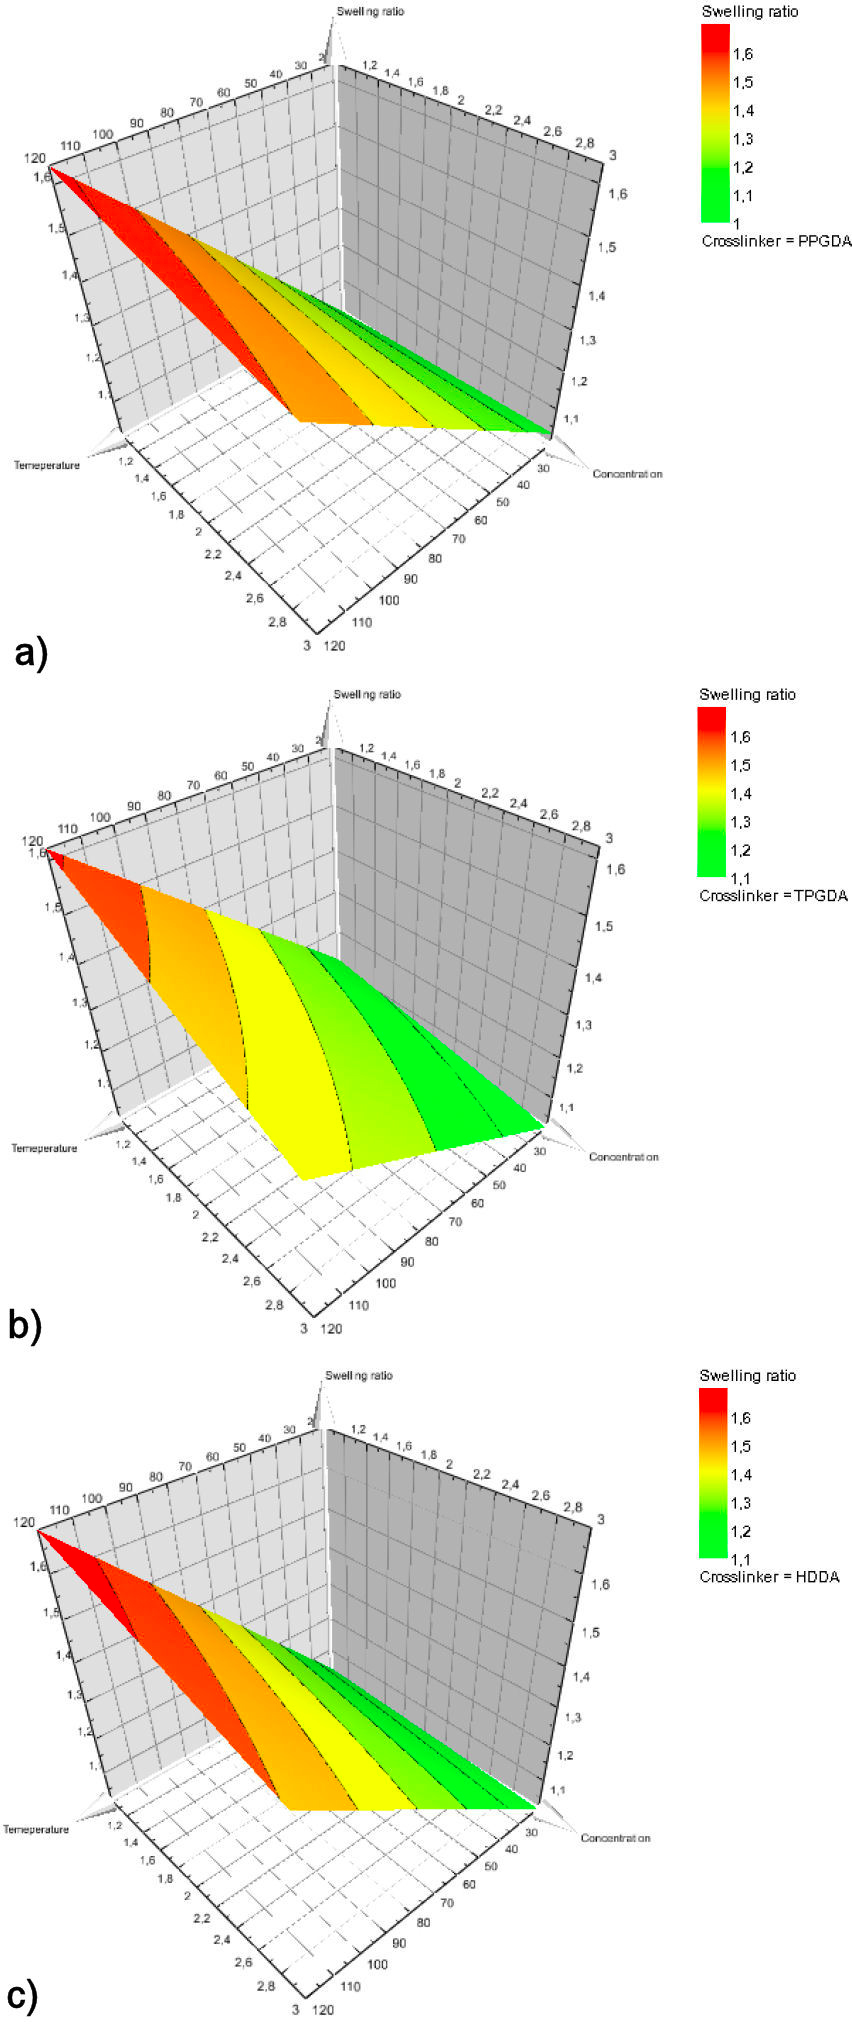
FIGURE 10 Response surface plot of effect of temperature and concentration of PPGDA, TPGDA, and HDDA crosslinkers on swelling ratio.
As shown in Fig. 10, the swelling rate is maximum for the highest temperature (120◦C) and the lowest concentration of crosslinking agent (1%). Besides this situation is in good agreement with the investigation reported by R. Vendamme et al. [44] which states that the swelling of networks poly(Abu/HDDA/Darocur 1173) in the presence of the CL solvent increases with increasing temperature and decreasing the crosslinking density. It can be concluded that the swelling rate depends closely on the temperature, the degree of crosslinking, and their interaction.
4. Conclusion
Using a face-centered central composite design (FC-CCD), the swelling properties of copolymers networks (HBMA-co2-EHA/Crosslinker) were investigated and optimized to find the most influential parameters on the swelling rate. This method was chosen for its ability to estimate the best experimental conditions, to detect the interrelationships between the factors, to model the response data, to locate the response optima, and to contribute to the understanding of the swelling behavior of these systems.
It should be noted that the swelling ratio of these networks is closely related to the temperature and density of the crosslinker as well as their interaction. The swelling rate is proportional to the temperature and inversely proportional to the crosslinking density. The FC-CCD method allowed us to study the effects of both factors as well as their interactions. We found that the effect of temperature is much greater than that of the crosslinking density. Based on the predicted and experimental results, the experimental values were in good agreement with the predicted values proposed by the model with an error of less than 10%.

