nova página do texto(beta)
 Inglês (pdf)
 Artigo em XML
 Referências do artigo
 Enviar este artigo por email
 Citado por SciELO
  Similares em
SciELO
Similares em
SciELO 
 Permalink
1.Introduction
At the end of December of 2019, some new cases of pneumonia were reported in Wuhan, China. It was later announced the pathogen was indentified as a new strain of coronavirus, SARS-CoV-2, deriving in a disease named afterwards COVID-19, which was presumably originated at a market in Wuhan, the capital of the Hubei province 1. At the end of January of 2020, people from different countries of Asia, Europe and North America had already been infected, others had died and numerous cases are still closely monitored 2. As of April 1, 2020, 823,626 confirmed cases and 40,598 deaths have been reported 3.
Although there have been great efforts to treat the novel virus, thousands of people have lost their lives and there is still no cure available. The Chinese, as well as other countries’ governments have tried to contain the infection by quarantining the citizens of Wuhan and other cities. However, the infection is still propagating resulting in the World Health Organization’s (W.H.O.) declaration of Public Health Emergency of International Concern 4 and on March 11, COVID-19 was characterized as a pandemic 5.
This infection has raised concern for the rapid propagation and human-to-human contagion, transmitted through droplets of saliva or discharge from the nose when an infected person coughs or sneezes 6. There was concern aboutthe virus transmission as the Tokyo Olympic and Paralympic Games were less than six months away and that would have meant a huge movement of people through the Air Transportation Network (ATN). As a result, the Olympic Games were postponed until late July of 2021 7. Motivated by its quick spread between countries, we studied the diffusion of the COVID-19 through the ATN with a network science approach.
The ATN is one of the most important transport systems worldwide mainly because it connects almost all the world, with the exception of five countries which do not have an airport in their territory 8.
The organization the ATN primarily has is called spoke-hub, which is a system with a star-like network distribution 9, 10. In this model, important airports or hubs are used to concentrate flights towards other smaller airports as shown in Fig. 1. This type of distribution is preferred by the majority of airlines because it lets them offer more flights and maximize the conection to different airports while minimizing the numer of flights 9. Although this distribution has great benefits, in cases like the one we are experiencing with the COVID-19, this model eases the disease propagation.

From a network perspective, the collection of airports and routes can represent a complex network. From this standpoint we can understand and analyze its connections and dynamic processes such as diffusion.
1.1.Multilayer network formalism
A network, mathematically known as a graph, is a collection of elements called nodes that are interacting with each other, therefore connected by edges.
The nodes and edges do not have to be of the same kind, such structures can be represented with a multilayer network. A multilayer network is a set of networks, each of which depicts a different type of interaction. Every one of these networks is called a layer.
A multilayer network, M, is defined as:
where Y defines the set of layers:
of the multilayer network and
where
The layer’s set of nodes α is denoted by Vα and the set of edges within this layer is Eα that are also known as intralinks.
Finally,
A multiplex network is a particular case of a multilayer network with the following properties 11:
Multiplex networks are multilayer networks in which there is a one-to-one mapping of the nodes in the different layers, known as replica nodes.
Interlayer links can only connect a node with its replica.

Figure 2 Diagram of a multiplex network. Each layer contains a different network that represents a certain type of interaction (intralinks). The dotted lines (interlinks) between the layers connect a node with its corresponding replica.
Because in a multiplex network, there is no explicit treatment of interlinks, it can be viewed as:
where
and by the set of links Eα.
In this case, a multiplex network without interlinks has its whole information encode in a matrix called adjacency matrix, α:
1.2.Network epidemiology
The propagation of infectuous diseases is one of the most studied dynamic processes. Epidemiology is the practice that focuses on studying health problems, their characteristics, distribution, and risks. As we mentioned before, we are interested in the propagation of the current outbreak of coronavirus SARS-CoV-2.
Diffusion of any kind, such as diseases, in a network is a fundamental dynamic process described by the transport of a continuous quantity along its edges 11. There are several ways of modeling diffusion in a network, such as SIR and SIS models 12, 13, nevertheless, one of the simplest forms is with a random walk model.
1.3.Random walk model diffusion
According to the model with an unbiased random walk, a particle located at node i has the same probability of moving to any neighbor node j of node i. This means, if node i is connected to k different nodes, the probability of the random walker to take a step from node i to node j is p = 1/k.
This irregular movement or Brownian motion modeled by the random walk considers the mean square displacement. As stated by Frenkel et al.13, considering an ensemble average, over the trajectories of N particles, the mean square displacement at a time t is defined as:
with
The mean square displacement considered in the brownian motion is given by the Einstein’s relation12:
where
Nonetheless, anomalous diffusion processes exist, i.e., those where the mean square displacement does not follow Eq. (8).
These types of anomalous diffusion follow 12:
where α is a real positive number and
Specifically, we can have three cases: superdiffusion, normal diffusion, and subdiffusion, as summarized in Table I.
2.Methodology
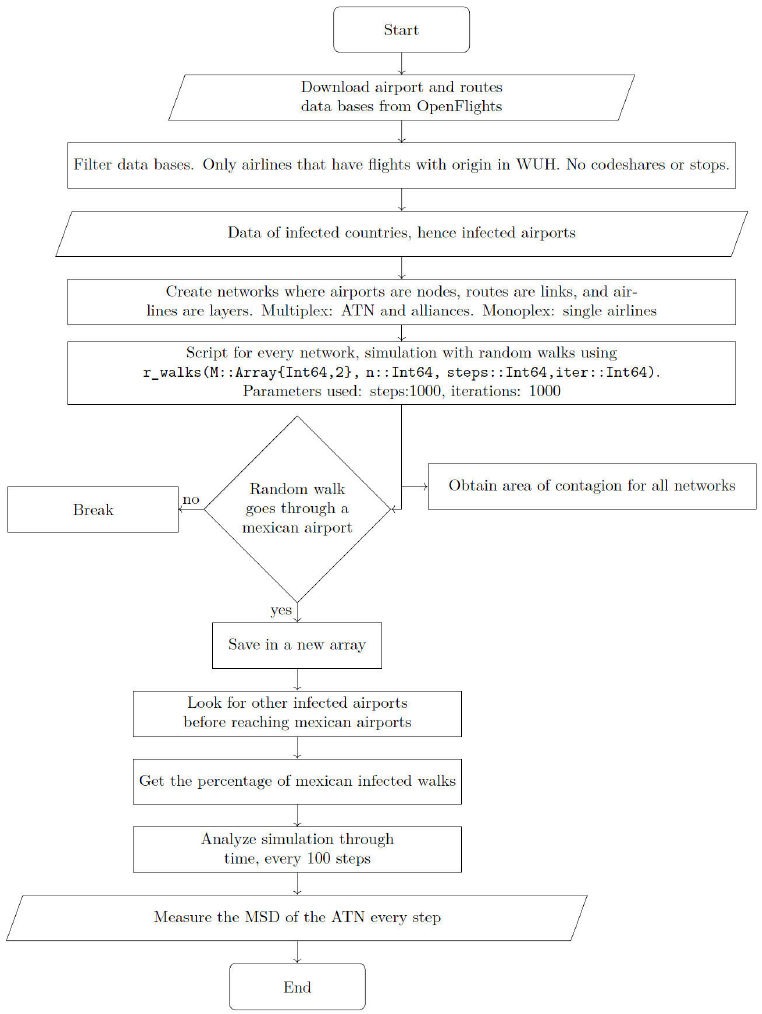
The work flow we followed during this project is shown in Fig. 3. We first downloaded the airline routes and airports data bases from which we got the necessary information to construct the networks. Both data bases were acquired from OpenFlights, one of the largest and most complete public bases 14, 15.
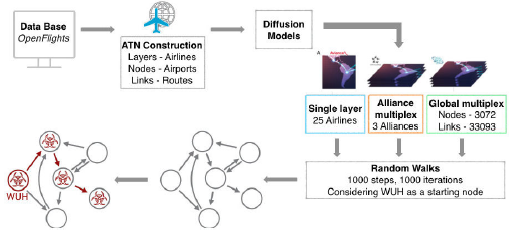
Figure 3 Diagram of the simulation work flow, starting with the acquisition and processing of the airports and routes data. The second step is the construction of the networks and then the diffusion simulation with an unbiased random walk is developed.
The information of airports (updated in 2019) and routes (updated in 2017) was analyzed and filtered so that we only worked with active airports and routes without stops or codeshare operated flights.
Based on the remaining data, we constructed 29 networks of two different types: monoplex and multiplex. We worked with 4 networks of the latter type (the ATN and three alliances: Sky Team, Star Alliance, and oneworld), which correspond to those networks that consist of layers representing every airline in an alliance or in the whole ATN. The remaining 25 networks were monoplex, one for every airline that operates flights from the Wuhan airport. Every network is considered to be a set of nodes or airports with links between them if a direct flight connect them.
The division between the multiplex and monoplex networks was made to characterize the diffusion in different network topologies.
Once the networks were created, we simulated the virus propagation phenomenon with a model of random walks with a probability p= 1 of contagion, i.e., if passed at least once through an arbitrary airport, this one would be considered infected.
Our model took into account the initial airport as “WUH”, the IATA code for the airport located in Wuhan. The random walker took 1000 steps. Considering that a person is able to take three flights in a single day at most, these 1000 steps would correspond to approximately one year in our simulation. The diffusion simulation with the parameters mentioned above was repeated 1000 times to robust our statistics.
We considered as infected nodes the airports located at the cities in which confirmed cases existed as of January 26, 2020 to see if the COVID-19 importation to Mexico was through these airports. We did not take into account the travel ban within Wuhan nor within any other country. However, Chinazzi et. al 13 showed that despite this precautionary measure, the overall epidemic progression is only delayed by 3 to 5 days, so the results of our simulations will be almost the same as if we had taken the travel ban into account.
During the analysis of the COVID-19 importation to Mexico, we considered the list of 76 mexican airports. With that information we looked for the number of random walks, out of the 1000, that arrived at a mexican airport at some point in time and if the coronavirus reached Mexico from Wuhan or from any other place already infected.
The code of everything we did can be found in GitHub: https://github.com/Yuriyama/Coronavirus
3.Results and Discussion
The simulations resulted in a collection of 1000 random walks starting in Wuhan, China. With these simulations, we found that the overall infected portion of the ATN after approximately one year is 13.62%. The ATN’s infected area by the COVID-19, if only traveled through a single airline or or alliance is also shown in Fig. 4, where the percentage is detailed by network.

Figure 4 Histogram of the infected percentage of the Air Transportation Network if travelled through certain airlines or alliances after approximately one year. Networks appear from least number of airports (BX) to most (ATN).
On the vertical axis of Fig. 4, the 29 networks studied are shown, from the least amount of airports in a network, corresponding to BX, to the network containing the largest amount of airports, which is the ATN with 3072 airports and 33093 routes.
The general behavior shows that the more number of airports a network has, the bigger the infected area is. However, the network corresponding to CA (Air China) has a bigger area of contagion with respect to other airlines of approximately the same size node-wise possibly because it is the most important airline in China; thus having more routes from and to China.
In Fig. 4 is shown that after approximately one year, out of the 3072 airports that create the ATN, 418.34 airports are infected in average, corresponding to the 13.62% of the ATN.
To study the risk of importing the COVID-19 virus to Mexico, we focused only on those random walks that at some point reached a mexican airport.
We found that in about 210 flights through the ATN, the infection arrives at Mexico. Also, in all of our simulations, Mexico was first infected after passing through one or several already infected airports. None of them was due to a “direct” contact between Wuhan and Mexico. This confirms what Chinazzi et al., 13 concluded about the number of cases observed outside China would resume its growth after 2 or 3 weeks because of cases that originated elsewhere.
The risk of importing the COVID-19 to Mexico through different networks after a year is shown in Fig. 5. Not all of the 25 airline networks appear because no random walk reached mexican airports while travelling through those (23) networks.
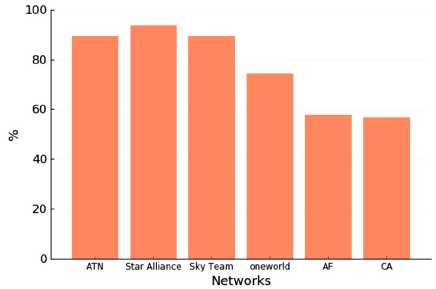
Figure 5 Amount of random walks that infect a mexican airport at any given time of the year simulation presented by network.
From the monopolex approach, the only way for Mexico to get infected is through the Air France airline (AF) and Air China airline (CA). As we mentioned, the random walks through other monoplex airlines did not reach any Mexican airport after one year of simulation. However, if we consider the whole ATN network, we got 89.4% of Mexico’s airports infected. So we can predict that the infection will eventually reach Mexico.
If analyzed through time, the importation risk to any airport of Mexico increases linearly. This is shown in Fig. 6.
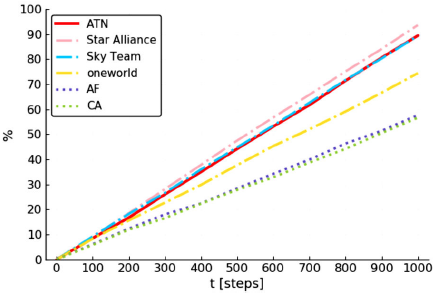
Figure 6 Risk or probability of importing the virus to any Mexican airport as a function of time presented by network.
Figure 6 shows the importation risk of coronavirus to Mexico over time in the different networks. All the multiplex networks (ATN and alliances) begin with the same risk the first month. After the first month and a half, the risk changes between the alliances and monoplex networks. Star Alliance, Sky Team, and the ATN end with a higher probability than other networks. Still at the end of the simulated year, all of them represent a risk of more than 50% to Mexico.
At 500 steps or approximately five and a half months, the probability of importing the COVID-19 to any part of Mexico traveling through the ATN is of 44.2% and there is a 75% of risk after approximately 850 steps since the outbreak of the coronavirus which has been estimated in September.
From these results we can assume that the risk of importing the coronavirus to Mexico is almost certain as time passes - no phramacological intervention therapy nor cure is available yet- due to the increasing linear behavior of the propagation.
As we mentioned in the introduction, the diffusion modeled by a random walk can be described by Einstein’s relation Eq. (8).
In Fig. 7 we plotted the mean square
displacement (using Eq. (7)) as a function of time. In this case, we noticed that
approximately during the first 100 steps, the behavior is that of an anomalous
diffusion, as it is described by a power law with

Figure 7 Diffusion plot with the mean square displacement as a function of time. The solid line shows the best fit to the data points
This behavior indicates how at first the propagation of the coronavirus increases rapidly and after a month it settles to a slightly slower but constant rise of cases. In a similar fashion to what happens with similar viral infections such as SARS, other CoVs and the stationary flu.
4.Conclusions
We explored the risk of the COVID-19 virus infection in Mexico using a diffusive model of random walks throughout two different types of airline networks: the Air Transportation Network and Alliances networks seen as multiplex networks, where nodes represent airports, edges represent flights, and each airline is a layer of the multiplex and monoplex networks which stood for single airlines.
The overall infected area of the networks mainly depend on the amount of airports that constitute it. However, Air China’s infected area after the simulation is larger, we assume this happens because said airline is the flag carrier of China, having more flights within China 16.
We found the COVID-19’s spread behavior is at first that of an anomalous diffusion, specifically a subdiffusion. After approximately one month, the diffusion is overall behaved as a normal one, with a more steady and slower increase.
In particular, Mexico’s risk of being infected by the coronavirus increases linearly over time, having an 89.4% of probability of infection after a year, quite likely an upper bound. So it seems the COVID-19 will eventually and inevitably reach the country, in spite of some travel restrictions that may be imposed. Even if Mexico used to have a relative advantage due to the lack of direct flights between Wuhan and Mexico’s airports -that indeed delays the arrival- there are direct flights from already infected countries to Mexico, hence highlighting the networked nature of pandemics. So, as more countries continue to get infected in spite of the Wuhan travel ban, the chances of contracting the disease in Mexico remain high unless some other form of effective medical containment is applied.
The random walk model we used is very simple and works as a first approach to the problem, taking Wuhan as an only starting point (not from other infected countries) and its trajectory. First of all we are just analyzing possible contagions through the Air Tranportation Network, we are not considering other ways of transmission (layers of the multiplex) like the maritime or terrestrial networks. We also do not consider groups of susceptible, infected, and recovered people as in a SIR model 11, 18 hence our model is not sensible enough to many situations or changes as other more robust models. Nevertheless, we were able to capture a high risk of infection in Mexico which is what we are in fact witnessing.
As data becomes available it will be possible to fine tune the parameters of the random walk to better reproduce actual contagion. This will allow a simple yet reliable estimator to be used as an auxiliary to survey-based epidemiological reports. Such reports will still be the main source of historical information and the main tool in medical and public health decision making. However, data driven, theoretical approaches such as the one we presented, allow for (inconclusive and preliminary, yet useful) forecasting schemas.