


 nova página do texto(beta)
 Inglês (pdf)
 Artigo em XML
 Referências do artigo
 Enviar este artigo por email
 Citado por SciELO
  Similares em
SciELO
Similares em
SciELO 
 Permalink
1. Introduction
The recovery of residual oil by chemical methods accounts for approximately 11% of the worldwide production within the EOR methods [1]. The sweep of hydrocarbons with polymers, which modify the viscosity of water, plays an important role in the oil industry, where China is one of the first countries to use this technique and the only one that has reported oil recovery by chemical methods [2-5]. Y. Zhu stated that by the end of 2011, in the Daqing oilfield, the oil production was increased by approximately 13% using polymer injection with respect to water sweep [4]. Worldwide, the reported percentages of injected porous volumes (PVs) are between 10 and 50% of PV [6,7].
The injection of polymer-flooding agents (PFAs) can improve the oil recovery efficiency, which is of strategic importance in the exploitation of offshore fields, where platform limitations regarding fresh water and space are common features, or for oil fields with high temperatures and/or high salinity congenital water [5,8-10]. On the other hand, well-studied polymers such as polyacrylamides present thermal stability under harsh conditions, and that is why the development of new PFAs is the current topic for many chemical companies and the academic field. The new PFAs that are released into the market must be tested before being used to guarantee their viability; for this purpose, several types of studies are being carried out in unconsolidated porous media and rock cores through numerical simulations, however, in many cases, in order to understand the firing process mechanism, visual models such as glass cells are used [11].
The flow analysis in the porous medium through the use of Hele-Shaw cells allows the detailed observation of the oil displacement process [12-19]. Hele-Shaw cells are two-dimensional tools that help observe transport and displacement phenomena, and for this purpose, oil, mineral oil, silicone oil [12], etc. can be used. The visual models with macro or microfluidic cells featuring interconnected channels can be useful for designing an optimal oil recovery strategy and establishing variations in the injection speed and water saturation [13]. Hele-Shaw cells with rough surfaces offer a porous transparent medium that allows the analysis of the oil sweep by water and identification of preferential paths in fluid-fluid displacement systems with high capillary number, which is dominated by wetting properties that do not allow uniform displacement [20].
The results of the oil displacement processes can be analyzed and matched with the computational simulations of porous media with multiphase flow for validating the transport phenomena in the oil-water-porous-medium systems [21-23]. In 2006, Behbahani et al. published results of simulations of two-dimensional water systems embedded in a heterogeneous porous medium displacing oil, comparing the simulation with experimental results [24]. Among the most reported software for predicting the displacements of immiscible liquids inside porous materials, COMSOL Multiphysics, ANSYS and STARS can be found. The COMSOL Multiphysics computer software is widely used in the simulation of physical phenomena, including flow in porous media under Darcy’s law [25] as well as in Hele-Shaw cells with different geometries, where branches of fluids with different viscosities are formed based on the Darcy mass conservation equations for flow in porous media and the effects of capillarity and imbibition in heterogeneous porous media can be described [26-29].
In the present work, a series of displacement experiments using the visual model in Hele-Shaw cells was conducted to provide an explanation to the following problems: 1) the effectiveness of water and polymer flooding (PF) in fractured media with a fracture parallel or perpendicular to the flow direction; 2) the comparison of the experimental results with unfractured porous media with multiphasic simulation by analysis of images and cumulative oil recovery by volumetric method; and 3) the visualization of the fronts formed by the difference in viscosities of the injected fluids and the effect of fractures on the front advance of the displacement fluid.
2. Experimental section
2.1. Oil and polymer solution
Crude oil was acquired from an oil field (13.53 mPa.s, and 0.8680 g/mL at 20°C, 31.2° API at 20°C). The decision to use this oil was made based on the fact that it is mainly derived from mature fields, and used to prepare the crude blend type for export remarketing. Distilled water was used as displacement fluid. The 3% polymer aqueous solution (18235 mPa.s, 18130 mm2/s and 1.0058 g/mL at 20°C) consisted of the polymer Flopaam SAV 225 (purchased from SNF Floerger) and distilled water. Viscosities were measured on an Anton Paar’s Stabinger Viscometer TM SVM 3000.
2.2. Construction of the Hele-Shaw cells
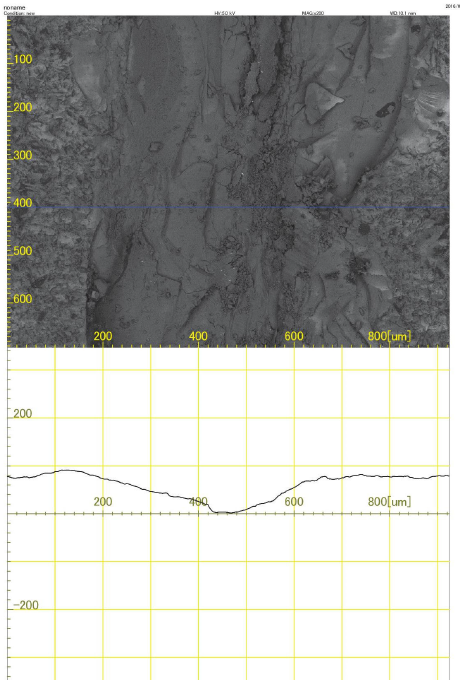
For the construction of the Hele-Shaw cells (Fig. 1), two glass plates frosted on one of their faces were used and placed parallel to each other without any separation. The cell dimensions were 0.006 × 0.20 × 0.39 m. Each cell had two perforations, one of 0.001 m in diameter “injection well” and another of 0.004 m in diameter “production well”, which were located at 0.03 m from one of the vertices of each plate. The perforations were oriented diagonally in order to simulate the injection (top plate) and extraction (bottom plate) wells. Before constructing the cell, the glass plates went through a washing treatment: first, the plates were washed with neutral liquid soap and deionized water; afterwards, they were left to rest for 24 h in an aqueous nitric acid (3%) solution, being washed once again with deionized water, isopropanol and finally with acetone in order to be sure that no impurities were left on the glass surfaces, which could affect either the saturation or displacement processes. Once the washing process finished, the cell was constructed by gluing the glass plates with silicone glue, and a single layer of transparent cellulose tape was stuck along the edges of the bottom plate, which served as a spacer with thickness of approximately 0.1 mm. Three types of Hele-Shaw cells (Simple Porous Medium (SPM), Cracked Parallel Porous Medium (PAM), and Cracked Perpendicular Porous Medium (PEM)) were used in this work (Fig. 2). In the PAM cell, the notching was performed, localized at 0.05 m from the “production well” in only one of the two glass plates that made up the cell. In the PEM cell, the notching was done and localized at equidistant distance perpendicular to the “production well”. The treatment of the cracks in the glass plates was carried out by means of a commercial glass cutter, where an approximate 80 um-depth was selected so that all the fractures were the same in all the cells (Fig. 5). The pore volume was 9.2 mL according to the weighing method. All the experiments were carried out by using plates coming from the same glass sheet in order to ensure the reproducibility of the experiments. The morphology of the glass plate samples was analyzed by scanning electron microscopy (SEM) using a JEOL-JSM-6300 microscope equipped with an energy-dispersive X-ray spectroscopy (EDS) module.
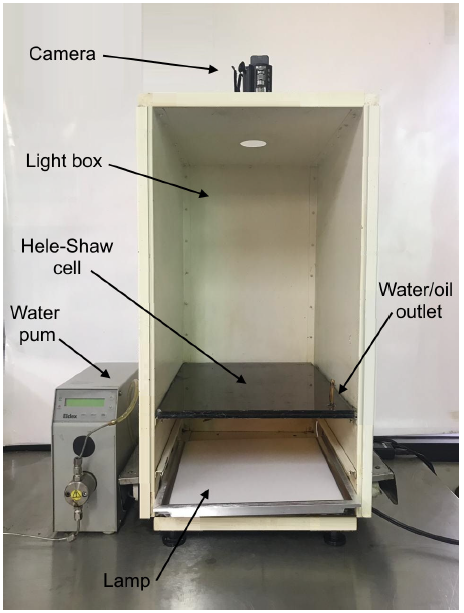
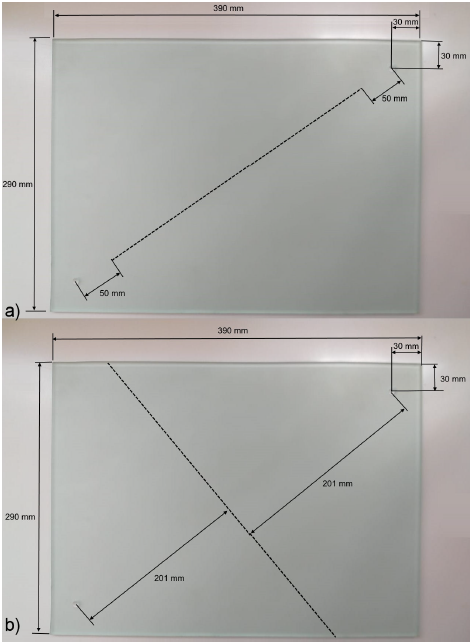
Figure 2 Cracked Porous Media in the Hele-Shaw cells: (a) Cracked Parallel Porous Medium (PAM) and (b) Cracked Perpendicular Porous Medium (PEM).
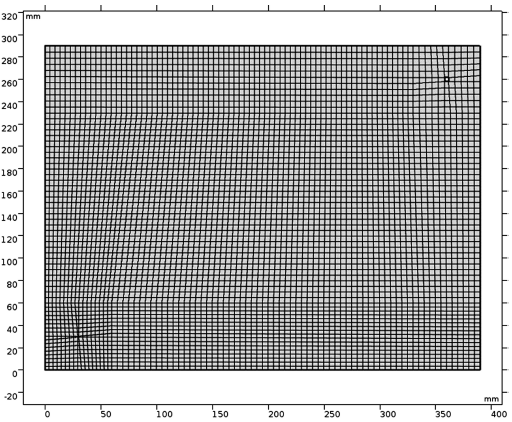
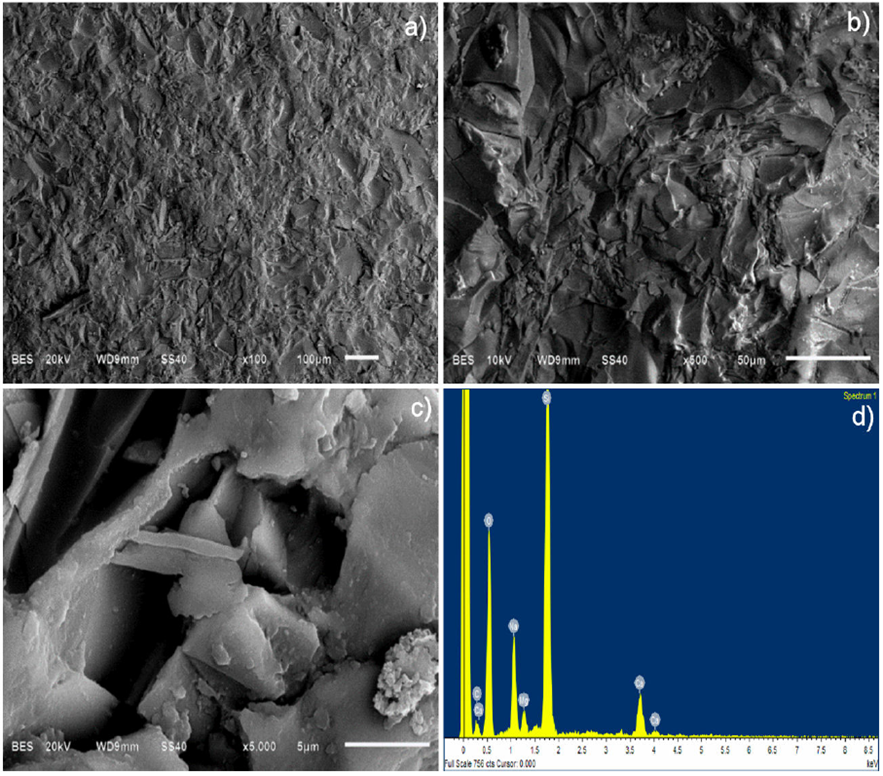
Figure 4 SEM images and EDS analysis of glass surfaces: (a) the increase 100, (b) the increase 500, (c) the increase 5000 (d) EDS analysis.
2.3. Oil cell saturation
The cell saturation was done with oil, which was introduced through the “production well” perforation by means of a positive displacement pump by Eldex. It was considered that the cell was correctly saturated when no air bubbles were observed naturally inside after the drainage process for 3 h, leaving 8 g of crude oil trapped between the glass plates. The cell saturation and the displacement tests were carried out in a room with controlled temperature at 20°C.
2.4. Injection of water and polymeric solution
To inject water into the cell, a positive displacement pump by Eldex was used, which was connected to the cell through polyurethane tubing by Festo to the injection perforation. The injection flow rates were kept at a constant inlet flow rate of 0.5 mL/min at 20°C, where the calculated cumulative oil recovery was used as the criterion for the recovery efficiency. The injection experiments of water (for a total time of 180 min of injection) and polymer were performed in triplicate for each porous medium, where after 120 min of waterflooding (WF), the slug consisted of approximately 0.3 PV (2.5 mL) of polymer solution (3%), which was injected to the cell and the WF process was resumed immediately. For the oil recovery quantification, the recovered oil was weighed by using an analytical balance. It is worth emphasizing that all the experiments were carried out in triplicate.
2.5. Image capture
Each cell was placed inside a dark chamber to be protected from external glare and avoid making no-swept-area quantification mistakes. The chamber had 0.35 × 0.45 × 0.50 m dimensions and an illumination system at the bottom in order to provide better contrast, sharpness and image capture quality. The tracking of the oil sweeping process with water and water plus surfactant was carried out by using a Canon Powershot G12 camera capable of recording high quality videos. The camera was placed at an upper opening of the dark chamber. Once the tests were finished, each recorded video was divided into 30-second frames. The image-treatment analysis was done by using the software IMAQ Vision Builder. The grey-scale images were segmented into black and white.
3. Theoretical background of the computational simulation models
The displacement process was supported by the continuous simulation model using the COMSOL Multiphysics computational software according to our experimental tests. The parameters that were fed for starting the simulation were governed by Eqs. (1-4) of the matrix and fluid properties:
At the initial time (t = 0) the fluid saturation two (s 2) is defined as s 2 = 1 - s 1, and pressure of porous medium is the capillary pressure and the saturation of fluid one is s 1 = 0. The cell edges are without fluid and are defined by -n·ρu = 0. The velocity at the input is defined by -n·ρu = (s 1 ρ 1 + s 2 ρ 2)u 0 and the input saturation of fluid one is s 1 = 1. Finally, at the system output, the atmospheric pressure was taken as a reference.
The parameters used in the computational simulation of the physical phenomenon of forced imbibition inside a Hele-Shaw cell can be divided into two types: 1) constant parameters and 2) variable parameters [26,30,31].
The constant simulation parameters by the analysis method of finite elements that do not change before or after the PF are the following:
a) The cell geometry with length (l) = 0.39 m and width (h) = 0.29) m, with a pair of holes (input and output) at 0.03 m of distance from the closest edges (superior right corner and inferior left corner, respectively), and the space between plates is 0.1 mm.
b) Without fluid flux at the far edges.
c) Physical properties of the embedded oil such as dynamic viscosity and density, μ 2 = 13.53 mPa.s and ρ 2 = 868 kg/m3, respectively, do not change either.
d) The temperature is kept constant at 20°C.
e) Porous medium physical properties such as porosity φ = 0.8 and permeability k = 1 × 10-16 m2 were calculated based on their morphology and did not change during the computational simulation.
f) Experimental initial conditions such as t = 0, where the cell is saturated with oil s 2 = 1 and water s 1 = 1, with inlet velocity u 0 = 0.0106 m/s and output atmospheric pressure, which corresponds to atmospheric pressure.
g) The computational simulation conditions set by the computer software were 5144 elements with a mapping mesh for fluid dynamic problems and a study fixed interval from 0 to 180 min with results every minute (Fig. 3). To keep homogeneity in the cell meshing, type and quantity of elements of which the mesh was composed, the software mapping of fluid dynamic problems was employed along with a previous division of the CAD geometry to control the meshing close to injection and production wells (perforations).
h) The k r1 and k r2 parameters, which are dimensionless, were determined experimentally as 0.2 and 0.9, respectively.
All the parameters mentioned above are kept constant during the cell simulation. The variable simulation parameters change for the subsequent studies of the study step:
a) The initial pressure system for the second study step corresponds to the final pressure system of the first study step, which is after WF.
b) The initial oil-water saturation during the steps after the first step of the study.
c) Polymer solution density ρ1 and viscosity μ 1, the initial pressure p c and saturation of fluid 2 (which is embedded) s 2, which are taken from the previous study step.
4. Results and discussion
4.1. Glass surface analysis
Figure 4 shows the micrographs of the frosted glass surface of SPM before the oil saturation process. SEM is one of the most powerful tools for observing the surface morphology as it provides a useful means of characterizing the substrate microstructure. The micrographs revealed that the surface morphology was seriously damaged, in which edges or paths that can form the porous medium are appreciated and the variety of microstructures formed due to the frosting process can also be seen.
The EDS of the glass plates showed that the main present elements were carbon (14.60 %), silicon (21.86 %) and oxygen (50.93 %), although they were also composed by lower amounts of sodium, calcium and magnesium.
The glass surface shows scratches after notching and the roughness was measured, showing less than 80 μm while the roughness of not-notched glass oscillated around 10 μm. The width of the fracture was about 400 μm (Fig. 5), whereby the fracture is approximately only 0.1% of the porous cell volume. Therefore, it is possible to consider that the volume was constant during all the experiments; therefore, the saturation of the cells was carried out equally for all the porous media.
4.2. Waterflooding and polymer flooding
Table I shows the experiment matrix and the comparison of the recovered percentage between the secondary recovery by WF and tertiary recovery by PF in the Hele-Shaw cell, which was initially saturated with oil. It was decided to perform the injection of the polymer solution after 120 min of WF (almost 6 PV of water injection) for two reasons: 1) the rate of oil production is decreased after 120 min for all the cell types; 2) at the time close to 120 min, cumulative oil production by the fractured medium PAM equals the oil production by homogenous medium SPM. The results show that the type of porous medium (SPM, PAM and PEM) does somewhat of a difference on the oil recovery, which is logical when considering that the fractured medium represents only 0.1 % of PV cell.
Table I Oil recovery results in Hele-Shaw cell tests.
| Cell type | Sor WF 120 min, %∗ | Recovery, % | ||||
| WF 120 min | WF 180 min | PF** | Total (T) | T-WF120 min /Sor WF 120 min | ||
| SPM | 60.67 | 39.33 | 43.3 | 11.84 | 51.17 | 19.52 |
| 60.57 | 39.43 | 43.86 | 12.24 | 51.67 | 20.21 | |
| 60 | 40 | 44.13 | 12.14 | 52.14 | 20.23 | |
| PAM | 60.59 | 39.41 | 47.2 | 13.22 | 52.63 | 21.81 |
| 60.16 | 39.84 | 46.84 | 12.32 | 52.16 | 20.48 | |
| 59.77 | 40.23 | 47.99 | 12.94 | 53.17 | 21.64 | |
| PEM | 58.09 | 41.91 | 49.7 | 13.88 | 55.79 | 23.89 |
| 57.63 | 42.37 | 50.23 | 13.93 | 56.3 | 24.16 | |
| 56.72 | 43.28 | 50.88 | 13.08 | 56.36 | 23.05 | |
*Sor is the residual saturation after WF; ** ≈ 0.3 PV corresponding to 2.5 mL of 3 % of polymer solution injected after 120 min of WF; Soi is the initial saturation before WF was 100 %.
Table I shows that the oil recovery by WF for the fractured media is higher than the one in a homogeneous medium, which is due to the consideration that there is no residual oil saturation in the fractures. On the other hand, Fig. 6 shows that in both the WF oil recovery and PF oil recovery, the matrix with fracture parallel to the flow direction presents a delay in the oil production process with respect to the homogeneous matrix and the one with perpendicular fracture, which implies that the water/polymer flow is channeled through the fracture, which is in turn an undesirable condition in the oil recovery, for the water/polymer injection periods are increased along with the production costs. In addition, the PAM presented the lowest gap among the WF results of 180 min and the oil recovery including the PF, because the part corresponding to the polymeric solution flows through the fracture. The highest recovery levels during the WF and PF processes were reached for a matrix with fracture perpendicular to the flow direction. By carrying out the normalization of the tertiary recovery using a polymer and adjusting Sor 120 min at 100%, it was found that better results were obtained by using a polymeric solution in a medium with perpendicular fracture, reaching up to 24% of additional oil recovery, followed by porous media with parallel fracture and homogeneous with approximately 20% of additional recovery. In addition, the SPM presented the highest gap among the WF results of 180 min and the total recovery including the PF part by comparing with other porous media; then, the injection of polymeric solution after WF, when the oil production gets close to null, could exert a major positive effect with respect to fractured porous media.
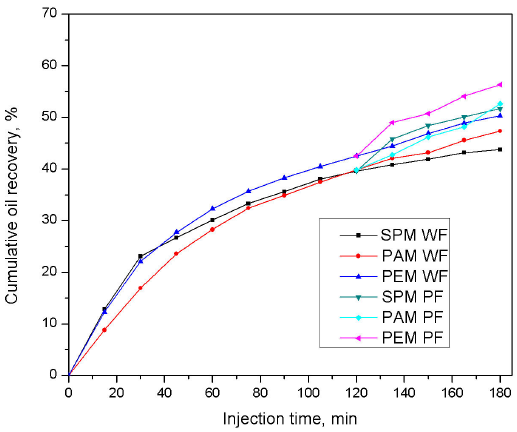
Figure 6 Average cumulative oil recovery vs injection time for the experimental results obtained by using WF and PF in Hele-Shaw cells.
The WF and PF advance fronts are shown in Fig. 7, where the use of Hele-Shaw cells as a physical reservoir model mechanism helps visualize areas not swept by water. In the formation of preferential water paths, PAM and PEM cells show changes in the swept areas due to the fact that capillary forces allow water to interact quickly with the cracks. The cracks only affect the initial mobility of water and oil during the first 15 min (0.8 PV) of injection, but there is no significant oil recovery change. Regardless of whether there is a crack or not, the ramifications formed on the displacement front by water in the medium saturated with oil are mainly due to the ratio of viscosities between oil and water. The viscosity difference defines the oil mobility compared to the fluid that sweeps it [32, 33]; for this reason, the increase in viscosity can be one of the main factors from which one can have control of the recovery of hydrocarbons. In Fig. 7, it is observed that the secondary recovery of oil by WF peaked the area sweep at 120 min, which enabled us to estimate that it was the best moment to start the PF, although a significant volume of untouched oil was left, particularly at the corner region. The mentioned polymer, when solubilized in water, increased the viscosity and when injected, it formed a more stable sweeping front with respect to oil, changing the sweep zones and thus achieving a change in the mobility of water and oil. At the 125 min of total displacement, which included 5 min of polymer injection into the cell (≈ 0.3 PV), it began to make a uniform radial sweep and uniform displacement front for all the porous media, achieving additional recovery of remaining oil. After immediate resumption of water injection, at 135 min, the unswept region of WF at the lowest left section of the cell was displaced, but the shape of the sweep zones and front were changed for each porous medium. For the SPM, the shape is still almost round and for the PAM, the shape looks more like a pear, because the polymer solution tries to flow through the parallel fracture, so for the PEM, the shape becomes rectangular with the upper right corner, which is copying the direction of the cell fracture. At 180 min, the end of the displacement test became evident, where the sweeping improvement is observed for all the porous media.
Figure 7 describes the profile control performance of PF, where the polymer solution carrying properties and shape of the oil displacement system and porous medium form. The polymer solution is continuously gathered in the high WF seepage channel and fractures, probably decreasing the speed of water in it, which has a specific effect on the displacement of crude oil in areas not previously swept by water, thus improving the swept volume of the displacement system.

4.3. Computational simulation
For the SPM, the computational simulation was proposed to predict the interfacial and capillary phenomena inside porous media and to validate the experimental results. The parameters that did not change in the simulation were porosity, permeability, cell geometry, quantity of embedded fluids, injection times, atmospheric pressure, and temperature. The bidimensional image results obtained during the experiment and computational simulation were compared by counting pixels, finding that the displaced fluid was similar in both cases , where the computational program found a solution singularity, the results of which are shown in Fig. 8.
The first step of the study consists of the secondary recovery parameters by WF with variable time from 0 to 120 min, where four main fingers can be observed in the zone close to the production well in the image of the experimentation and simulation. The results of the first study step become the initial conditions for the second study step from 120 to 125 min, when the polymer solution was injected. The results of the second study step become the initial conditions for the third study step from 125 to 180 min, which is the continuation of water injection as shown in Fig. 8.
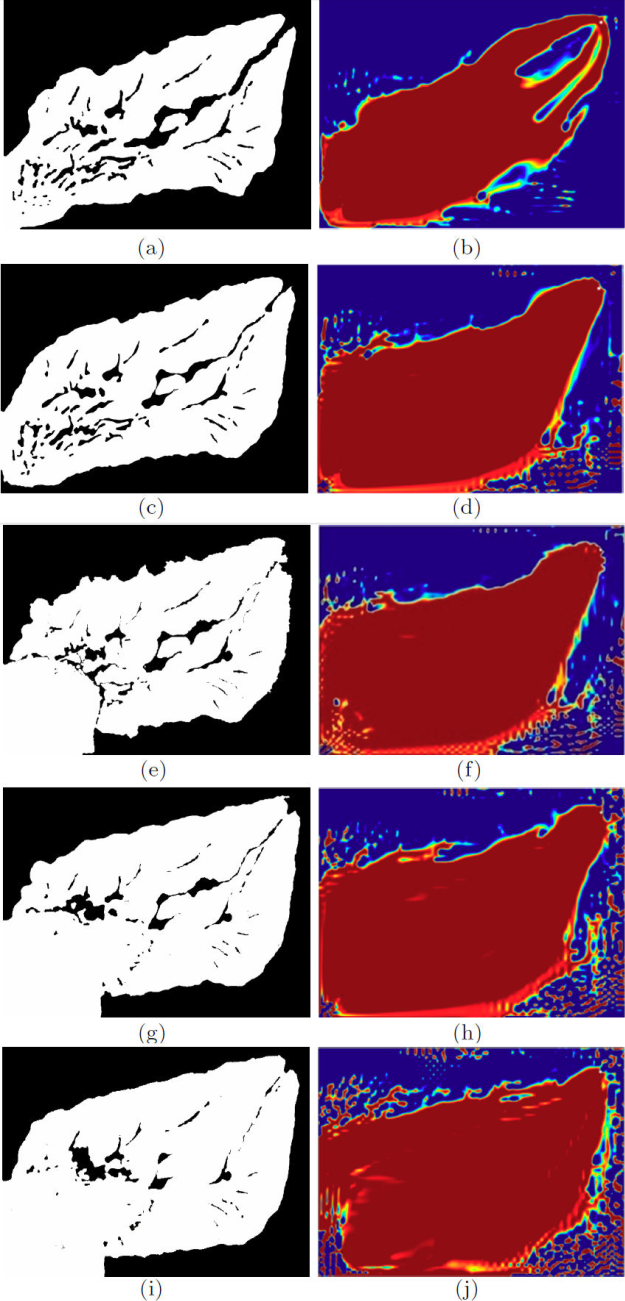
Figure 8 Images of the experimental displacement process (water in white, oil in black) in a Hele-Shaw cell for the SPM and computational simulation images (water in red, oil in blue) of oil swept by WF (60, 120 min) and PF (125 min), after resumption of WF (135 and 180 min).
Figure 9 shows the comparison between cumulative oil production calculated through the treatment of the images of the cell and produced crude volumes as well as the realized computational simulation curve. The deviation between the simulation and oil recovery by the image treatment method is less than 5 %, while this alteration is around 20 % compared with the data of the volumetric production of oil, which can be explained by the fact that at the time of treating the images in gray scale and transform them into a two-color system (white / black), the full saturation by water is assigned to the lighter parts while the darker parts are ascribed to the 100 % oil saturation.
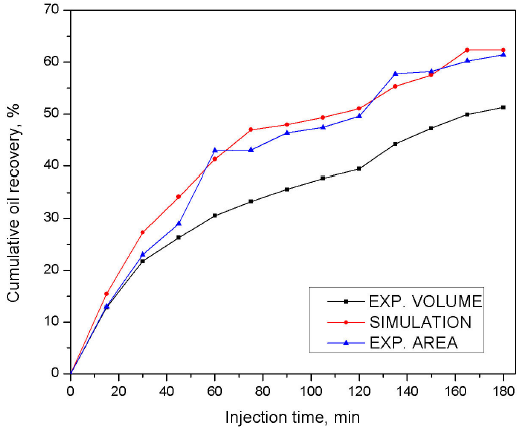
Figure 9 Cumulative recovery percentage for the SPM by experimental results in a Hele-Shaw cell calculated by oil volume production and swept area on the images and by computational simulation.
By taking into account the difference observed between the simulation and cumulative oil recovery data for the treatment of the images, correction factors of 1, 0.9, 0.8 and 0.7 were applied to adjust the analyzed simulation recovery curve (Fig. 10), where the best fitting of the experimental curve was the 0.8 simulation result curve [36,37], showing the same deviation of 20% as in the case of the calculation of oil production by the image method.
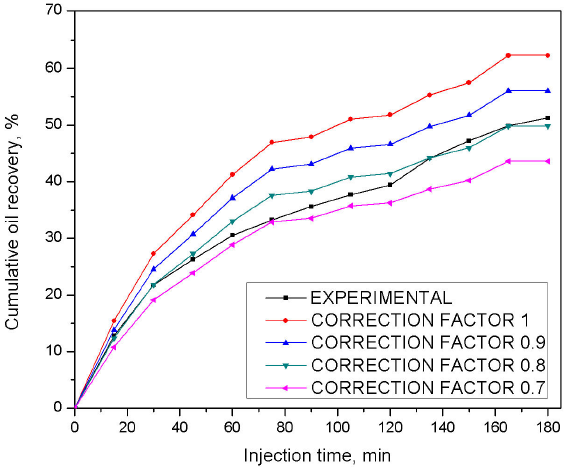
Figure 10 Cumulative recovery percentage for the SPM by experimental results in a Hele-Shaw cell and by computational simulation.
From these experiments, two mayor conclusions were elicited pertinent to PF for enhanced oil recovery: a) fractures parallel to the flow direction channel the water and polymer flow, which presents a delay in the oil production process with respect to other media, homogeneous and with perpendicular fracture; b) the homogeneous medium is the best candidate for additional recovery applications with PF after WF when the oil production reaches zero, although the production rate is lower than the one obtained with a porous medium with a fracture perpendicular to the flow direction.
5. Conclusion
In summary, the polymer injection after WF in a porous medium aligns the water advance front, impacting the additional oil recovery. The results show that the highest cumulative oil recovery during WF (reaching 50%) and PF (reaching 56%) was achieved for the medium with fracture perpendicular to the flow direction. In the medium with a fracture parallel to the flow direction, the oil mobilization presented a delay with respect to other media, although the final oil recovery (47% by WF and 52% by PF) is a bit higher than for the homogenous medium (44% by WF and 51% by PF). The advance of the polymer front in a homogeneous medium is not governed by the fracture, so the gap between WF and PF is greater by experimental results and computational simulation, which makes attractive the application of PF in these types of media; in addition, these results can be exploited to design a strategy to improve the efficiency of PF.

