


 text new page (beta)
 English (pdf)
 Article in xml format
 Article references
 Send this article by e-mail
 Cited by SciELO
  Similars in
SciELO
Similars in
SciELO 
 Permalink
1.Introduction
The on-going development of the electronics industry requires that the integrity of equipment that is sensitive to abrupt voltage changes be safe. A practical solution for that problem in home appliances and industrial equipment is the use of surge absorber devices, such as varistors. It is widely known that metal oxide varistors (MOVs) are advanced ceramics whose resistance is voltage-dependent. When an electric potential difference is applied to a MOV, its electrical behavior can change from a resistive-state into a conductor-state at the same time that the voltage reaches a specific value (known as the breakdown voltage). This voltage-dependence is also called non-linear electrical behavior 1. Since MOVs are commonly used in parallel with electrical circuits, their non-linear behavior enables the clamping down of surges if the nominal voltage is under the breakdown voltage and thus offering a safe way out when the said limit is overcome. In recent years, MOVs have been used to fabricate sophisticated surge arrester devices or even as current sensors 2.
The formation of potential barriers is required to enable the non-linear properties in ceramic materials 3, therefore, it becomes imperative to obtain a highly dense material. The grain size, the constituent phases, and the intrinsic grain conductivity also play an important role 1. Varistor systems based on SnO2 have been widely studied as an alternative for ZnO. The main advantages of the use of SnO2 over ZnO are: higher resistance to degradation and single-phase structure 4. The microstructure of sintered pure SnO2 exhibits high porosity and grains linked by the necking effect due to an evaporation-condensation mechanism 5. Density can be increased by the creation of oxygen vacancies which promote the mass transport from inside the grains to the grain boundaries 6. To achieve the aforementioned task, several researches have used densifying agents such as CaO 7 , CuO 8, ZnO 9, and Co3O410, to name just a few. The accumulation of defects at the grain boundaries due to the dopant inclusion leads to a charge concentration and thus the formation of potential barriers 11.
During the last few years, a new branch of electroceramics that involves nanotechnology has emerged 12,13. This not only enables the possibility of fabricating more complex and advanced devices, but it also improves the features of the actual materials and their processing. In particular, for SnO2 based varistors, a growing body of literature has been published reporting results of nanostructured precursors used to enhance densification 12-14. This work aims to evaluate and compare the performance of the micro and nanoparticles of Co3O4 as a densifier dopant. Microstructural development, as well as the non-ohmic electrical properties, are also discussed to establish a correlation with the particle size.
2.Experimental Procedure
In this work, SnO2, Co3O4 (50 nm and 5 μm particle size), Cr2O3, and Nb2O5 analytical grade starting materials (from Aldrich) were used. The molar composition of the investigated system was (99.9-X)% SnO2 - X% Co3O4 - 0.05% Cr2O3 - 0.05% Nb2O5, where X = 0.0, 0.5, 1.0, 2.0 and 4.0%. A high energy planetary ball mill (Pulverisette 7) was used to obtain a homogeneous powder mixture. A polypropylene vial of 50 cm3 inner volume was filled with the starting oxides, 15 ml of distilled water, and 180 agate balls of 5 mm diameter to obtain a slurry. Milling parameters were 300 rpm for 60 min. The planetary mill allows the use of a reversing function in such a way that the direction of rotation can be changed after a chosen period until the full cycle is completed. Therefore, this reversing function was used to enhance the homogeneity of the powder mixture.
After milling, the obtained slurry was dried at 80∘C for 4 h. The dried powders and 5% wt. of Polyvinyl alcohol, PVA, as a binder, were uniaxially pressed in the form of tablets (10.0 mm in diameter and 1.2 mm in thickness) at 176 MPa.
The tablets were sintered in an ambient atmosphere at 1350∘C for 1 h with a heating and cooling rate of 6∘C/min in a tube furnace (Nabertherm RHTC 80-230/15). Silver electrodes (SPI flash-dry silver paint) were applied on both faces of the ceramic sintered tablets before electrical characterization. Current-voltage measurements were taken using a High Voltage Measure Unit (Keithley 2657A). The nonlinear coefficient α can be calculated using the relation:
where E 1 and E 2 are the applied electric fields related to the current densities J 1 = 1 mAcm−2 and J 2 = 10 mAcm−2, respectively. Breakdown voltage E B is measured at 1 mAcm−1 while J and E are calculated using i/s and V/t, where i is the electric current, s is the area of the silver electrode, and t is the thickness of the tested sample.
Measurements to calculate the density of sintered samples were made using the Archimedes’ method and compared to the theoretical density obtained from the rule of mixtures. X-ray diffraction technique (XRD; PANalytical Empyrean model) was used to identify phases of samples under the following conditions: CuKα radiation (λ= 1.5406 Å) operated at 45 kV, 40 mA and a PIXel 1D detector in Bragg-Brentano geometry. The scans were performed in the 2θ range from 10 to 80∘ with a step scan of 0.016∘ and 10 s per step in a continuous mode. Grain size and morphology of the samples were characterized by scanning electron microscopy (SEM; model Nova Nano SEM 200, FEI). The mean grain size was calculated from SEM micrographs with the aid of an image analysis software (Image-Pro Plus), according to the ASTM-E112 standard procedure.
3.Results and discussion
It has been previously reported by the authors that tin oxide exhibits good thermal stability in the temperature range from ambient up to 1450∘C, where the sintering process of the reference sample takes place. The minimum weight loss observed (Fig. 1a) is a consequence of the evaporation of chemical water 15.

Thermograms corresponding to micro and nano-particles of Co3O4 (Figs. 1b and 1c) show two similar processes. For the micro-particle powder sample, there is an exothermic reaction between 50 and 250∘C caused by the evaporation of water absorbed by the compound, shown in Fig. 1b. The weight of the sample decreased by 0.06% during this process. Subsequently, the presence of an endothermic peak at 933∘C in the DTA curve and a weight loss of 6.57% is related to the formation of CoO from Co3O4, according to the following reaction:
On the other hand, the thermogram corresponding to the nano-particle powder of Co3O4 (Fig. 1c), shows a weight loss of 1.57%, due to the evaporation of water at a lower temperature than that from the micro particles. The formation of CoO is also carried out at a temperature of 933∘C, according to Eq. (2). A reduction in weight of 6.47% takes place at this temperature.
Thermograms from samples doped with micro and nano-particles of Co3O4 were also obtained (Figs. 2a and 2b) and compared. In general, both systems exhibit similar behavior: approximately 150∘C, an exothermic process caused by the evaporation of water in the mixture is observed. Subsequently, an endothermic peak related to the reduction of Co3O4 to CoO Eq. (2), and its interaction with SnO2 encourages the in-situ formation of the spinel phase Co2SnO4, which occurs at 945∘C when using micro-particles of Co3O4 and at 929∘C with nano-particles. This endothermic peak is not observed in the samples with 0.5%. However, as the concentration of Co3O4 increases, the intensity increases until reaching its maximum value for the sample with a concentration of 4.0%. The following equation shows the process:
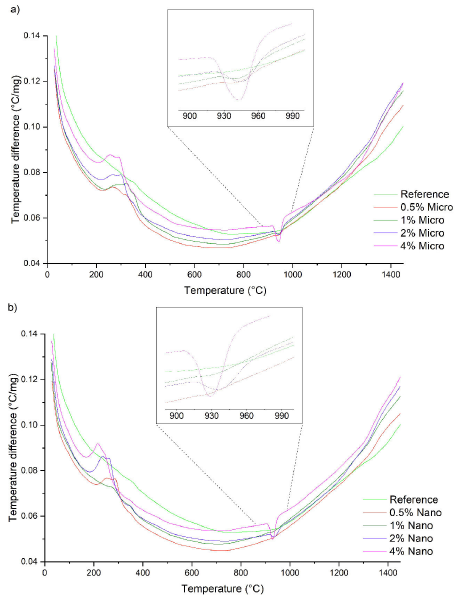
FIGURE 2 Thermograms from ceramic samples doped with a) Co3O4 micro-particles, and b) Co3O4 nano-particles.
Previous studies in the field 16,17 have presented results that are consistent with those obtained here regarding the formation of Co2SnO4 from the interaction between CoO and SnO2. However, the temperature at which the Co2SnO4 phase is formed during the thermal process has a difference of 16 degrees when using nano-particles instead of micro-particles of Co3O4. The authors suggest that this difference is due to the higher surface area of the nano-particles. It is assumed that the small amount of Cr2O3 and Nb2O5 have a negligible effect such that they do not produce any impact on the thermal behavior of the samples.
Diffractograms from samples doped with micro and nano-particles are presented in Fig. 3. The peaks shown match the diffraction pattern of the tetragonal rutile type SnO2 crystal structure (ICDD PDF 01-070-6995). Samples doped with 2.0 and 4.0 mol% of Co3O4 exhibit evidence of the spinel-type phase Co2SnO4 with a cubic crystalline structure. This is suggested by the pairing of the remaining peaks with the standard ICDD PDF 01-073-1617. The formation of this phase during sintering of cobalt oxide-doped varistors has been previously reported 10. Additionally, this data supports the results from thermogravimetric studies where the reduction of Co3O4 to CoO, leads to the formation of Co2SnO4.

FIGURE 3 Diffraction patterns from samples for reference sample and all compositions doped with a) Co3O4 micro-particles, and b) Co3O4 nano-particles.
From the Rietveld refinement (Table I), it was possible to determine that an increase of Co3O4 content leads to an increase in the formation of the spinel phase. Figure 4 shows the observed, calculated, and difference plots for the samples with the higher content of Co3O4. Additionally, it was also possible to determine that the use of nano-particles enhances the formation of the Co2SnO4 spinel phase. This can be explained by relating the surface free energy of both of the Co3O4 particle sizes used. A smaller particle size is related to higher superficial energy [18]. Based on the previous statement, it should be expected that shown reactions in Eqs. (2) and (3) are more spontaneous with the use of nano-particles rather than micro-particles, due to the high tendency of the nano-particles surface to bind their disjointed bonds.
TABLE I Weighted profile magnitude (R wp ), projected magnitude (Rexp), profile magnitude (R P ), optimum fit magnitude (x 2), and lattice constant.
| Sample | Phase | Lattice parameter (Å) | wt(%) | Rwp(%) | Rexp(%) | Rp(%) | X2 | |||
| Present | a | b | c | α=β=γ | ||||||
| Reference | SnO2 | 4.736 | 4.736 | 3.186 | 90 | 100 | 6.97 | 12.71 | 17.08 | 2.402 |
| 0.5% Co3O4 micro | SnO2 | 4.737 | 4.737 | 3.186 | 90 | 100 | 7.50 | 16.06 | 21.97 | 2.930 |
| 0.5% Co3O4 nano | SnO2 | 4.737 | 4.737 | 3.186 | 90 | 100 | 7.37 | 16.04 | 21.73 | 2.950 |
| 1% Co3O4 micro | SnO2 | 4.737 | 4.737 | 3.186 | 90 | 100 | 7.16 | 16.05 | 22.19 | 3.100 |
| 1% Co3O4 nano | SnO2 | 4.736 | 4.736 | 3.186 | 90 | 100 | 6.93 | 13.72 | 19.03 | 2.747 |
| 2% Co3O4 micro | SnO2 Co2SnO4 |
4.737 8.644 |
4.737 8.644 |
3.186 8.644 |
90 | 97.4 2.6 |
6.21 | 14.84 | 19.53 | 3.145 |
| 2% Co3O4 nano | SnO2 Co2SnO4 |
4.736 8.644 |
4.736 8.644 |
3.186 8.644 |
90 | 96.3 3.7 |
6.52 | 13.99 | 18.67 | 2.623 |
| 4% Co3O4 micro | SnO2 Co2SnO4 |
4.737 8.645 |
4.737 8.645 |
3.186 8.645 |
90 | 91.9 8.1 |
5.88 | 10.88 | 15.40 | 2.618 |
| 4% Co3O4 nano | SnO2 Co2SnO4 |
4.736 8.642 |
4.736 8.642 |
3.186 8.642 |
90 | 89.4 10.6 |
5.54 | 9.73 | 14.28 | 2.434 |
*Theoretical density obtained from the rule of mixtures
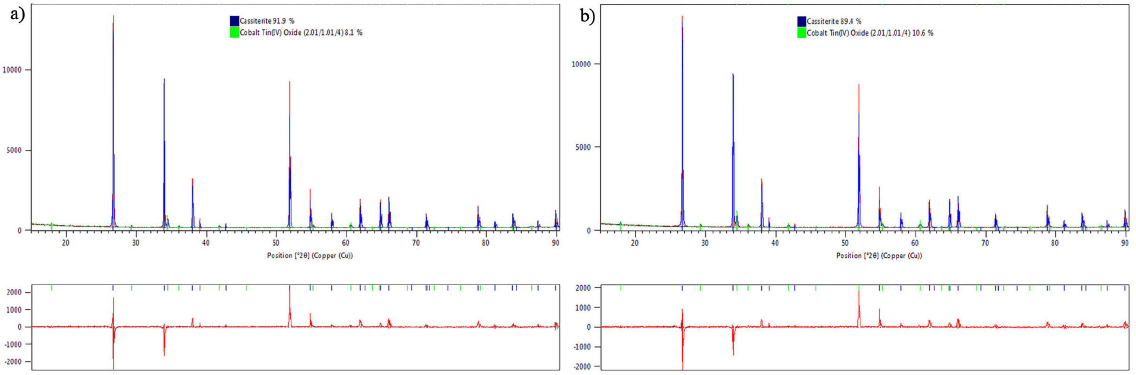
FIGURE 4 Profile refinement plot for samples with a) 4 mol% Co3O4 micro-particles, and b) 4 mol% Co3O4 nano-particles. Experimental data (red line) and calculated XRD pattern (blue line). The bottom plot shows the difference between experimental and calculated data, as well as the reflections of SnO2 and Co2SnO4 (vertical lines).
Equations (2) and (3) support the statement that any amount of Co3O4 will produce Co2SnO4 under the indicated conditions. However, the scope of the XRD technique does not allow the determination of the phases present within the samples in concentrations below 1.0 %. Therefore, the presence of the other oxides (Cr2O3 and Nb2O5) cannot be identified.
Figure 5 shows micrographs from the reference sample where only SnO2 particles are present, and it can be seen that small joints have formed between the particles due to the diffusion of oxygen when the sample is subjected to high temperatures. The highly porous structure shown is expected since the diffusion is not active enough for pure SnO2.

Micrographs from samples doped with micro and nano-particles of Co3O4 are shown in Fig. 6. Table II summarises, the grain size calculated from SEM images. From these results it can be established that doping with cobalt oxide, even in small concentrations of 0.5 mol% stimulates grain growth. Previous studies 19 have indicated that the densification process in SnO2-based materials is carried out when ions of Sn4+ are replaced by Co2+ in the crystal lattice during the sintering stage. The charge compensation, due to the difference in the valences of Sn and Co produces oxygen vacancies giving rise to its diffusion and therefore to grain growth. This mechanism can be described by the following expressions:

FIGURE 6 Micrographs from samples doped with a) 0.5, c) 1, e) 2, g) 4 mol% Co3O4 micro-particles, and b) 0.5, d) 1, f) 2, h) 4 mol% Co3O4 nano-particles.
In the varistors that were doped with micro-particles of Co3O4, a very slight increase in the average grain size is observed when going from 0.5 to 1.0 mol% (Figs. 6a and 6c). Later, a decrease of grain size is observed when 2.0 and 4.0 mol% are used, down to a value of 5.6 μm (Figs. 6e and 6g). On the other hand, when Co3O4 nano-particles were added, the average grain size was kept constant at a value of 7.9 μm for concentrations of 0.5 and 1.0% (Figs. 6b and 6d). As the nano-particle content increases, a decrease in grain size was observed for samples with concentrations of 2.0 and 4.0 mol%.
SEM images show that porosity in the samples is almost negligible, even with the lowest concentration of Co3O4. This feature is desirable in a varistor since porosity has a detrimental effect on electrical properties. Differences in grain size are noticeable and the non-homogeneous morphology in the grains is evident. Particularly, samples with 2.0 and 4.0 mol% Co3O4 have a visibly smaller grain type with sharp edges associated with the Co2SnO4 phase. The latter is confirmed by the elemental analysis performed on the sample doped with 4.0 mol% Co3O4 micro-particles (Fig. 7), where it is revealed that its composition contains a considerable amount of Co. At a concentration of 2.0 mol%, it is easy to find Co2SnO4 inside some SnO2 grains (Figs. 6e and 6f).

FIGURE 7 a) Micrograph from sample with 4 mol% Co3O4 microparticles; b) EDX spectra from region mark with (+) showing the presence of Co.
Another outcome from the micrographs is that as the amount of Co3O4 increases, so does the grain size of the Co2SnO4 phase, while it irregulary agglomerates at grain boundaries promoting pore formation. By comparing the use of micro and nano-particles of Co3O4, the formation of the Co2SnO4 phase is more evident in the sample doped with a concentration of 4.0 mol% using nano-particles. This difference is well observed in Figs. 5g and 5h, and results from the Rietveld refinement can support this claim. It is interesting to note that the formation of Co2SnO4 could be responsible for the abrupt decrease in the grain size of samples with 2.0 and 4.0% Co3O4.
Box plot graphs (Fig. 8) show the dispersion in density values from all the studied samples. The reference sample exhibits the lowest density value and widest dispersion, from 6.58 g cm−3 to 6.70 g cm−3. The graph in Fig. 8a represents the density data obtained from samples doped with Co3O4 nano-particles. Narrower boxes were obtained, meaning that high repeatability in density was achieved. For samples with 0.5, 1.0 and 2.0% mol concentrations, the median density values are 6.80, 6.79 and 6.82 g cm−3, respectively. However, a decrease in density occurred for the sample with 4.0 mol% concentration, down to 6.72 g cm−3.
On the contrary, when micro-particles of Co3O4 were used, the dispersion of the data was wider, as can be confirmed by the distance between the limits of the boxes with their respective median values (Fig. 8b). A slightly constant decrease in density is observed for samples with 0.5, 1.0, and 2.0% mol concentration whose values are 6.80, 6.77, and 6.74 g cm−3, respectively. Once again, for samples with the highest concentration of 4 mol%, a decrease in density is evident, with a median value of 6.64 g cm−3. There is a noticeable difference in the repeatability of density values for ceramic samples doped with micro and nano-particles, the latter producing the lowest dispersion.

FIGURE 8 Density box plot from samples doped with a) Co3O4 nano-particles, and b) Co3O4 micro-particles.
Figure 9 presents the characteristic representation of J vs. E for all studied samples in which the non-linear behavior is obvious. A statistical analysis of the breakdown voltage and the non-linear coefficient is presented in Fig. 10.

FIGURE 9 Electrical properties J vs. E from samples doped with a)- d) Co3O4 micro-particles; e)-h) Co3O4 nano-particles; i) reference sample, and their corresponding repetition.

FIGURE 10 Breakdown electric field box plot from samples doped with a) Co3O4 nano-particles, and b) Co3O4 micro-particles. Non-linear coefficient box plot from samples doped with c) Co3O4 nano-particles, and d) Co3O4 micro-particles.
For samples doped with 0.5 and 1.0% mol of Co3O4 nano-particles, the median value of the breakdown voltage remained constant around 1200 V cm−1. Samples with the lowest concentration, which is 0.5 mol%, show good reproducibility around the aforementioned value. A considerably higher than normal Eb was recorded at 2980 V cm−1.
A progressive increase in breakdown voltage value is notable for samples with concentrations of 2.0 and 4.0% with median values of 1,647 and 2,386 V cm−1, respectively. For samples prepared with micro-particles of Co3O4, a different trend is observed. The lowest concentration of 0.5% of Co3O4 produces a median value of breakdown voltage of 2,536 V cm−1. Later, a decrease is observed, followed by a constant increase going through 1076, 2645 and 3758 V cm−1, for samples at concentrations of 1.0, 2.0 and 4.0%, respectively.
TABLE II Median value of contraction (γ), theoretical density (p t ) quantified density (p), relative density (p r ), remaining porosity (P), nonlinearity coefficient (α), electric field (E B ) and average grain size of sintered specimens.
| Sample | γ (%) |
pt (gcm3) |
p (gcm3) |
ptr (%) |
P (%) |
α | EB (V/cm) |
Grain size (μm) |
| Reference | 6.0 | 6.95 | 6.64 | 95.54 | 4.46 | |||
| 0.5% Co2SnO4 micro | 14.1 | 6.94 | 6.80 | 97.98 | 2.02 | 5 | 2536 | 6.7 |
| 0.5% Co2SnO4 nano | 14.0 | 6.94 | 6.80 | 97.98 | 2.02 | 2 | 1162 | 7.9 |
| 1% Co2SnO4 micro | 14.5 | 6.94 | 6.77 | 97.55 | 2.45 | 2 | 1076 | 7.9 |
| 1% Co2SnO4 nano | 14.8 | 6.94 | 6.79 | 97.84 | 2.16 | 3 | 1219 | 7.9 |
| 2% Co2SnO4 micro | 14.2 | 6.93 | 6.74 | 97.26 | 2.74 | 6 | 2645 | 6.7 |
| 2% Co2SnO4 nano | 14.1 | 6.93 | 6.82 | 98.41 | 1.59 | 2 | 1647 | 5.6 |
| 4% Co2SnO4 micro | 13.4 | 6.91 | 6.64 | 96.09 | 3.91 | 7 | 3758 | 5.6 |
| 4% Co2SnO4 nano | 14.0 | 6.91 | 6.72 | 97.25 | 2.75 | 3 | 2386 | 4.7 |
An interesting aspect to highlight is the fact that any increase or decrease in the mean values of breakdown voltage is consistent with the average grain size marked in red in the figures. This was an expected condition since the relationship between grain size and the value of the breakdown voltage is inversely proportional.
The α coefficient can be analyzed in the same way as the breakdown voltage, as shown in Fig. 10c and Fig. 10d. These figures represent the dispersion of the coefficients obtained for each of the concentrations and particle sizes.
The box that corresponds to the samples obtained with 0.5 mol% nano-particles of Co3O4 exhibits a median value of 3 and, as with the Eb analysis, there is an extreme value of 29 for one of the analyzed samples. For the concentrations of 1.0, 2.0 and 4.0 mol%, values are obtained with low dispersion (around 2).
The use of micro-particles of Co3O4 at a concentration of 0.5 mol% of Co3O4 enhances an increase of the α coefficient in comparison with the use of nano-particles, with a median value of 5, and a wide dispersion is obtained. Subsequently, with 1.0 mol%, the value of α decreases to 2 and low dispersion is observed. An increase of Co3O4 also causes a slight increase in the α coefficient, moving to values of 6 and 7 at concentrations of 2.0 and 4.0 mol%, respectively.
While the main function of some dopants is to behave as densifier agents, others improve the electrical properties by providing valence electrons or by generating potential barriers at the grain boundaries. A homogeneous dispersion of dopants over the entire volume of the varistor is crucial to obtain the same electrical properties in any direction. In the existing literature, it has been reported that there is a strong relationship between the quality of connections between each of the SnO2 grains and the value of the coefficient α20,21. There are three main types of connections: ohmic, non-ohmic, and conductive. In addition to the above, large differences in the value of the potential barriers also affect the electrical conduction, and therefore the value of α. The scope of this work did not consider control over the dopants responsible for improving the electrical properties, thus the quality of the grain boundaries is uncertain. In the varistors obtained by nano-particles, the accumulation of the Co2SnO4 phase in the grain boundaries is evident, but this behavior is detrimental to obtaining high values in the α coefficient. In contrast, when micro-particles of Co3O4 are used, and the amounts of Co2SnO4 are smaller, the value of the α coefficient is increased.
4.Conclusions
SnO2-based varistors were successfully produce with the use of Co3O4 micro and nano-particles. By comparing the systems prepared with micro and nano-particles of Co3O4, the densification repeatability attribute was improved using nano-particles. The formation of the spinel phase Co2SnO4 was obtained at 16∘C lower with the use of nano-particles than with micro-particles. The maximum value of grain size was obtained through the addition of 0.5 and 1.0 mol% of Co3O4 nano-particles. The ceramic samples with Co3O4 nano-particles exhibit promising electrical properties. In order to confirm this assertion, further research will be performed to improve the non-linear behavior.

