1. Introduction
The electrical conductivity and dielectric constant are the prominent properties of the solids which provide important information regarding the conduction mechanism. The polymer nano-composites having good dielectric properties are nowadays exploited as excellent functional materials for electrical insulation applications. Therefore the term "nano-dielectrics" becoming more popular in the research field of nano-polymers. The technology of addition of fillers or dopants to polymers and/or other solid materials to enhance a particular dielectric property has been in existence since long and many researchers are doing so but the effect of filler size or dopant size on the dielectric property of the polymer composites has not been studied so far [1-3].
As far as the dielectric properties of the solids are concerned the behavior under alternating current is important to understand the structure. Today polyaromatic polymers such as polypyrrole, polyaniline, etc., have received great attention due to their versatile and unique properties. A special attention has been given towards conductive polymers as mentioned above [4]. This is because of amorphous or semicrystalline or polycrystalline structure, flexibility, heat sensitivity and especially the change in the electrical conductivity after addition of inorganic materials or dopants. The conducting polymers polyaniline (PAni) and polypyrrole can be prepared very easily and they are environmentally stable. Especially PAni is the most attractive conductive polymer because of its low cost, high environmental stability, good electrical conductivity and its potential applications in molecular electronics as well as in electromagnetic devices, electromagnetic interference suppression, cell separation, enzyme immunoas-say and drug targeting [5-10]. Moreover, it is cost effective, easy preparation, environmentally stable, eco-friendliness, exploitation for device applications and longevity is responsible for its versatile nature [11-13].
Because of high electrical conductivity and high dielectric loss of emerlidine and/or composite of PAni, it is useful as microwave absorbing material [14-18], not only this, the versatility increases when it is used in nano form as composite. The electromagnetic shielding can easily be done using PAni nano composite when it is tuned for particular property such as EM wave absorption [19-23]. The conducting polyaniline is found to be better material for fabrication of microstrip monopole antenna for broad band applications. The polyaniline antenna is designed for a centre frequency of 6.8 GHz by Pushkaran et al. [34].
Looking to the most important application point of view, it has been decided to study the behavior of PAni-SnO2 composite at microwave frequencies using Time Domain Reflec-tometry (TDR) at various temperatures as mentioned in experimental part.
2. Theory
The electrical conductivity of conducting polymer composites can be further increased with the addition of conducting fillers/dopants. It is seen that the composites undergo an metal-insulator transition at a certain filler concentration, called as the percolation threshold. In composites or any type of materials, the permittivity is given by the well-known equation
where ε' and ε'' are the real and imaginary parts of the dielectric permittivity.
Instead of AC conductivity, the permittivity is normally used to describe by the dielectric properties. The behavior of the composite is altogether different when it is exposed to very high frequency instead of low frequency. It is reported that the microwave permittivity is found to exhibit smooth frequency-dependence [24-25]. In this case, the properties of the composites are very consistent with the percolation theory, which depends on the empirical percolation threshold [26-27]. The least concentration at which a composite with conductive inclusions is capable of conducting direct current is called percolation threshold. For permittivity (ε) of the composite comprising conductive inclusions and a lossless dielectric host matrix of permittivity, percolation theory predicts a power dependence on the frequency (ω or f)
where ε' and ε'' are the dielectric constant and dielectric loss respectively. ωc, is the critical frequency and x and y are the critical exponents.
2.1. Debye relaxation
The dynamic behavior for the polarization relaxation can be probed equivalently in both time an frequency domain. In the time domain, one usually measures the change in polarization with time. The polarization follows the oscillation of the electric field and electric field orientation depends on time with a frequency of microwaves. The torque exercised by the electric field induces rotation of polar molecules but they cannot always orient at this rate. The motion of the particles will not be sufficiently rapid to sledge the time dependent polarization in equilibrium with the electric field at any moment. This delay between electromagnetic stimulation and molecular response is the origin of the dielectric loss.
It is known that the effect of filler size or dopant size on dielectric properties of polymer composites has not been studied so far. The history of dielectric mixing formulas is well ascertain by many famous scientists like Clausius, Massotti, Maxwell, Lorentz, Garnett, Debye, Cole, Davidson and so on but the Maxwell-Garnett rule explains the effect of size of dopant well. They discussed the two component system of mixture having spherical shape molecules. Also the treatment is discussed for isotropic and anisotropic materials [35].
The geometry and shape and size of dopant or filler in composite polymer change the microstructure of the material, in turn which affects the dielectric properties. The cause is that effective permittivity of the two components plays dominant role. The generalized mixing models such as Polder-van Santen formula, Coherent Potential formula, Unified mixing formula, Birchak formula, Looyange formula explains the dielectric properties. However all these formulas and any other formulas or suggested models based on the effective dielectric constant of the mixture or composite. Equally the conductivity of the dopant species and the main component in non-conducting matrix or vice versa are important since they related to the dielectric loss as well as skin depth, mean free path and skin effect. The mean free path of electrons in metals can be smaller than the characteristic size of nanoparticles which leads to the decrease in conductivity. This effect is incorporated in the Maxwell-Garnett mixing formulation when it is applicable to composite media containing conducting particles. The distinctive characteristics of the model are such as mixture should be isotropic, linear, nonparametric, small dopant size, randomly oriented different size of dopants and conducting fillers etc.
In Debye model the complex dielectric constant is given by equation
Where n is the refractive index, τ is the relaxation time and 𝜀s is the static permittivity. The refractive index is given by
The real and imaginary parts of the dielectric permittivity of Debye model are given by
and
The dielectric dispersion covers a wide range of frequencies and loss has maximum value as
The graphical representation of Debye theory can be obtained by plotting a) ε' and ε'' against frequency and b) the imaginary part ε'' against real part ε' called the Argand diagram. This can be obtained by eliminating ω from Eqs. (5) and (6), gives equation of the circle as
Which has radius of semicircle as
centered at
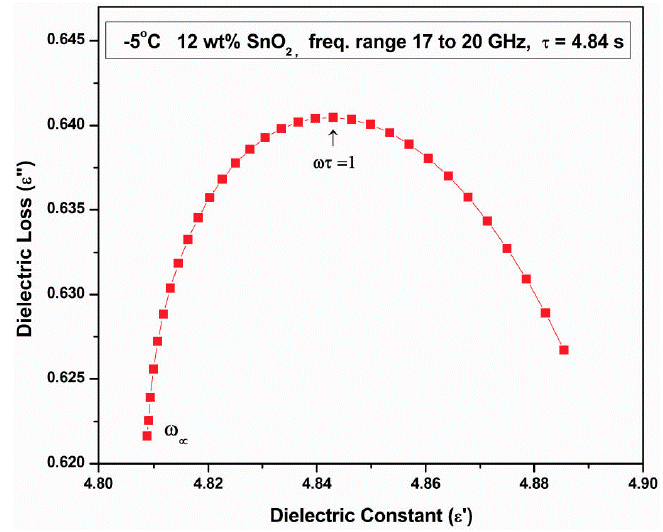
The top of the semicircle corresponds to ωτ = 1 .
The shape of the semicircle is different for different materials. For the conductive material the semicircle departs from Debye semicircle. The deviation from Argand's plot represents continuous distribution of relaxation time. Instead of single, polymers have broader dispersion curve and maximum loss. The permanent dipole moment is not aligned with the long molecular axis. Such type of behavior can be explained by Cole-Cole model. Hence the Debye formula is modified as
Above equation represents the semicircle. The circle has center below the axis represented by 'h' The value of 'h' increases with decreasing chain length indicates the symmetrical distribution of relaxation time. If the circular arc is not symmetrical then the plot could be explained by Cole-Davidson model.
Where α, = 1 for a symmetric diagram and α, → 1 for Debye model. The real and imaginary parts of dielectric permittivity describe by Eq. (1) can be analyzed according to the empirical Havriliak-Negami (HN) function [32] as
where ω = 2πf, ε0 denotes the vacuum permittivity, σ0 is the DC-conductivity, γ is the exponent factor, in most cases equal to 1, Δε is the difference between low and high frequency limits of ε' over the relaxation to which the HN function is applied and it is also proportional to the area below the curve of the ε'' relaxation peak; ε∞ denotes the high frequency limit of the unreleased value of permittivity; α and β are shape parameters and τ is the relaxation time. The characteristic relaxation time τ was taken at the position of the maximum dielectric loss for each relaxation process. The temperature dependence of the relaxation time is explored us ing a well-known Arrhenius Eq. (14) from which activation energies of relaxation processes was obtained.
Where τ0 is the relaxation time at very high temperature, Ea is the activation energy and kB is the Boltzman constant.
2.2. AC conductivity
In amorphous materials the AC conductivity is frequency and temperature dependent [28,29]. The total conductivity is σtotal=σαc+ σdc . The σαc occurs due to carrier motion within pair of sites. The well-known established equation for AC conductivity is σαcαωs i.e. σαc= Aωs.
Where A is the constant, ω is the angular frequency and s is the exponent generally having value unity.
The loss tangent is given by well known equation as
Where (σ + ωε '' ) is the effective conductivity of the medium. When the conductivity σ due to free charge is negligibly small, the effective conductivity is only because of electric polarization, hence it is reduced to
The microwave conductivity σ αc of the sample was determined from the following equation [25].
Where f is the microwave frequency equals to 0.01 GHz.
Considering the equation of AC conductivity, few theories have been proposed which are well established and explains the dielectric behavior of amorphous semi-conductors well. Generally when external electric field is applied the response of solid is often discussed in a way (i) the current in a solid associated with mobile charge carriers due to electrons called electronic conductive response and when it is due to ions called ionic conductive response and (ii) when the response is due to local displacement of bound charges occurs because of change in local dipole moment called dielectric response. There are various models of AC conductivity to explain the behavior of the material but Quantum mechanical tunneling model (QMT) is described here in brief.
2.3. Quantum mechanical tunneling (QMT) model
Pollak et al. (italics) [29,30,31] observed tunneling of charge carriers in crystalline silicon and then it is extended for amorphous semiconductors by Austin and Mott [30]. They proposed the conductivity by assuming the sides between which electron transfer occurs randomly distributed. With this consideration the formula for AC conductivity is suggested as
where 'C' is the numerical constant N(EF) is the density of electrons at Fermi level EF and Rω is the tunneling distance at a given frequency ω which is given by
The real part of the AC conductivity for QMT can be written as Eq. (18). Where τ0 is the characteristics relaxation time. α' is the electron wave function decay constant. The frequency exponent s' in this model is obtained from
Therefore, for the QMT model, σαc should be linearly dependent on temperature T, Eq. (18), but the exponent 's' is temperature independent and frequency dependent [12]. For typical values of the parameters τ0 = 10-13 s and ω/2π = 104 Hz, the value of s = 0.81 is obtained from Eq. (20).
3. Experimental
3.1. Preparation of nano SnO2 powder
The AR grade stannous chloride dihydrate (SnCl2.2H2O) (0.1 M) (2.256 g) was dissolved in 100 ml water. After complete dissolution, about 4 ml ammonia solution was added to form white gel precipitate which is allowed to settle for 12 h. Then it is filtered and washed with water 2-3 times. The obtained mixture is dried for 24 h at 70° C. Dried powder is crushed and heated at 600°C for 3-4 h.
3.2. Synthesis of polyaniline (PAni)
Aniline hydrochloride (0.2 M) was oxidized with ammonium peroxydisulfate (0.25 M) in aqueous medium. Aniline hydrochloride (purum, 2.59 g, 20 mmol) was dissolved in distilled water in a volumetric flask to make 50 ml solution and ammonium peroxydisulfate (purum, 5.71 g, 25 mol) was dissolved in water to make 50 ml solution. Both solutions were kept for 1 h at room temperature (291-297 K), then mixed in a beaker, briefly stirred, and left at rest to polymerize. Next day the PAni precipitate was collected on a filter paper, washed with 100 ml portions of 0.2 M HCl and similarly with acetone and then dried in air atmosphere.
3.3. Composite preparation
While polymerization of PAni, nano size SnO2 powder in appropriate proportion (10, 12, 15, 20, 25 wt.%) was added in the solution at room temperature to form a composite of PAni-SnO2.
3.4. Scanning electron microscopy (SEM)
The surface morphology of the samples is checked under Scanning electron microscope (Jeol, JSM 7200F model) at Department of Physics, Institute of Science, Mumbai.
3.5. Dielectric constant measurement
The powder samples of the composite were used as it is for the study of dielectric properties. Time Domain Reflectometer (TDR) Technique was used to study the dielectric relaxation of PAni-SnO2 composite. DSA8200 sampling mainframe along with the sampling module 80E08 has been used for the picoseconds time domain reflectometry (TDR). A repetitive fast rising voltage pulse with 18 ps incident rise time and 20 ps reflected pulse rise time was fed through coaxial line having 50 Ω impedance. The change in the step pulse after reflection from the end of line was monitored by sampling oscilloscope. Reflected pulses without sample R t (t) and with sample R x (t) were recorded in time window of 2 ns and digitized in 2000 points. These pulses were added [q(t) = R t (t)+R x (t)] and subtracted [p(t) = R t (t)-R x (t)] to obtain the time domain data which have been converted to frequency domain using Fourier Transformation. The readings were taken in the frequency range 0.01 to 20 GHz at various temperatures -5, 0, 5, 10, 15, 20 and 25°C. The measurements were carried out at School of Physical Science, Swami Ramanand Tirth Marathwada University, Nanded (India).
4. Results and discussion
4.1. SEM analysis
Figure 1a) and b) shows the Scanning electron microscopy images of pure PAni samples at X500 and X3000 magnifications respectively. From Fig. 1a), it is seen that a layered structure of different sizes of grains of 10 μm are formed. These grains are attached in layer form. The nano size crystallites of 10 to 20 nm are seen which are randomly distributed. The overall structure of PAni is amorphous. Figure 1b) shows the SEM image of pure nano SnO2 powder. The crystallites of 30 to 48 nm are seen in the image with pore size of 50 nm size. All these crystallites are randomly connected to each other. In 12 wt % SnO2 composite sample, the islands of PAni of different size having 2.48 nm size SnO2 crystallites are seen. There are some voids and spaces between islands which created pores in the sample. The shells of SnO2 nanoparticles are formed. The overall microstructure is amorphous and morphology is rough. The SnO2 nanoparticles are dispersed randomly on the islands of PAni (Fig. 1d) and e)).
4.2. Dielectric constant
The high dielectric constant and dissipation factor of polymer composites are necessary for exploitation of material for various applications such as electromagnetic interference (EMI) shielding, etc. Normally, a high dielectric constant of conducting polymer composites is obtained in the low frequency region and its value decreases in the high frequency region because the dipole moment cannot follow the reversing electric field.
Figure 2 shows the variation of real part of dielectric constant (ε') with frequency at different temperatures for 12 wt % SnO2 . The value of dielectric constant varies between 0.81 to 4.62 for all PAni-SnO2 composite samples in the frequency range 0.01 to 20 GHz at different temperatures viz. -5 to 25°C with step of 5°C. It is observed that the dielectric constant decreases up to the 1 GHz gradually and afterwards it decreases rapidly. The variation in dielectric constant is not appreciable up to 1 GHz. At higher frequency range, 17 to 20 GHz it shows peak in dielectric constant with frequency. Similar behavior is observed in 10, 20 and 25 wt.% of SnO2 samples (plots not shown). Also it is observed that the dielectric constant increases with increase in temperature. The orientation polarization is the main cause for decrease in dielectric constant with increasing frequency at microwave.
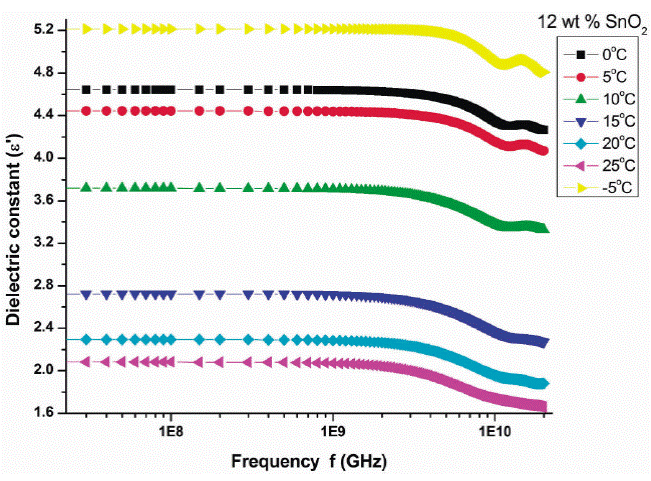
Figure 2 Variation of real part (ε') with frequency at different temperatures for 12 wt.% SnO2 composite.
In this frequency region the alternating accumulation of charges at the interfaces takes place.
4.3. Dielectric loss
Figure 3 shows the variation of dielectric loss (ε'') with frequency at different temperatures -5 to 25°C with step of 5°C for 12 wt.% SnO2 sample indicates two peaks for each temperature which clearly represents the dielectric relaxation of Cole-Cole type behavior. Similar behavior is observed in 10, 20 and 25 wt.% of the samples also (plots not shown).
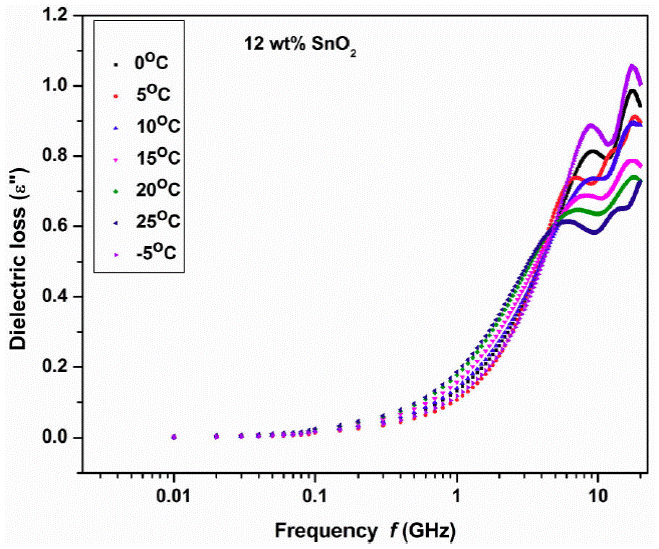
Figure 3 Variation of dielectric loss (imaginary part ε '' ) with frequency at different temperatures 12 wt.% SnO2 composite.
The complex dielectric plot (Fig. 4) is drawn between ε' and ε" in the frequency region 17 to 20 GHz at -5°C for 12 wt.% SnO2 sample. The whole frquency range is divided in two as a) 0.1 to 12.3 GHz (plot not shown) and b) 17 to 20 GHz. In this frquency range the plot shows semicircle. In whole frequency range two semicircles are observed: one in low frequency region and onether in high frequency region. Similar behaviour has been observed in other samples too. The two well defined regions can distingwish the contribution from different relaxations with relatively small difference in time constants which arises from two different dielectric responses. These are the contributions from electrodes, grain boundries and bulk polarization. But in our experiment, we have not used electrodes for sample measurements hence electrode polarization is completely absent. The grain boundries polarization generally occur at very low frequency of audio range, hence this is also absent. Thus bulk polarization and interfaces could contribute to the dielectric relaxations.
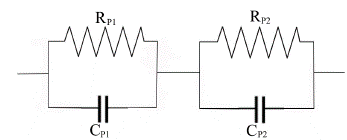
The complex dielectric plot which is half semicircle depressed at low frequency region is fitted to be two parallel RC circuits connected in series as RP1CP1 and RP2CP2i The electrode interface polarization called Maxwell-Wagner relaxation which is caused by the space charges. Thus interfacial polarization effect is dominent in such types of samples.
At microwave frequencies, the orientation of molecules along the field is not rapid, thereby causing the polarization and conductance component out of phase generates dielectric loss. In a long chain molecule solids the binding forces becomes dominant hence high dielectric loss.
It is known that, loss consists of loss due to conductance, interfacial polarization and dipole orientation or Debye loss factor. The conductance loss and interfacial polarization are significant at low frequencies only. Therefore the Debye loss is the only factor that is responsible at high frequency. In conducting polymers, interfacial polarization existed from polar and conductive regions, interfere the relaxation process. Thus dielectric loss (ε '' ) is related to the molecular polarization phenomenon like dipole rotating (Debye type), space charge relaxation (Maxwell-Wagner) and hopping of combined charges (Polarons, bipolarons).
The Cole-Cole semicircle represents the Debye relaxation process which necessarily required to know the EM wave attenuation. The single, two, three and so on semi-circle/s in Cole-Cole plot signifies the various Debye relaxation processes as pure Debye relaxation comes from itself i.esingle component (either filler or matrix), two components (filler and matrix) and interfacial polarization alongwith filler and matrix and so on. The interfacial polarization occurs between SnO2 nano particles and conducting matrix PAni. The multicomponent system always has the interfacial polarization at microwave frequencies which is an indication as good microwave absorber. When a system composed of conducting and non-conducting components then under alternating electric field the separation of mobile positive and negetive charges accumulates at the interfaces between different material cause interfacial polarization. Particles of nanometer size can induce more dipole and electron polarization due to increased defects, dipoles and dangling bonds. Because of nanostructure the more specific surface area is available as compared to their bulk counterparts and this would cause to generate interfacial polarization. If size of the filler/dopant is small, more interaction occurs between the SnO2 nanoparticles and conducting PAni matrix, leading to well known Maxwell-Wagner-Sillars polarization. The additional defects can acts as polarization centers which can generate polarization under microwaves. The schematic of interfacial polarization and QMT is shown in Fig. 5. The SEM images of SnO2 -PAni composies shows hollow shells and voids of nm size which enhance the more dipoles inside and outside of nanoparticles. It is a simple inhomogeneous composite having two dielectric constants as ε 1 and ε 2 for two media i.e SnO2 nanoparticles and only conducting PAni matrix would cause the interfacial polarization.
The dielectric relaxation time 'τ ' is represented by Eq. (14). The relaxation time 'τ' is calculated from the loss ε'' versus frequency plot, which is found to be of the order of pico second. Two relaxation peaks are observed indicating two types of molecules involved in the dielectric relaxation process. The phase of SnO2 and the PAni long chain molecules forms individual dipole moments due to different inertia of the molecules causes two different relaxation time. The exploration of Eq. (14) gives activation energy and the relaxation time τ 0 (Fig. 5). The plot of log τ against 1 /T is found to be linear (Fig. 5). The value of activation energy is found to be minimum for 12 wt. % of SnO2 sample and maximum for 15 wt. % of SnO2. Figure 6 shows the variation of τ 0 and τ 1 with composition of SnO2.
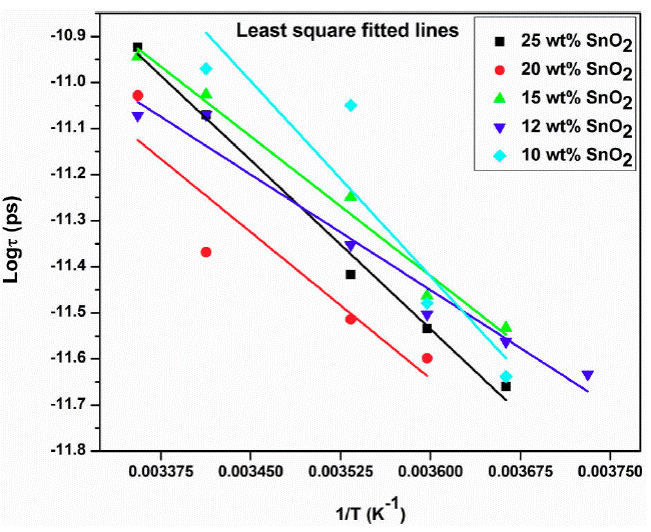
Figure 6 Variation of log of relaxation time τ and inverse of temperature (1/T) for 12 wt.% SnO2 composite.
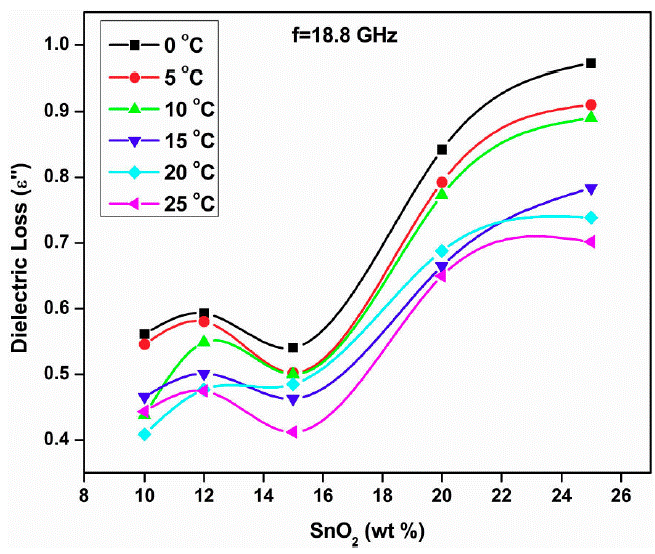
The τ 0 and τ 1 values are minium for 12 wt % sample and maximum for 15 wt. % sample. The minimum value of τ0 and τ1 at 12 wt. % indicate the smaller size of molecule which rotates immediately with the application of electric field. In both the plots peak is observed at 12 wt.% sample at 18.8 GHz for all temperatures except 0 and 15°C. The loading of SnO2 in polyaniline increases the dielectric constant and loss beyond 15 wt. % SnO2 (Fig. 7 and 8). This may be due to addition of SnO2, the DC conductivity of composite increases thereby increasing the dielectric constant and loss. The conductive matrix of PAni gets modified with loading of SnO2. The increment in the dielectric constant and loss at 12 wt. % of SnO2 is due to low resistance of the sample. The band gap of SnO2 is 3.8 eV and polyaniline is 2.8 eV. PAni is more conducting than SnO2. At this wt.% composite, in PAni shell, the electrons can tunnel across it when AC signal is applied. So the resistance of the composite becomes low. Further increase in SnO2 wt.% the multiple quantum well structure is formed where electrons in SnO2 particles have traversed to the subsequent SnO2 particles across deep trap states, causing the phenomenon of trapping and detrapping mechanisum. At microwaves i.e. x-band, the dielectric loss is due to free charge motion within the material and loading of SnO2 causes the improvement in the mobility of charge carriers.
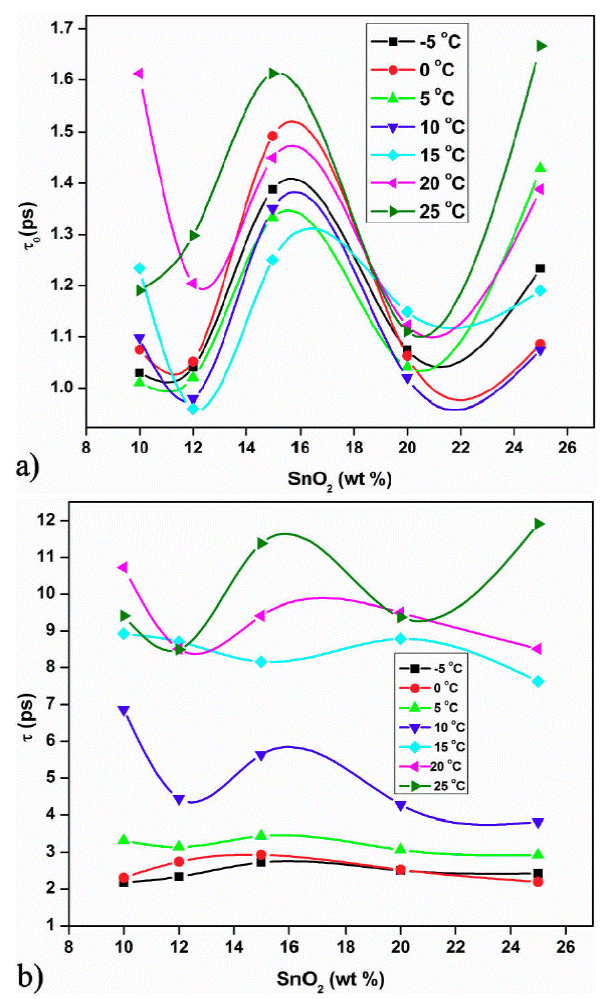
Figure 7 a) Variation of relaxation time τ 0 with wt. % of SnO2 composite. b) Variation of relaxation time τ 1 with wt. % of SnO2 composite.
4.4. AC conductivity
Figure 9 shows the graph of log 𝜎 ac versus 1/T for samples 10, 12, 15, 20 and 25 wt. % of SnO2. It is observed that AC-conductivity increases with increase in temperature linearly i.e. conductivity is temperature dependent and follows Arrhenius law. Also, it is composition dependent and 12 wt % SnO2 sample has maximum conductivity (Fig. 10).
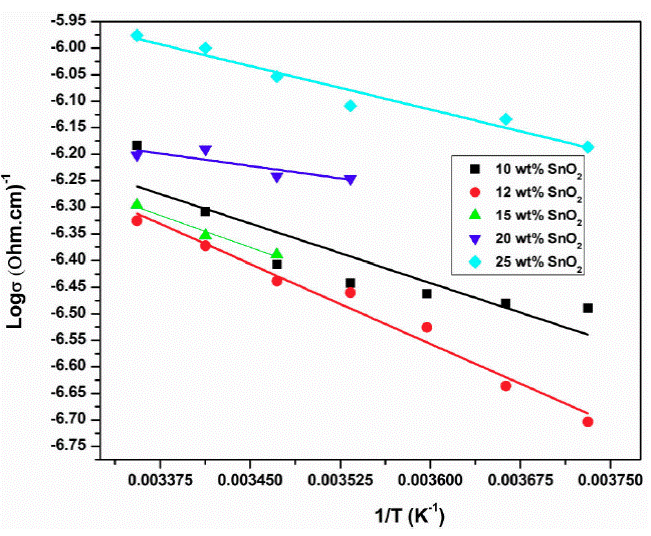
Figure 10 Plot of log 𝜎ac versus 1/T for samples 10, 12, 15, 20, 25 % of SnO2 at 0.01 GHz frequency.
The microwave conductivity (𝜎ac) is evaluated from the dielectric loss (ε''). Generally the AC-conductivity of the composites and amorphous materials especially amorphous materials may be explained on the basis of electron hopping among localised states. At lower frequencies, the measured AC conductivity has no true value due to electrodes such as electrode polarisation, air gap etc. but at high frequencies that is in microwave region these problems would be totally avoided due to electrode less measurement [26].
The AC-conductivity is directly related to the dielectric loss (ε'') and dielectric loss originates from the dipolar absorption dispersion in polymer composites. The conducting and nonconducting matrix plays an important role in the dielectric dispersion due to interface of two different media having different dielectric constants and conductivities, which may cause interfacial polarization. This ultimately depends on the graphical shape of the dipole and its dispersion. The heterogeniety of the material contributed to the space charge polarization. The insulating SnO2 (as compared to the conductivity of PAni) in a conducting matrix of polyaniline forms more interfaces, therefore some space charges accumulated at interfaces and contribute towards microwave absorption. In conducting polymer composites mobile (polaron/bipolaron) and bound charges are present. The polaron and bipolaron are free to move along the chain and bound charges have restricted mobility, this causes the change in the dielectric constant when high frequency electric field is applied. The SnO2 and PAni have different conductivity and dielectric constant at microwave frequency. Due to this some charges have been traped and a space charge is developed on the surface of the isulating interface and conducting polymer.
When the SnO2 is added with PAni as dopant then it becomes the heterogeneous dielectric. In heterogeneous dielectric the accumulation of virtual charge at interface (interfacial polarization) of two media having different dielectric constants say ε1 and ε2 and conductivities σ1 and σ2 respectively for PAni and SnO2, polarization takes place (Fig. 12) [27]. This loss and polarization depends on the quantity of weakly polar material present as well as on the geometrical shape of its dispersion. The quantity added (i.e. 12 wt.% SnO2) in PAni and geometry is more responsible for higher interfacial polarization therefore the conductivity is maximum for this proportion in a composite (Fig. 10). At microwaves, increase in frequency increases the dielectric loss. The conducting species of the PAni embeded into the non-conducting matrix of SnO2 decreases the dielectric constant and loss with concentration of SnO2. As compared to the conducting species the non-conducting species required more time to orient in the direction of the field hence the two types of relaxation times. Also the relaxation time depends on the geometric shape of the polar molecule as well as mobility of the dipoles.
In semiconducting materials Drude like behaviour is expected when conduction takes place in extended states. This happens at very high frequencies generally greater than 1012 Hz. Thus the frequency dependent conductivity occurs in homogeneous materials having absence of localised states which arises from defects. However at low frequencies i.e less than 1012 Hz, AC conductivity follows power law behavior and this is entirely due to hopping motion of electrons between localized states which are created due to defects. This Power law behaviour arises in inhomogeneous materials from diffusive motion of charge carriers. In composites having two medium as filler or dopant and conducting matrix, the complex dielectric constant of effective medium responsible for power law behaviour of conductivity (σac = Αω s ).
In composites or inhomogeneous material conduction in band states may be in the form of potential fluctuations in conduction or valence band edges arising from randomly distributed charges which forms small polarons. Thus the relaxation time for small polaron tunneling at high temperatures can be written as
whereas at low temperatures i.e below Debye temperature
Where ω 0 is the vibrational frequency of lattice distortion and Wh is the activation energy for polaron transfer.
From Eq. (11) it is expected that the tunneling distance Κ ω at frequency ω decreases rapidly as ω → ∞, hence thACac conductivity (Eq. 19) should become zero i.e 𝜎ac → 0. But this is not possible because tunneling distance Rω cannot be equal to zero, however it is minimum and equals to interatomic distance. This may be the cause of the tunneling of electrons at high frequencies and high temperature.
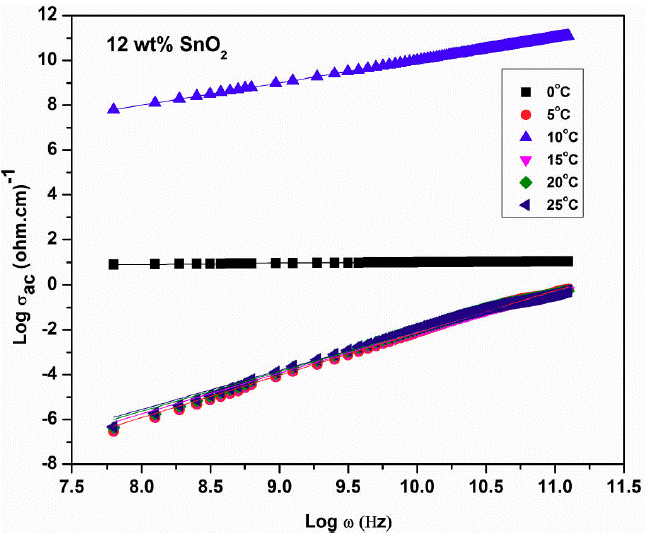
The plots drawn in Fig. 13 are the exploration of 𝜎ac = Αω s equation, gives the slope equal to value of exponent ´s´. These values are found to be of the order of 0.04 to 1.8 for 12 wt.% SnO2 sample. Similar behavior is observed in 10, 12, 15 and 20 wt.% of the samples (plots are not shown). The values of exponent V are similar for all the temperatures except 0 and 10°C.
From Fig. 13, it is observed that the AC- conductivity increases linearly and all the plots are merge with each other for the temperatures 5, 15, 20 and 25°C. This shows that the exponent 's' is temperature independent and frequency dependent which is well explained by the Eq. (20). This is the typical characteristics of Quantum Mechanical Tunneling of electrons. Thus the QMT model explains the behavior of these composites well at microwave frequencies.
4.5. Absorption coeficient (𝜶)
Absorption coefficient (𝛼) is directly propotional to dielectric loss (ε") as
Thus the skin depth (δ) or penitration is inversaly propartional to absorption coefficient (𝛼) and/or dielectric loss (𝜖"). Hence trend which follows by the dielectric loss with doping concentration, the same trend will follow the absorption coefficient. As absorption coefficient is inversaly proportional to skin depth, the exact opposite trend would follow the skin depth with doping concentration. Figure 9 shows the variation of dielectric loss (𝜖") with SnO2 concentration at 18.8 GHz for different temperatures. The dielectric loss increases with SnO2 loading in PAni means skin depth decreases with loading of PAni, suggests that the effective distance of penitration of electromagnetic waves in to PAni-SnO2 increases. Thus the material PAni-SnO2 absorbs electromagnetic radiation.
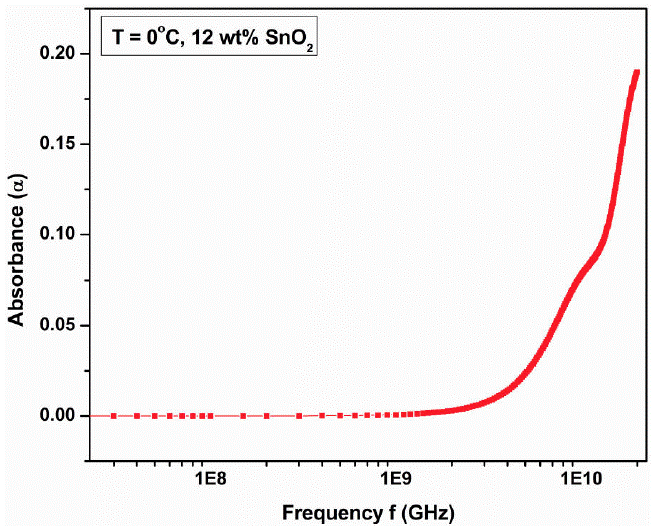
Figure 14 shows the variation of absorption coefficient (𝛼) with frequency at 0°C for 12 wt.% SnO2 composite. The absorption coefficient is nearly constant up to 1 GHz and then increases rapidly showing small deviation at 10 GHz frequency.
The dielectric and magnetic properties of material (𝜖 and μ) are directly related to the absorbing charecteristics of the material. The conducting polyaniline composites can be exploited as microwave absorbers. In S,C and X bands these materials works as good microwave absorbers. The interesting part is the skin depth or penitration depth depends on the loading of foreign component in conducting polymer especially in polyaniline the skin depth decreases with increasing foreign component loading. When skin depth decreases, the material becomes opaque to electromagnetic (EM) radition. The absortion of electromagnetic energy by the composite suggests that the AC/DC conductivity of the materials is related to the number of absorbing centers in polyaniline and type of polymer matrix i.e. dopant that modify the impedance of the material [33].
5. Conclusion
The dielectric properties of PAni-SnO2 composites have been investigated in the microwave region from 0.01 to 20 GHz at various temperatures viz -5, 0, 5, 10, 15, 20 and 25°C. The SEM images of the PAni and SnO2 shows amorphous nature. In SnO2 sample nano crystallites having 30 - 48 nm size are form. The dielectric constant decreases with increase in frequency and loss increases with frequency showing two relaxation peaks at particular frequencies. Such type of behaviour in conjugated polymers is due to interfacial polarization existed from polar and conductive regions dispersed in less polar and insulating matrix which interfere the relaxation process. The relaxation time is found to be of the order of ps.
As the exponent in 𝜎ac = Αω s equation depends on frequency only and independent of temperature, the QMT model fits well to explain the tunneling of electrons through the barrier. Microwave conductivity is a contact less electrode method of measurement which avoids the electrode polarization and other associated problems, gives true value of conductivity. The PAni is doped by nano SnO2, so the hetero-generous dielectric material is formed which may cause the help in the increase of interfacial polarization. The increase in dielectric loss with SnO2 i.e. absorance with SnO2 loading decreases skin depth, which suggests the effective distance of penitration of EM waves in to PAni-SnO2 composite decreases. Thus material absorbs EM radition.


 text new page (beta)


