


 text new page (beta)
 English (pdf)
 Article in xml format
 Article references
 Send this article by e-mail
 Cited by SciELO
  Similars in
SciELO
Similars in
SciELO 
 Permalink
1. Introduction
Fusion reaction is one of the important methods consulted in explaining nuclear interactions. If all nucleons of the projectile and target nuclei are included in the process, complete fusion takes place. On the other hand, incomplete fusion occurs with a large part of the projectile and target nuclei [1]. A lot of effort has been devoted, both theoretical and experimental in relation to fusion reactions.
Recently, the experimental data of the fusion cross section of 9Li + 70Zn reaction have been measured for seven projectile energies at the ISAC facility by Loveland et al. [2]. The experimental data have been analyzed via a coupled channels calculation. Then, Balantekin and Kocak [3] have performed a coupled channels calculation with one and two neutron transfer effects. The studies point out that there is still uncertainty concerning 9Li + 70Zn fusion process.
Proximity model, which is established by Blocki et al. [4], is one of the important models used to explain the interactions of nuclei involved in the fusion reactions. In the con-text of proximity model, the potential is defined together with a geometric factor and a universal function. Various versions of the proximity model by changing the parameters, such as the radius parameter, surface energy coefficient and universal function can be found in the literature [5-9]. At the same time, temperature-related proximity potentials have been pro-posed by including the temperature depending on the interaction situation. Therefore, it would be meaningful to see the effects of proximity potentials for the analysis of 9Li + 70Zn fusion cross section.
It is assumed that the initial state of a nuclear reaction including the projectile and target nuclei is at zero temperature due to ground states. When a collision between the nuclei occurs, they can have an excited state owing to the temperature [10]. Thus, an increase in temperature can occur [11]. The interactions including nucleons due to a potential or two-body collisions for a heavy-ion reaction can show differences compared to cold nucleus [12]. This also causes a change in density distributions. Thus, the optical potential changes due to the fact the density distribution of nucleus changes with increasing the temperature. This will provide differences in the acquisition of theoretical results.
The choice of an appropriate potential to explain nuclear interactions is very important [13-15]. In this context, different potentials such as Woods-Saxon, Woods-Saxon square, Gauss, and Yukawa can be found in literature. These potentials are generally evaluated independently of temperature. However, the potentials should also include temperature parameter depending on the state of nuclear interactions because. It is possible that the temperature will increase with the interaction of the two nuclei. For this reason, the temperature effect should be taken into account in the potential that defines the nuclear system.
In the present study, we perform a comprehensive analysis of 9Li + 70Zn fusion cross section which has an important place in the literature. With this goal, we apply three different methods to obtain the theoretical results. Firstly, we calculate the fusion cross sections by using fourteen different proximity potentials at zero temperature. Then, we obtain the density distributions of the 9Li and 70Zn nuclei for different temperatures values from T = 0 to T = 5 MeV. We calculate the fusion cross sections of 9Li + 70Zn reaction by using these temperature dependent densities. Finally, we investigate the effects of temperature dependent potentials on the fusion cross section of 9Li + 70Zn reaction. For this, we obtain the fusion cross sections for two different temperature dependent potentials such as Proximity and Tomasi.
This paper is organized as follows. In Sec. 2, we give the theoretical formalism. In Sec. 3, we show the results and discussions. In Sec. 4, we provide the conclusions.
2. Theoretical framework
2.1. Model
The potential assumed in the calculations of the fusion cross section of 9Li + 70Zn reaction can be shown as
V Coulomb(r) potential is presented by [16]
where R c is the Coulomb radius, Z P (Z T ) denotes the charge of projectile(target) nucleus, and A P (A T ) is the mass number of projectile(target) nucleus, respectively. V Nuclear(r) potential is thought to be composed of real and imaginary parts. In this context, the real potential is obtained by using three different ways which are explained in the following subsections. However, the imaginary part of the optical potential is taken as the Woods-Saxon potential within the phenomenological approach
where
2.2. Proximity potentials
In the theoretical analysis of fusion cross section of 9Li + 70Zn reaction, we first examine the effects of proximity potentials. For this, we evaluate fourteen different proximity potentials which are given in the Appendix.
2.3. Temperature dependent density distributions
Secondly, we search the effects of both temperature dependent and temperature independent density distributions of the 9Li and 70Zn nuclei on the 9Li + 70Zn fusion cross section. In this context, we use two parameter fermi (2pF) density distribution for temperature dependent and independent cases of the 9Li and 70Zn nuclei. The 2pF density for different temperatures is given by [19]
where ρ 0i (the central density) is shown as
where R 0i (T = 0) (half-density radii) is written as
and a i (T = 0) (the surface thickness parameter) is in the following form
In order to calculate the real part of nuclear potential at different temperatures, we apply temperature dependent forms of R 0i (T ) and a i (T ) parameters presented by [20]
2.4. Temperature dependent nuclear potentials
Finally, we examine the effects of nuclear potentials that de-fine the 9Li and 70Zn nuclei depending on the temperature. These potentials are described in the following subsections.
2.4.1. Tomasi potential
The first potential is Tomasi potential given as [21]
where
2.4.2. Proximity potential
Another potential that is examined as a function of temperature is the proximity potential. Temperature independent Prox 77 potential has already been defined in the Appendix. However, temperature dependence values of proximity potential are given by [20, 22-25]
3. Results and discussion
3.1. Analysis with proximity potentials
The proximity potentials have been extensively used in determining the fusion reactions and other nuclear interactions, and have been also subjected to several modifications. Thus, the experimental data of various nuclei from light to heavy have been explained by using these potentials. The fusion cross section of 9Li + 70Zn reaction has been investigated by using fourteen different types of proximity potentials that consist of Prox 66, Prox 76, Prox 77, Prox 79, Prox 84, Prox 88, Prox 95, BW 91, AW 95, Bass 73, Bass 77, Bass 80, CW 76 and Ngo 80. The distance-dependent variations of the potentials are comparatively shown in Fig. 1. Also, the theoretical results are compared with the experimental data in Fig. 2. Moreover, the potential parameters of the imaginary part of the optical potential are listed in Table I.
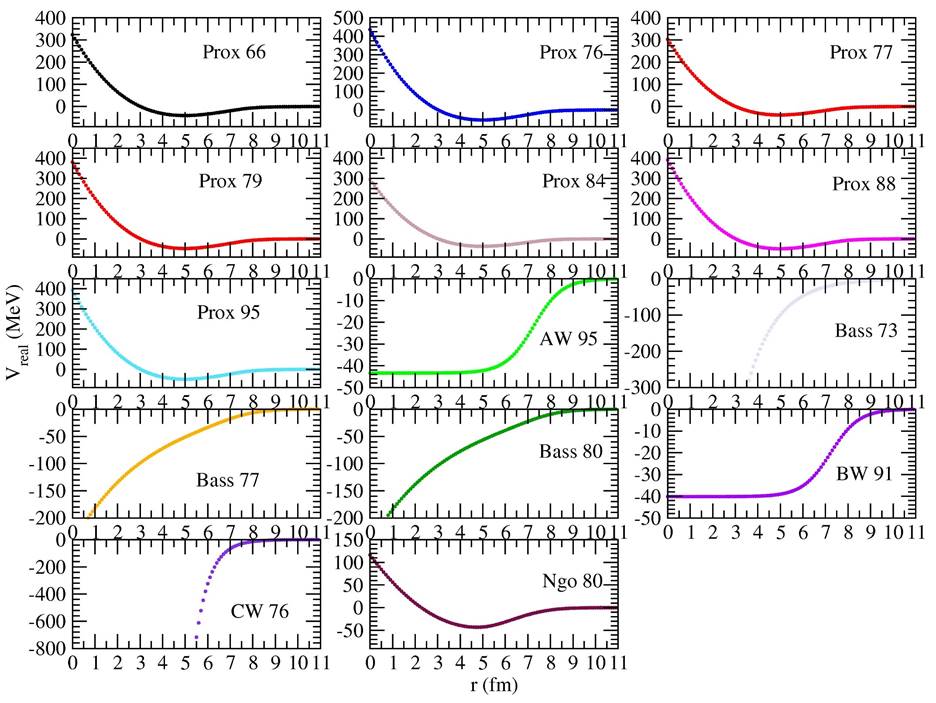
Figure 1 Distance-dependent changes of Prox 66, Prox 76, Prox 77, Prox 79, Prox 84, Prox 88, Prox 95, AW 95, Bass 73, Bass 77, Bass 80, BW 91, CW 76 and Ngo 80 potentials.
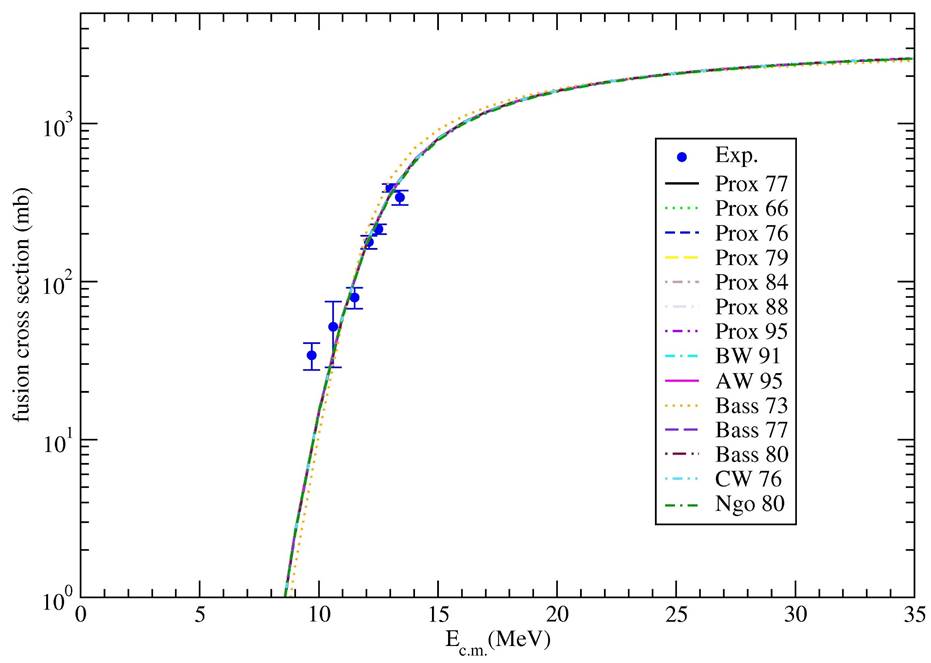
Figure 2 The fusion cross sections of 9Li + 70Zn reaction in comparison with the experimental data by using Prox 77, Prox 66, Prox 76, Prox 79, Prox 84, Prox 88, Prox 95, BW 91, AW 95, Bass 73, Bass 77, Bass 80, CW 76 and Ngo 80 potentials. The experimental data are taken from Ref. [2].
Table I The potential depths W 0 (in MeV) used in the calculations of 9Li + 70Zn fusion cross section by means of Prox 77, Prox 66, Prox 76, Prox 79, Prox 84, Prox 88, Prox 95, BW 91, AW 95, Bass 73, Bass 77, Bass 80, CW 76 and Ngo 80 potentials. In all the calculations, r w = 1.38 fm and a w = 0.76 fm.
The results of the proximity potentials except for Bass 73 potential are very similar to each other. The results are in very good agreement with the experimental data. On the other hand, the results of Bass 73 potential are slightly worse than the other potential results. It can be deduced that the different proximity potentials examined in our study are quite valid in explaining the experimental data of the fusion cross section of 9Li + 70Zn reaction.
In the light of the results, we have observed that the fusion cross sections are very close to each other although the proximity potentials are different from each other. In this context, when we have examined the imaginary potential values given in Table I, we have observed that the potential depths of are very close to each other except for Bass 73 potential. Additionally, it has been seen that the real potential variations of the proximity type potentials shows similarity to each other. We think that the behaviors of the fusion cross section results plotted in Fig. 2 can be very similar to each other because of all these results. Moreover, we want to add that the structures of the colliding nuclei may be effective in the formation of these results.
3.2. Analysis with temperature dependent density distributions
In the present study, we have examined the effects of both temperature independent and temperature dependent density distributions on 9Li + 70Zn fusion cross section. For this, we have used the 2pF density for temperature dependent and temperature independent cases of the 9Li and 70Zn nuclei. Equations (10) and (11) have been used to obtain the density distributions of 9Li and 70Zn nuclei from 1 to 5 MeV. Thus, the densities change with temperature and the density distributions based on the temperature are obtained. The double folding model depends on the density distributions of the interacting nuclei. As a result, the optical potential changes due to the fact the density distribution of nucleus changes with in-creasing the temperature.
We have exhibited the changes of the densities of the 9Li and 70Zn nuclei with temperature in Fig. 3. The reason for the examination of the density distribution of both 9Li and 70Zn is to determine which nucleus contributes to the theoretical results. We have first tried to see the change of temperature with density of the 9Li nucleus. Then, the density of the 70Zn nucleus has been investigated by considering the temperature change. While Fig. 3(a) shows the temperature independent densities of the 9Li and 70Zn nuclei, Fig. 3 (b) and (c) respectively display the densities of the nuclei for different temperatures from T = 1 to T = 5 MeV. We do not go much higher temperatures since the nucleus can be un-stable [10]. We have observed that the central densities of 9Li and 70Zn nuclei decrease with increasing the temperature. Also, we have noticed that the tail parts of the density distributions increase with increasing the temperature. It means that the surface regions of the densities are broadened. As a result of this, the values of the root mean square (rms) increase.
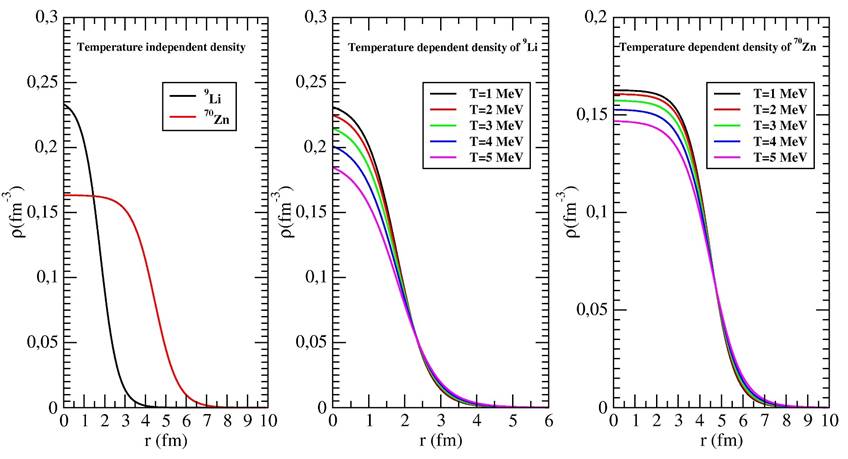
Figure 3 Density distributions as a function of r (fm) of (a) the 9Li and 70Zn nuclei at T = 0 MeV, (b) the 9Li nucleus at T = 1, 2, 3, 4, 5 MeV, and (c) the 70Zn nucleus at T = 1, 2, 3, 4, 5 MeV.
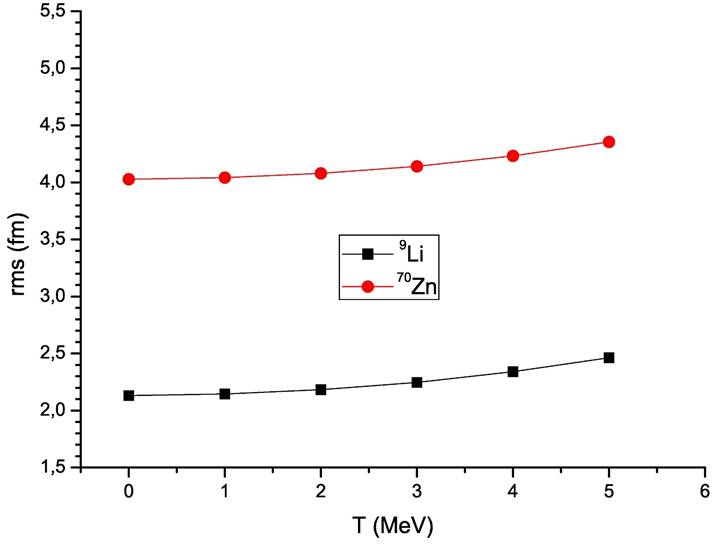
Figure 4 demonstrates the changes with the temperature of the rms values of 9Li and 70Zn nuclei at T = 0, 1, 2, 3, 4, 5 MeV. It is observed that the rms values of 9Li and 70Zn nuclei increase as a function of the temperature. This case can be evaluated as the outward shift of nucleon densities [10].
Figures 5, 6, and 7 present the theoretical results of the fusion cross section of 9Li + 70Zn system as temperature dependent. Figure 5 provides temperature dependent change of only 9Li nucleus, Fig. 6 shows temperature dependent change of only 70Zn nucleus, and Fig. 7 displays temperature dependent changes of both 9Li and 70Zn nuclei. Also, the imaginary potential parameters are given in Table II. While the values of the imaginary potential parameters are obtained, the values that provide good agreement results with the experimental data have been researched in steps of 0.1 and 0.01. We have observed that the theoretical results are very similar to each other for all situations and do not change much depending on the temperature. In addition to this, the results are in good agreement with the experimental data.
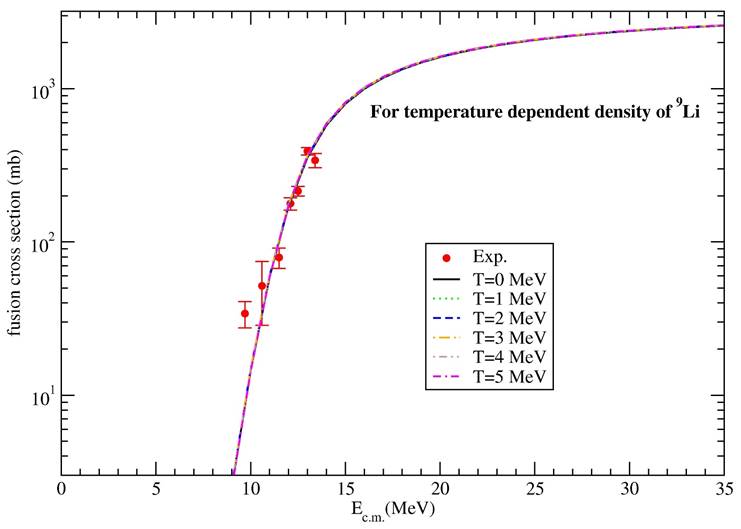
Figure 5 The fusion cross sections of 9Li + 70Zn reaction for 2pF density of 9Li nucleus at T = 0, 1, 2, 3, 4, 5 MeV. The experimental data is obtained from Ref. [2].

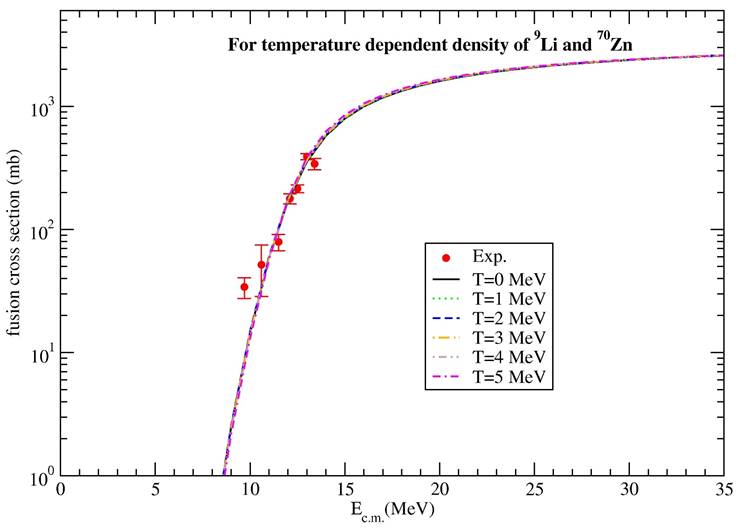
Table II The potential parameters evaluated for the analysis of 9Li + 70Zn fusion cross section via 2pF densities of the 9Li and 70Zn nuclei at various temperatures (T = 0, 1, 2, 3, 4, 5 MeV). In all the calculations, r w = 1.31 fm and a w = 0.558 fm.
| Potential | Parameter | T=0 | T=1 | T=2 | T=3 | T=4 | T=5 |
|---|---|---|---|---|---|---|---|
| 9Li | W 0 (MeV) | 21.6 | 21.6 | 22.2 | 22.2 | 22.2 | 21.0 |
| r w (fm) | 1.39 | 1.39 | 1.39 | 1.39 | 1.39 | 1.39 | |
| a w (fm) | 0.76 | 0.76 | 0.76 | 0.76 | 0.76 | 0.76 | |
| 70Zn | W 0 (MeV) | 21.6 | 21.6 | 21.6 | 21.6 | 20.6 | 20.6 |
| r w (fm) | 1.39 | 1.39 | 1.39 | 1.39 | 1.39 | 1.39 | |
| a w (fm) | 0.76 | 0.76 | 0.76 | 0.76 | 0.76 | 0.76 | |
| Both | W 0 (MeV) | 21.6 | 21.9 | 22.2 | 21.2 | 20.5 | 18.6 |
| r w (fm) | 1.39 | 1.39 | 1.39 | 1.39 | 1.39 | 1.39 | |
| a w (fm) | 0.76 | 0.76 | 0.76 | 0.76 | 0.76 | 0.76 |
3.3. Analysis with temperature dependent nuclear potentials
We have analyzed the fusion cross section of 9Li + 70Zn system by using two different temperature dependent nuclear potentials which consist of Proximity and Tomasi potentials. In this context, we present a comparison of the real potentials of the nuclear potentials via the Proximity (Fig. 8a) and Tomasi (Fig. 8b) potentials in Fig. 8. We have observed that the real parts of Proximity and Tomasi potentials decrease with increasing the temperature values and extend at larger distances. Additionally, their locations are shifted at smaller distances.
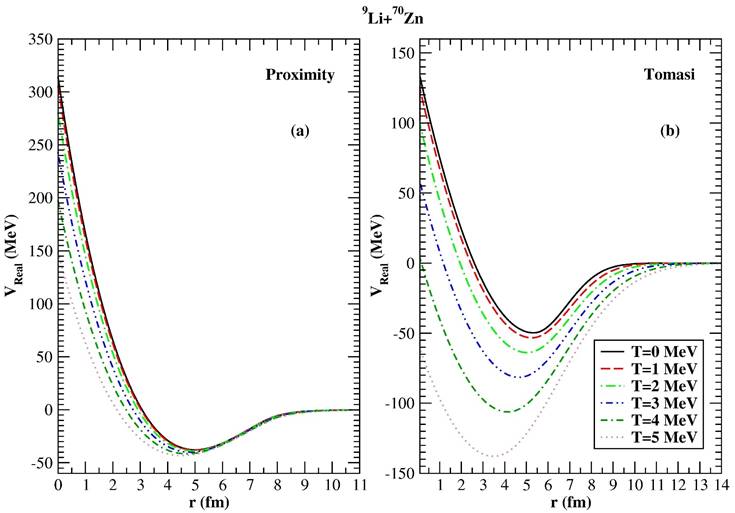
Figure 8 Comparison of the real potentials of 9Li + 70Zn interaction potential for different values of the temperature by using (a) Proximity potential, and (b) Tomasi potential.
We have also calculated the fusion cross section of 9Li + 70Zn by means of the Proximity and Tomasi potentials at T=0, 1, 2, 3, 4, and 5 MeV. It is important to clarify that the theoretical results are consistent with the experimental data for these temperatures. In our study, we can say that there are two reasons to go from 1 to 5 MeV. The first one is that temperature values have been applied up to 5 MeV for different fusion reactions by Tomas et al. [21]. The second reason is to determine the agreement between theoretical results and experimental data depending on temperature. We do not go much higher temperatures since the nucleus can be unstable [10]. We have compared our fusion cross sections with the experimental data in Fig. 9. Additionally, we have listed the imaginary potential parameters in Table III. We have seen that the theoretical results of temperature dependent Proximity potential are very close to each other for all the temperature values. Additionally, the harmony between the theoretical results and the experimental data is very good. We have realized that the results of Tomasi potential have displayed differences for different temperature values. We have observed that if the temperature increases, the theoretical results are less consistent with the experiment data. We have seen that T = 1 MeV and T = 2 MeV results are in better agreement with the data than the results of the other temperature values. We have concluded that the results of the Tomasi potential are more sensitive to temperature change compared to the results of Proximity potential.
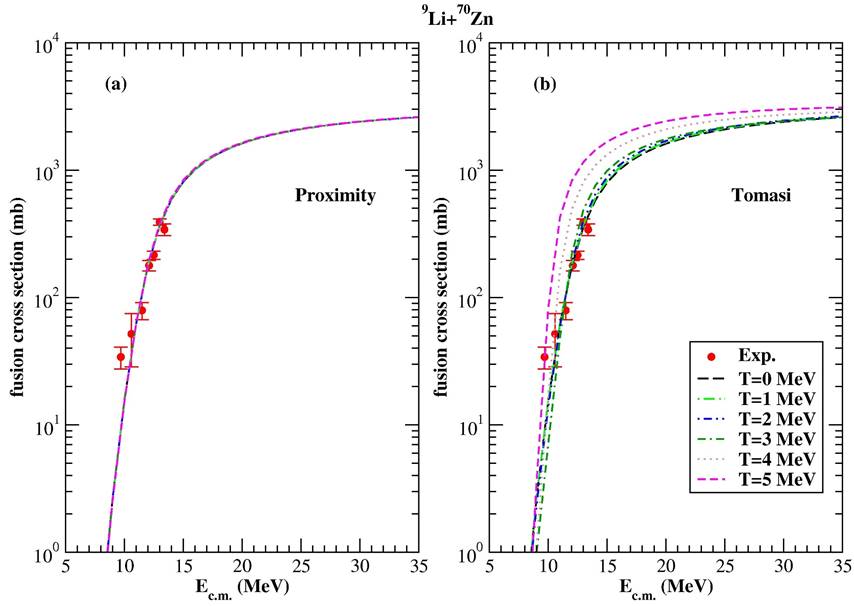
Figure 9 Comparison of the experimental and theoretical results of 9Li + 70Zn fusion cross sections calculated for two different potentials with and without temperature dependent. The experimental data are taken from Ref. [2].
Table III The potential parameters for 9Li + 70Zn fusion cross section calculated by using the Proximity and Tomasi potentials for the real part and the Woods-Saxon potential for the imaginary part.
| Potential | Parameter | T=0 | T=1 | T=2 | T=3 | T=4 | T=5 |
|---|---|---|---|---|---|---|---|
| Proximity | W 0 (MeV) | 21.3 | 21.2 | 21.0 | 20.9 | 20.5 | 20.2 |
| r w (fm) | 1.4 | 1.4 | 1.4 | 1.4 | 1.4 | 1.4 | |
| a w (fm) | 0.76 | 0.76 | 0.76 | 0.76 | 0.76 | 0.76 | |
| Tomasi | W 0 (MeV) | 21.0 | 20.9 | 18.0 | 7.0 | 5.5 | 3.5 |
| r w (fm) | 1.4 | 1.4 | 1.4 | 1.4 | 1.4 | 1.4 | |
| a w (fm) | 0.76 | 0.76 | 0.76 | 0.76 | 0.76 | 0.76 |
It can be seen from Fig. 8 that the change with temperature of the real potentials is higher for Tomasi potential compared to the Proximity potential. Additionally, we have observed that the potential depths of Tomasi potential have changed more markedly, especially in T = 3, 4 and 5 MeV. However, the potential depths of the Proximity potential are not much changed. As a result of this, it has been seen that the effect of temperature on the fusion cross sections of Proximity and Tomasi potentials is more distinct in the results of Tomasi potential.
4. Conclusions
We have investigated the fusion cross section of 9Li + 70Zn system within the framework of the proximity potentials, temperature dependent and temperature independent density distributions and nuclear potentials. The experimental data of the fusion cross section have been reproduced quantitatively by using the proximity potentials. We have observed that the results of temperature dependent density distribution do not change much with the temperature. Finally, we have concluded that the results of the Tomasi potential are more sensitive to temperature change compared to the results of Proximity potential.

