


 nueva página del texto (beta)
 Inglés (pdf)
 Artículo en XML
 Referencias del artículo
 Enviar artículo por email
 Citado por SciELO
  Similares en
SciELO
Similares en
SciELO 
 Permalink
1. Introduction
The main purpose of the radiation therapy is to maximize radiation doses to cancer cells while minimize damage to surrounding normal tissue. Protons have different dosimetric characteristics when compared to photons used in conventional radiation therapy. After a short build-up region, conventional radiation shows an exponentially decreasing energy deposition with increasing depth in tissue. In contrast, protons show an increasing energy deposition with penetration distance leading to a maximum, called the “Bragg peak”, near the end of proton range. This physical characteristic of protons causes an advantage of proton treatment over conventional radiation because the region of maximum energy deposition can be positioned within the target for each beam direction [1]. So, it is necessary to calculate the range with high accuracy in the proton therapy.
Also, as protons and charged particles travel through a medium, they interact with atomic electrons and atomic nuclei of the medium through Coulomb forces [2].
Every atom has many electrons with different ionization and excitation potentials. As a result of this, the moving charged particle interacts with a tremendous number of electrons-millions. Each interaction has its own probability for occurrence and a certain energy loss. It is impossible to calculate the energy loss by studying individual collisions. Instead, an average energy loss is calculated per unit distance traveled [3], this energy loss per unit path length of the particle (S = -dE=dx) is known as the stopping power. The values of S are usually given in unit of MeV/(g/cm2) [or in SI unit of J/(kg/m2)] [2].
The total stopping cross-section can be divided into two parts: 1- The energy transferred by the ion to the target electrons (called electronic stopping or inelastic energy loss). 2-To the target nuclei (called nuclear stopping or elastic energy loss). This classification is due to the assumption that the target nucleus is slowly being recoil, while electrons move very fast [4].
The study of energy loss is important for measuring and evaluating the effects of radiation, since radiation effects are determined based on the interactions and deposited energy in the target material [3], therefore, extensive studies have been done on the stopping power [5-8] and the range [9-10] and both of these [11-14] with various methods such as empirical, fit, extrapolation, and simulation. There are several formulas in different situations.
It should be noted that the stopping powers are relevant to the wide range of applications such as ion beam analysis, region of energy deposition (such as hadron therapy in biological target), and radiation damage, and . . . [15].
Also, in order to consider damage to body the substances of interest in radiobiology and irradiated media have been considered to have an elemental composition like that of tissue [16]. Tissue-equivalent materials may be fabricated to simulate a wide variety of tissues and organs. A single soft-tissue material is therefore commonly used for all soft-tissues with the exception of the lung [17].
Therefore, considering the many uses of stopping power, in this paper we calculate this quantity in one of the most important materials; i.e. the soft tissue equivalent (T.E.) material.
2. Theory
The purpose of the hadron therapy is to deliver maximum dose (the energy absorbed per unit mass of the irradiated material) to the tumor and minimum dose and damage to the surrounding normal tissues. The appropriate proton energy to destroy the tumor needs to be determined depending on the type and characteristics of the target tissue and the depth of the tumor [2]. On the other hand, the proton range and the corresponding stopping power (and depth-dose profile) have to be estimated with high accuracy in order to determine the correct proton energy to be used to irradiate the tumor at a specific depth.
2.1. Calculation of stopping power for a compound
In this section the formula used to calculate the stopping power of protons in the T.E. and in their components will be reported. The density of T.E. is 1.07 gr/cm3 and its fractions by weight of H (hydrogen), C (carbon), N (nitrogen), and O (oxygen) is 10.1%, 11.1%, 2.6%, 76.2% respectively [16]. This material consists of four elements: hydrogen, oxygen, carbon and nitrogen. Therefore, we must calculate the stopping power in a compound. The mass stopping power of the compound is calculated with formula in Eq. (1). The mass stopping power can be obtained by dividing the stopping power with the density of the material.
Where ρ is the density and w i is weighted fraction of the ith element [6].
2.2. Electronic stopping power
The following formula has been proposed to calculate stop-ping power due to ionization-excitation for proton by Bethe:
In this relation
In the above relation, T is kinetic energy and M is the rest mass of the particle. The speed of light is c, n is number of atoms/m3 in the material through which the particle moves. Z is the atomic number of the material and z is the charge of the incident particle (z = 1 for proton), and I is the mean excitation potential of the material [3].
The Bethe’s stopping-power formula is valid at high energies. One of the most obvious limitations of the Bethe’s formula is that this formula is based on the assumption that the particle moves much faster than atomic electrons. At low energies the Bethe’s formula fails because the term Ln((2mc 2 β 2 γ 2)/I) eventually becomes negative, giving a negative value for the stopping power [18]. Thus, we calculate the proton stopping power using the reference [19], which is expressed in wide region of energy. The below stopping power unit is eV/((1015 atoms)/cm2).
Where S Low (Low Energy Stopping) is:
And S High (High Energy Stopping) is:
In this relation, energy is as follows
And the coefficients of the T.E. for the proton stopping power are as follows [19]:
As seen from the above formula, each element has 12 constants, and so the soft tissue equivalent material has 48 constants. Many constants causes a large rounding error and increases the probability of user error and memory consumption of the computer, consequently reduces Information processing speed.
2.3. Nuclear stopping power
Formula (9) is the nuclear stopping power, expressed in unity of eV/(atoms/cm2),
In the above relation s n is defined as follows:
which the reduced energy is defined as follows:
E is the ion energy in units of keV and z 1 and z 2 are the atomic number of the ion and target respectively, and the M 1, M 2 are the ion and target mass respectively in units of amu [4].
2.4. Range of charged particle
A charged particle moving through a certain material loses its kinetic energy through interactions with the electrons and nuclei of the material. Eventually, the particle will stop, pick up the necessary number of electrons from the surrounding matter, and become neutral. The total distance traveled by the particle is called the path length. The thickness of material that just stops a particle of kinetic energy T, mass M, and charge z is called the range R of the particle in that material [3] which is calculated by the following formula:
3. Methods
We wrote a computer code using FORTRAN’s programming language. In this computer code we used Formulas (4-12) to calculate the stopping power (SP) and the proton range for four elements of soft tissue equivalent material up to 10 MeV. Also, using Formulas (1), (12) and the fraction by weight for elements of the soft tissue equivalent material, we obtained the stopping power and the proton range in this material up to 10 MeV. With this computer code, in addition to the range, we calculated the stopping power of protons due to the nuclear interactions, the stopping power of protons due to ionization-excitation and the total stopping power of protons.
In order to validate our computer code, we compared our computer code results with Ref. [20]. Then, using the Origin software, we fitted the data of our computer code with various fittings including polynomials of order two and higher, Gaussian and exponential, and we chose and reported the best fits. In the following, we will express our results.
4. Results
In Fig. 1 we show that the nuclear stopping power in the low energy region is important, and in other energies it has a small share from total stopping power. Nevertheless, in order to increase the accuracy of the calculations, we also consider this stopping power.
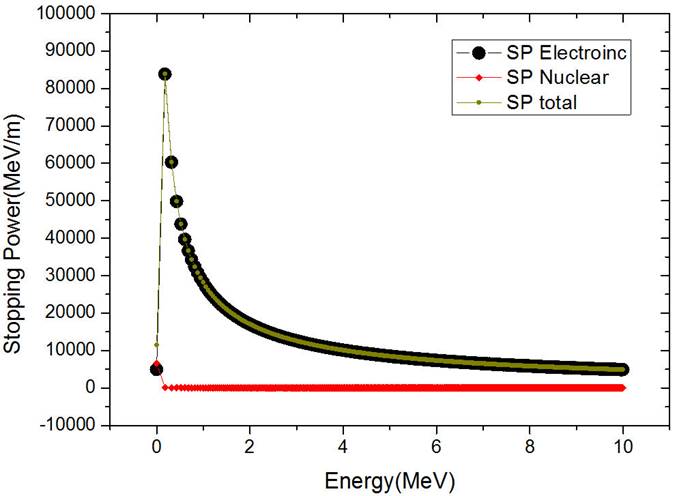
Figure 1 The nuclear SP, electronic SP, and total SP for protons with an energy ranging from 0.3 MeV up to 10 MeV in the T.E.
Figure 2 shows the total stopping power of protons with an incident energy of 10 MeV within the T.E. and within each composing element as calculated with the implemented code. As you can see the maximum stopping power is obtained for protons traversing carbon. This results from the highest density of carbon between the other elements as well as the composed T.E. By increasing density of material, the number of electrons increases and the probability of particle interaction with electrons increases thus the stopping power will be larger. In the soft tissue equivalent material due to weighted fraction, the effect of stopping power of protons in carbon decreases in this material.
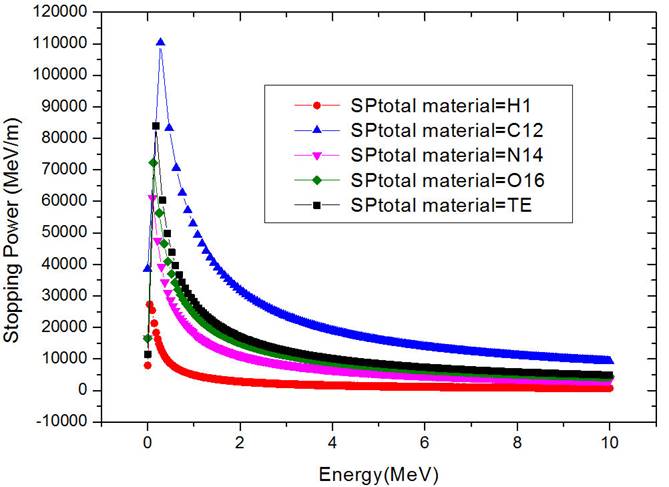
Figure 2 Total stopping power for protons with an energy ranging from 0.3 MeV up to 10 MeV in the T.E. and its elements.
We also compared our calculations to https://physics.nist.gov [20], and the results in Fig. 3 plotted for hydrogen, nitrogen, and oxygen, respectively, and this figure shows good agreement.
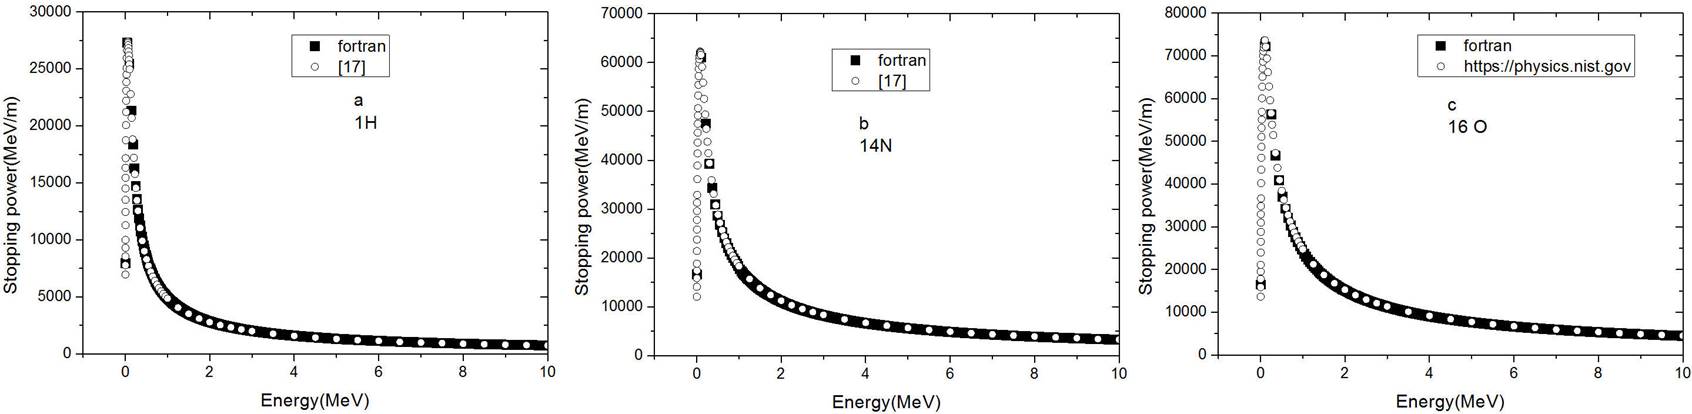
Figure 3 Total stopping power for protons with an energy ranging from 0.3 MeV up to 10 MeV in hydrogen, oxygen, nitrogen. The black curve indicates the results of our computer code, and the white circles are the results shown in reference [20].
Heavier ions have typically a shorter range in the traversed matter. With increasing the energy of the proton to intermediate energies, the probability of interactions of ionization and excitation increases, but increasing energy from intermediate to high energies, the collision time decreases and the possibility of energy deposition reduces. As you can see in Fig. 3 the trend of the stopping power as a function of the incident energy will be first ascending and then descending with a peak depending on the type of radiation and material traversed.
Then, using our computer code implementing also Formula (12), the proton ranges in the soft tissue equivalent material and its elements, including hydrogen, oxygen, nitrogen, and carbon, have been obtained as shown in Fig. 4.
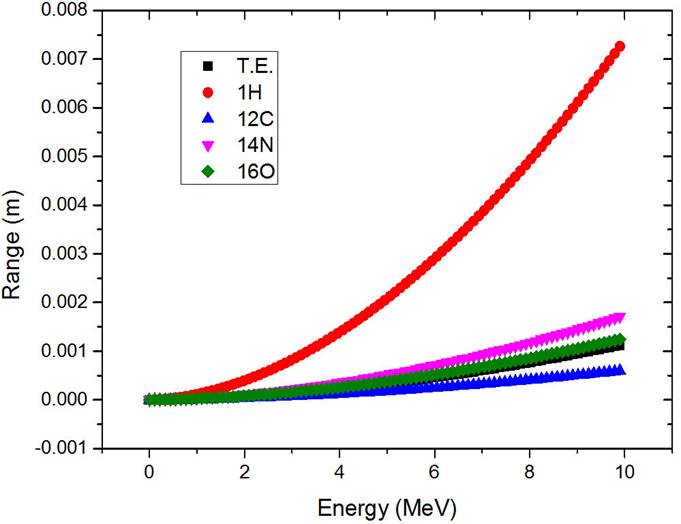
As it is shown in Figs. 2 and 4 protons have a maximum stopping power and as a consequence a lower range within carbon element. On the other hand, since the minimum stopping power for protons is noticed within hydrogen element, a much longer range within such element is obtained. For the same type of incident particles, i.e. protons, higher is the density of the traversed material and higher is the probability of interaction with the surrounding electrons, resulting in a much faster delivery of the energy and hence a shorter range within the material.
In the next step, in order to obtain fast and accurate formulas, for proton range in the soft tissue equivalent material and each of its elements, we fitted the data of our computer code, Fig. 4, with different functions such as polynomials of order two and higher, Gaussian and exponential, and we chose and reported the best fits. Separately for the soft tissue equivalent material and each of its elements we subtracted the data of our computer code from data of fittings, and we calculated the discrepancy between the range obtained from the fits and the one obtained with the data of our computer code. We plotted them in separate graphs using Figs. 10 and 11 and Figs. 5 to 8 for the soft tissue equivalent material and each of its elements separately. In the following, we will express the best fits for each material.
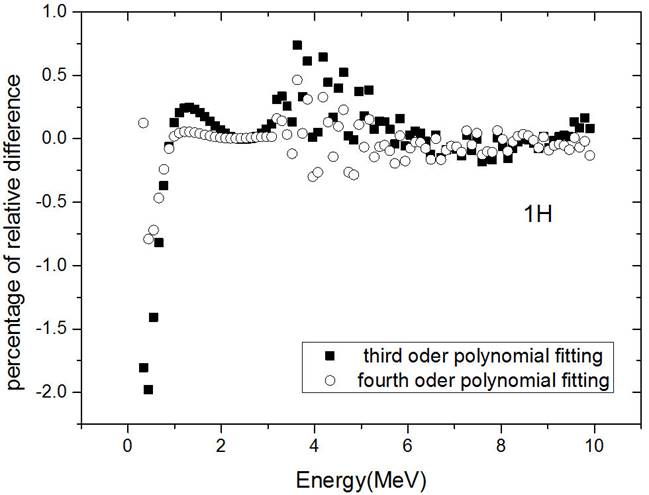
Figure 5 Percentage of the relative difference of the proton range between third and fourth order polynomial fittings and our computer code for proton in hydrogen with an energy ranging from 0.3 MeV up to 10 MeV.
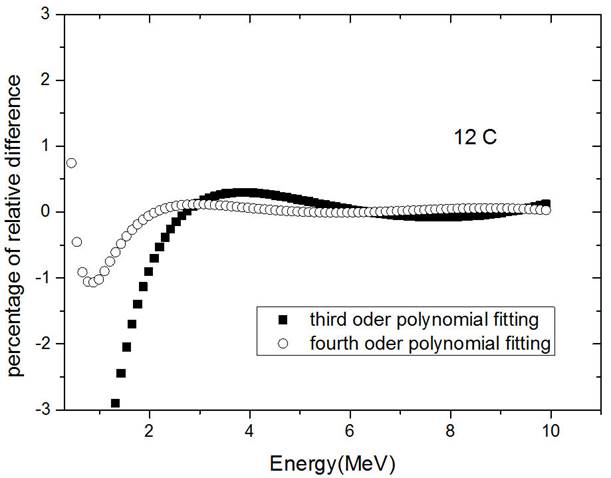
Figure 6 Percentage of the relative difference of proton range between third and fourth order polynomial fittings and our computer code for proton in carbon with an energy ranging from 0.3 MeV up to 10 MeV.
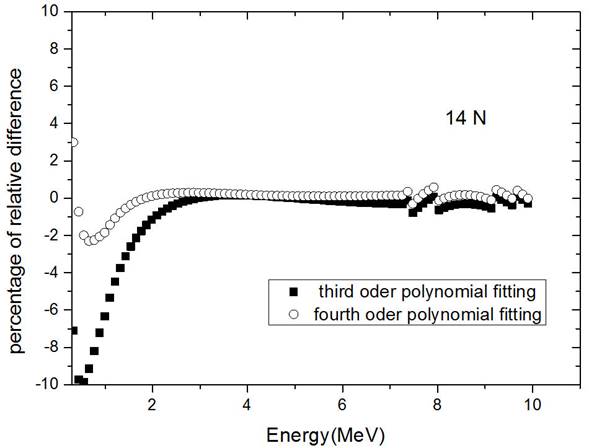
Figure 7 Percentage of the relative difference of the proton range between third and fourth order polynomial fittings and our computer code in nitrogen with an energy ranging from 0.3 MeV up to 10 MeV.
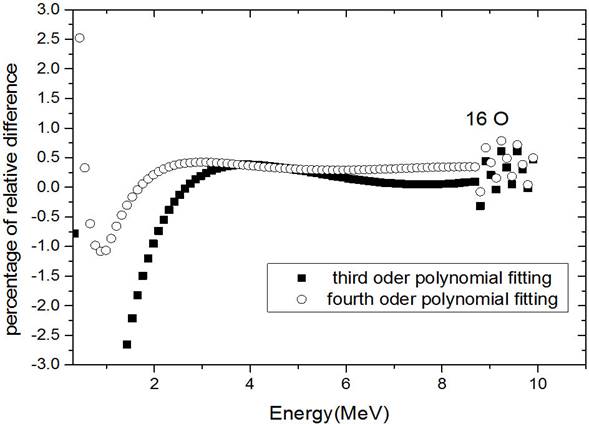
Figure 8 Percentage of the relative difference of the proton range between third and fourth order polynomial fittings and our computer code in oxygen with an energy ranging from 0.3 MeV up to 10 MeV.
For the proton range in hydrogen element, two fittings of the third degree and fourth degree polynomial were the most suitable fittings that in Fig. 5 we plotted the percentage of the relative difference of the range for these two fittings. The best fit for this element is the fourth order polynomial with R-Square=1. According to Fig. 5, in this fit, we get the percentage of relative error less than 0.5% in wide area of energy. Our fitting coefficients for the proton range in hydrogen are given in Table I.
Table I The coefficients obtained from the best fits of the proton range in T.E. and its elements. The energy of the incident proton is E(MeV) < 10. Hydrogen and the T.E. for the more precise are divided into two intervals 0.3 ≤ E(MeV) < 3, and 3 ≤ E(MeV) < 10, so the two values are expressed respectively for each case.
| Material | |||||
| Equation | a | b | c | d | |
| 1 1H | 2.68 × 10 -5 , | 9.59 × 10 -5 , | -5.69 × 10 -6 , | 4.44 × 10 -7 , | |
| y = ax + bx 2 + cx 3 + dx 4 | 3.68 × 10 -5 | 8.53 × 10 -5 | -2.20 × 10 -6 | 7.70 × 10 -8 | |
| 6 12C | |||||
| y = ax + bx 2 + cx 3 + dx 4 | 6.51 × 10 -6 | 6.64 × 10 -6 | -1.72 × 10 -7 | 5.16 × 10 -9 | |
| 7 14N | |||||
| y = ax + bx 2 + cx 3 + dx 4 | 1.81 × 10 -5 | 1.94 × 10 -5 | -5.56 × 10 -7 | 1.76 × 10 -8 | |
| 8 16O | |||||
| y = ax + bx 2 + cx 3 + dx 4 | 1.47 × 10 -5 | 1.38 × 10 -5 | -3.76 × 10 -7 | 1.15 × 10 -8 | |
| T.E. | 9.11 × 10 -6 , | 1.39 × 10 -5 , | -4.93 × 10 -7 , | - | |
| y = ax + bx 2 + cx 3 | 1.25 × 10 -5 | 1.17 × 10 -5 | -1.53 × 10 -7 | ||
For the proton range in carbon, we also fitted the data of our computer code with different curves, which the best fit is fourth-order polynomial with R-Square=1. The percentage of the relative difference of the range in this fit in the wide region of energy is less than 0.2 and its maximum value is 1.1. We showed this graph in Fig. 6 and our fitting coefficients in Table I.
For the proton range in nitrogen, we fitted the data of our computer code with different curves, which the best fit is the fourth-order polynomial with R-Square=1. With this fit in most of the energy region, the percentage of the relative difference of the range is less than 0.5% and in the energy region below 1 MeV, the maximum error is 3%. We plotted this graph in Fig. 7 and our fitting coefficients showed in Table I.
For proton range in the oxygen, we also fitted the data of our computer code with different curves. The best fit is the fourth-order polynomial with R-Square=1, and in wide region of energy, the percentage of the relative difference of the range is less than 0.5% and in the energy region below 2 MeV, the maximum error is 2.5%. We plotted this graph in Fig. 8 and our fitting coefficients showed in Table I.
For proton range in the soft tissue equivalent material we also fitted the data of our computer code with different curves. We presented the graph of this range in Fig. 9 and the results of different fittings in Fig. 10.
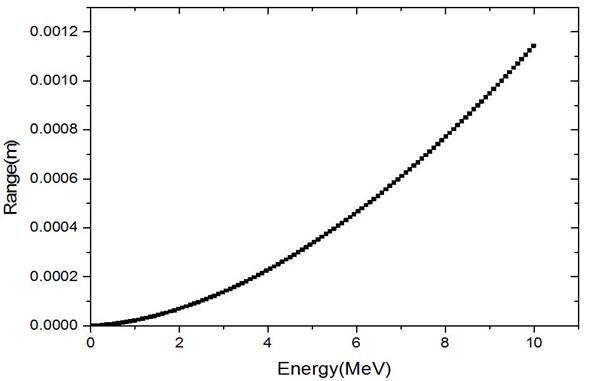
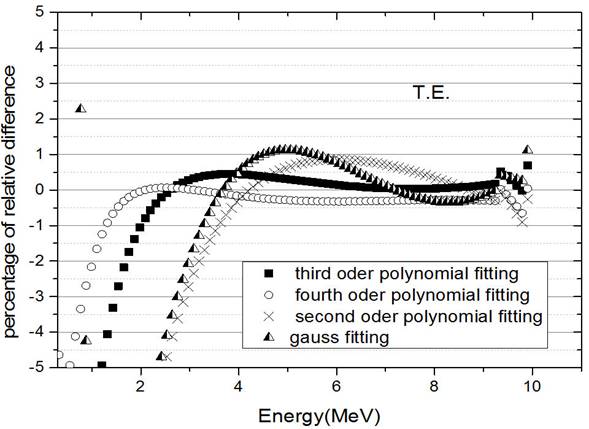
Figure 10 Percentage of the relative difference of the proton range for second, third and fourth order polynomial and Gaussian function fittings with our computer code in T.E with an energy ranging from 0.3 MeV up to 10 MeV.
We then fitted the data of our computer code in T.E. with Second, third, fourth degree polynomials, and Gaussian function. We plotted the percentage of the relative difference of the range for these fits in Fig. 10. According to this figure, for protons with energy greater than 3 MeV, the best fit is third-order polynomial with R-Square=1.
As you can see in Fig. 11, for energies ranging from 0.3 up to 3 MeV, we used a different third order polynomial curve for the fitting (R- Square=1). The discrepancy (in percentage) with respect to the range values in T.E. obtained with the formula for the two energy intervals (A and B) are shown in Fig. 11. The coefficients resulted from the two fits are shown in Table I.
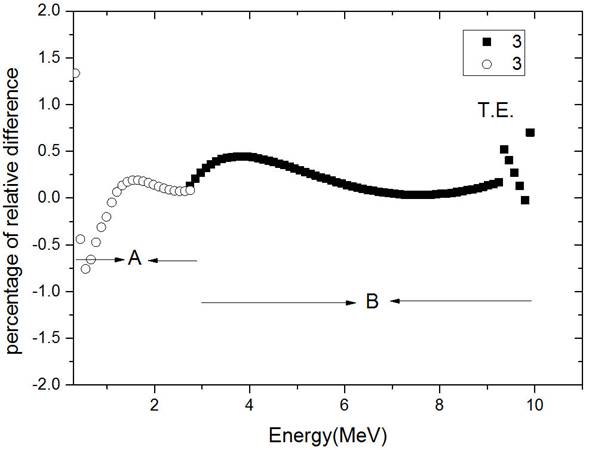
Figure 11 Percentage of the relative difference of the proton range between two fittings of third order polynomial in two regions of energy and our computer code in the T.E. A) energy region of 0:3 < E < 3 MeV B) 3 < E < 10 MeV.
According to Fig. 11, the discrepancy in percentage between the best fit and the range values obtained with the formula is less than 0.5% in a wide energy interval with a maximum value of 0.75% at 0.55 MeV. According to these results, we can state that, with a good approximation, we can definitely use directly the curves obtained from the best fit (Table I) to calculate the proton range in the soft tissue equivalent material for proton energies up to 10 MeV.
5. Conclusion
A new method is here proposed allowing to calculate the range of protons with an energy ranging from 0.3 and 10 MeV in T.E with two third order polynomial curves (A and B) in alternative to the original formula (8) depending on 48 constants. A maximum discrepancy of 0.75% is obtained between the range value calculated with the new fitted formula and the original one, confirming the good accuracy of our approach. Using our formula depending on just 6 constants will reduce considerably the computation time and error. A discrepancy of 0.5%, 0.2%, 0.5% and 0.5% was obtained for the proton range calculated in hydrogen, carbon, nitrogen and oxygen respectively in a wide energy intervals with a maximum discrepancy of 0.8%, 1.1%, 3%, and 2.5% respectively. The original formula used to calculate the proton range in each element of the soft tissue equivalent material depends on 12 constants, instead our formulas obtained with the fitting approach have just 4 constants for carbon, oxygen and nitrogen and 8 constants for hydrogen only. Due to the complexity of the usual formula, the need for high accuracy in calculations and simulations and the probability of user error in calculations, the approximated formulas obtained in the present work represent a good alternative to the complex original formulas.

