


 nueva página del texto (beta)
 Inglés (pdf)
 Artículo en XML
 Referencias del artículo
 Enviar artículo por email
 Citado por SciELO
  Similares en
SciELO
Similares en
SciELO 
 Permalink
1. Introduction
The mini-SciCR is a prototype of a cosmic ray detector called SciBar Cosmic Ray Telescope (SciCRT). The mini-SciCR used the same hardware as the SciCRT, its volume size (20 × 20 × 20.8 cm3) is 1/1,568 compared with the SciCRT. The mini-SciCR was operating from October 2010 to July 2012 at the top of Sierra Negra volcano at 4,600 m.a.s.l., in eastern Mexico. Transporting this prototype to the top of the mountain was relatively easy due to its dimensions.
The main goals of the mini-SciCR were: 1) to demonstrate that this type of detector is feasible to operate under typical high mountain conditions, when this was demonstrated, we decided to install the SciCRT at the top of Sierra Negra volcano (April 2013); and 2) to develop methods to distinguish the signals of different species from cosmic rays. These methods will be the base for developing algorithms that allow us to distinguish the different species of particles recorded in the SciCRT’s data.
We started the development of the algorithms to distinguish particles with the mini-SciCR’s data, for example: 1) in [1] we reported the method to distinguish electron signals from muon signals, and 2) in [2] we reported the method to distinguish charged hadron signals.
In this work we describe the mini-SciCR, its calibration and a method developed with help of a Monte Carlo simulation to distinguish the neutron signals from gamma ray signals. We report the counting rate of these particles obtained with the mini-SciCR at the top of Sierra Negra volcano, Mexico. We also compare our results with the results of other experiments.
2. The SciCRT detection method
On April 2013, we installed the SciCRT at the top of the Sierra Negra volcano, Mexico. The SciCRT consists of 14,848 scintillator bars (2.5 × 1.3 × 300 cm3) arranged in 8 blocks, made of 8 layers each, every layer is made of two mutually orthogonal planes with 116 and 118 scintillator bars, each block has a vertical depth of 20.8 cm. The entire volume of the SciCRT can act both as a target and a tracker of the incident radiation. For more details of the SciCRT see [3].
In left side of Fig. 1 we can see schematically the concept of the current solar neutron telescope [4], incoming neutrons (dotted lines) are converter into charged particles (solid lines) at the plastic scintillator and the track of the recoiled particle is measured at the underlying proportional counters (PRCs). In a case like a, we can regard the direction of the recoiled particle as that of the neutron. However, in the case of b, if the recoiled particle is produced near the top of the scintillator even if the recoiled particle does not have enough kinetic energy, we cannot infer the direction because of the shortage of the track. Thicker scintillator makes the conversion efficiency higher, but then not all the recoiled particles can arrive at the bottom PRCs. Thus the efficiency of the direction measurement is limited. Moreover the case c is complex, we measure the counting rate of each direction as determined level, inevitable misidentification of the direction occurs when multiple recoil particles are generated.

To avoid the problems discussed above, we installed a new detector (SciCRT) at the top of Sierra Negra, Mexico; we are currently in the process of calibrating the SciCRT. All components are composed of plastic scintillator, the whole tracker also acts as an active target. Consequently, the track of all recoiled particles can be measured wherever the interaction occurs. Even in case b, the direction can be determined. We are recording the tracks of all triggered events. By means of track analysis, we can avoid misidentification of the direction as indicated in c in the Fig. 1.
With this new method, the conversion efficiency becomes higher with thicker detectors. To measure the direction, the recoiled particle must penetrate at least 4 layers, the energy threshold of such a proton is 100 MeV [2].
3. Mini-SciCR, a prototype of a large cosmic ray detector
The mini-SciCR is a prototype of a large cosmic ray detector called SciCRT, the mini-SciCR (shown in Fig. 2) consists of 128 scintillator bars with a total volume of 20×20×20.8 cm3, arranged in eight layers. Each layer has two mutually orthogonal planes of 8 bars each. The array of scintillator bars act both as a target and as a tracker of the incident radiation. The dimension of each scintillator bar is 2.5 × 1.3 × 20 cm3. The scintillator bars are made of polyestyrene, doped with PPO (1%) and POPOP (0.03%), to shift its emission spectrum peak to 420 nm, they have a reflecting coating of TiO2. The scintillator bars have a hole of 1.7 mm diameter in the middle, a wavelength shifting (WLS) fiber of 1.5 mm diameter is inserted for light collection, the gap between the fiber and the scintillator is negligible due to the low air density. The WLS fiber is multi-clad type with cylindrical cross-section, model: Y11(200) MS made by Kuraray, their attenuation lengths is 350 cm and, their absorption and emission spectrum have peaks at 430 nm and 476 nm, respectively [5].
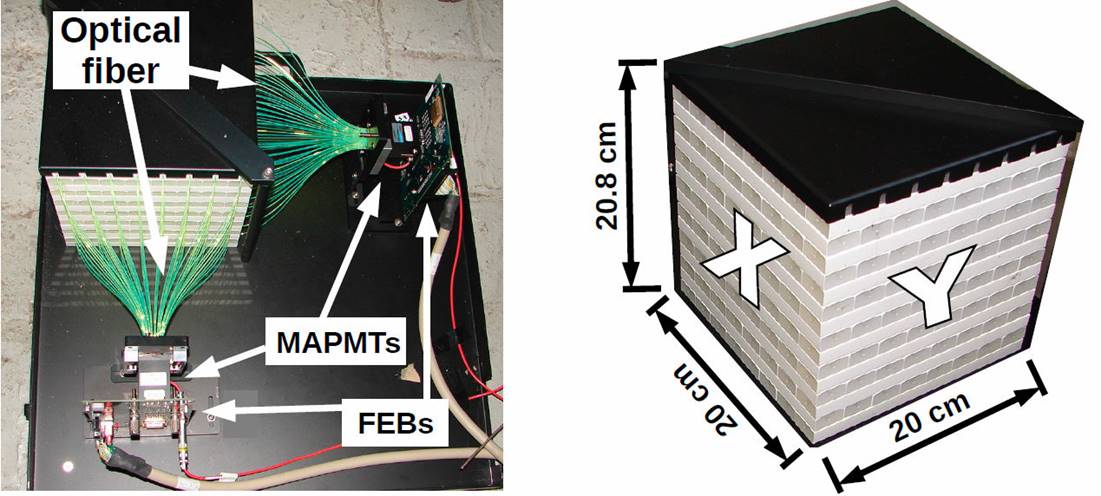
Figure 2 Photos of the mini-SciCR, the left photo shows the optical fibers coming out from the scintillator bars attached to multi-anode photomultiplier tubes (MAPMTs) that are connected to the front end boards (FEBs). The right photo shows the array of the scintillator bars and the dimensions of the detector.
Each side of the detector (X and Y ) has 64 scintillator bars, each bar has an inserted optical fiber; when a charged particle cross a scintillator bar, this bar emits light that is transported by an optical fiber attached to a 64 channel multi-anode photomultiplier tube (MAPMT) H8804 Hamamatsu Photonics K.K., which anodes are arranged in an 8 × 8 array with each anode measuring 2 × 2 mm2. The sensitive wave length is from 300 nm to 650 nm, which matches the emission spectrum of the WLS fibers [5]. The photons emitted in every scintillator bar are collected and transported by WLS fibers to the MAPMT, the signals are read by an analog to digital converter (ADC). Once the ADC signal distributions have been determined and a proper discriminator established to discard the noise, the threshold signal level of each bar may be fixed. For every event registered, the set of bars triggered establish the trajectory of the charged particles detected. To identify a neutron, a nuclear collision to produce a recoil proton is neccesary.
The readout system (shown in Fig. 3) consists of two front end boards (FEBs) attached to each of the MAPMTs, a data acquisition (DAQ) board connected to FEBs, and a trigger board (TB) connected to the DAQ board. The FEB is a combination of two ASICs (VA32 HDR11 and TA32CG), which is employed to multiplex pulse height information from each anode of a 64 channel MAPMT and make a fast triggering signal. The VA32 HDR11 has preamplifiers for 32 input channels and shapes its output with a slow Gaussian-like shaper with a peak at 1 μs. The TA32CG has discriminators to make a hit signal (peak at 80 ns) if a MAPMT anode signal exceeds the threshold level [6].
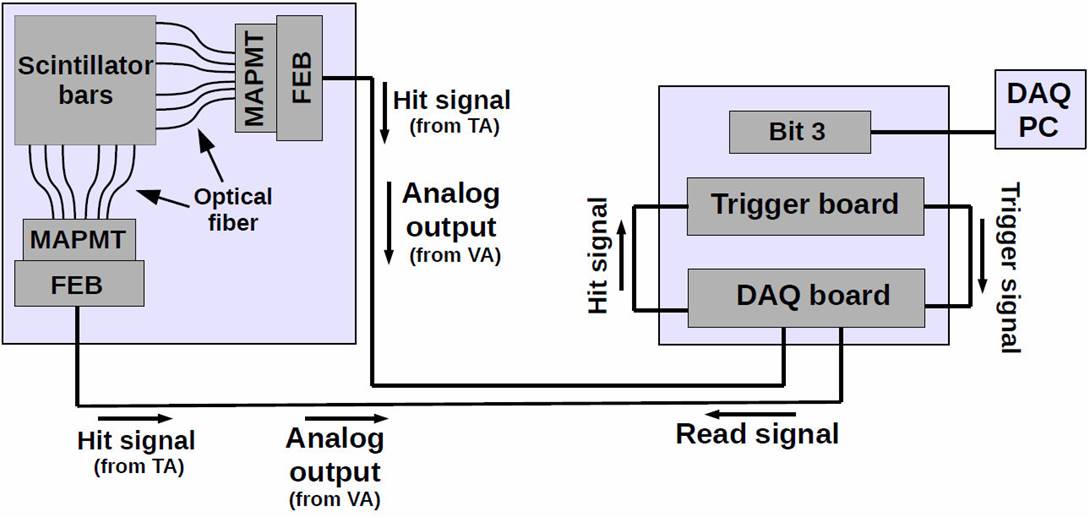
Figure 3 Readout system of the mini-SciCR. The photons produced in the scitillator bars are collected by WLS fibers and transported to MAPMTs, they are converted to current pulses and sent to FEBs (see left box). When a signal exceeds a certain discriminator level at the FEBs a hit signal is sent to the TB through the DAQ board. The trigger signal is created by the TB (see right box) and sent back to the FEBs as the read signal (see left box). After about 10 μs, the multiplexed analog output is sent to DAQ board, converted to digital values and sent to the computer for recording. The dead time of ADC reading is around 1 ms.
The DAQ board may readout eight MAPMTs. Each of the eight channels has line drivers to control the FEB’s ASICs and a flash ADC (FADC) to digitize the multiplexed analog signals. Programmable logic devices, CPLDs and an FPGA, are used in order to allow a flexible control of the data acquisition process. A CPLD (Xilinx XC95288), which generates control signals for each FEB, also provides a control sequence for digitization and storage of data into a FIFO. An FPGA (Xilinx XCV600) is connected to all CPLDs on the DAQ board to determine the timing to start readout and to switch data taking modes. It can also control timing to hold the peak of the shaped pulse using a fast triggering signal from each TA32CG [6]. The Trigger Board (TB) is connected to the DAQ board making the trigger signal. Thus a hit signal is obtained when there is a signal from the upper 32 or the lower 32 MAPMT channels. The trigger signal is created by coincidence of the X side upper and the Y side upper hit signals, and/or X side lower and Y side lower hit signals.
4. Calibration of the mini-SciCR
4.1. Calibration with the help of a Monte Carlo simulation
We made a Monte Carlo simulation (MC simulation) of the mini-SciCR. In this process, we injected seven different kinds of particles: positive and negative muons, electrons, positrons, gamma rays, neutrons and protons, in the energy range from 100 MeV to 9 GeV, with incident zenith angles between 0° and 85° and angular injection distribution uniform at the top of the detector. The behavior of particles inside of the detector was numerically simulated by the Geant4 system of codes.
We calibrated each scintillator bar of the mini-SciCR using the following method:
We obtained the spectrum of each scintillator bar from the results of the MC simulation, when muons were injected at the top of the detector with kinetic energy range from 400 MeV to 1 GeV, at zenith angle of 0 ° , protons (1 GeV) were also used. Each spectrum has two peaks easy to identify (see Fig. 4): from left to right, the left peak is generated by noise and low energy background radiation (noise peak) and the right peak is produced by the particles (particle signal peak).
For each spectrum we fixed a gaussian curve at the particle signal peak (see Fig. 4), and calculated the maximum of this gaussian curve that represents the typical energy deposited by the particles. The same process was made to find the maximum of the noise peak.
We take into account that: 1) the maximum of the noise peak represents the relative zero (0 MeV), 2) the maximum of the particle signal peak represent the typical energy deposited by muons, 3) high energy muon deposit ~ 2 MeV per g/cm2, and 3) a scintillator bar has 1.3 cm of vertical thickness and its density is 1 g/cm3. Then the distance between the maximum of the noise peak and the maximum of the particle signal peak is equivalent to ~ 2.6 MeV.

4.2. Calibration with data
One of the main properties of high energy muons is its penetrating power. We used this property to calibrate the channels of the mini-SciCR on data recorded. To attenuate the intensity of both the electromagnetic component and low energy nucleonic componet of the secondary cosmic rays, we put 5 cm of lead over the detector. Thus, we can assume that the data recorded under the above conditions are dominated by high energy muons (see also [1]). In Fig. 5, we show the spectrum obtained with data of the same scintillator bar shown in Fig. 4.
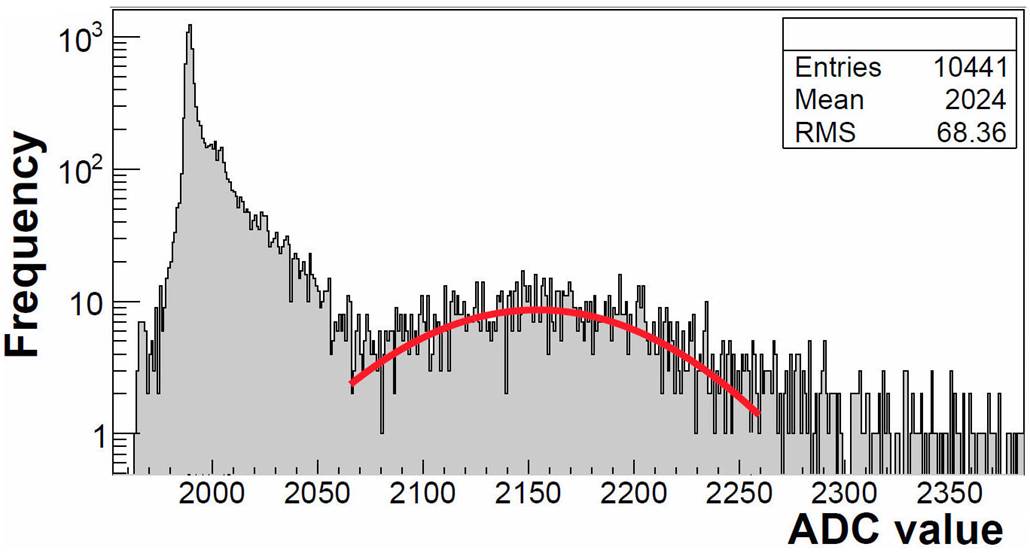
Figure 5 Spectrum obtained with data of the same scintillator bar shown in the Fig. 4. Data were recorded with 5 cm of lead over the mini-SciCR.
To get the distance between the maximum of the noise peak and the maximum of the particle signal peak on data recorded, that it is equivalent to ~ 2.6 MeV, we followed the same process made with the simulation data.
Empirically we found that 0.8 MeV is a good threshold to separate the noise signals from cosmic ray signals in each scintillator bars. A signal is considered noise if it is less or equal than 0.8 MeV, a signal is cosidered produced by a cosmic ray if it is greater than 0.8 MeV.
5. Method developed with the results of the Monte Carlo simulation to distinguish the neutron signals from gamma ray signals
Before starting the explanation on how we separated the neutron signal from the gamma ray signals, the readers must bare in mind that both neutrons and gamma rays do not deposit their energy directly at the plastic scintillator: a nuclear collision is necessary for a neutron to produce a recoil proton, and a pair production is necessary for a gamma ray.
To discriminate neutral emission (neutrons and gamma rays) from charged particles, we implement a system of anti-coincidence (via software) between the edge bars (only top and lateral) and the internal bars of the detector (see Fig. 6). A signal is considered as coming from a charged particle when it triggers at least one edge bar and one or more internal bars (see left part of Fig. 6). Neutral emission signals are therefore those that do not trigger an edge bar but trigger one or more internal bars (see right part of Fig. 6).
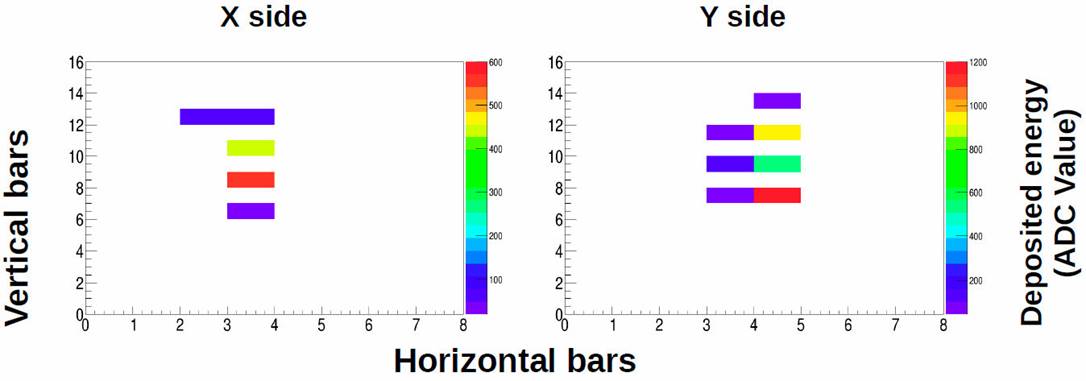
Figure 6 Scheme of the anti-coincidence system between adges bars (grey color) and internal bars (white color) at the mini-SciCR to discriminate neutral emission from charged particles.
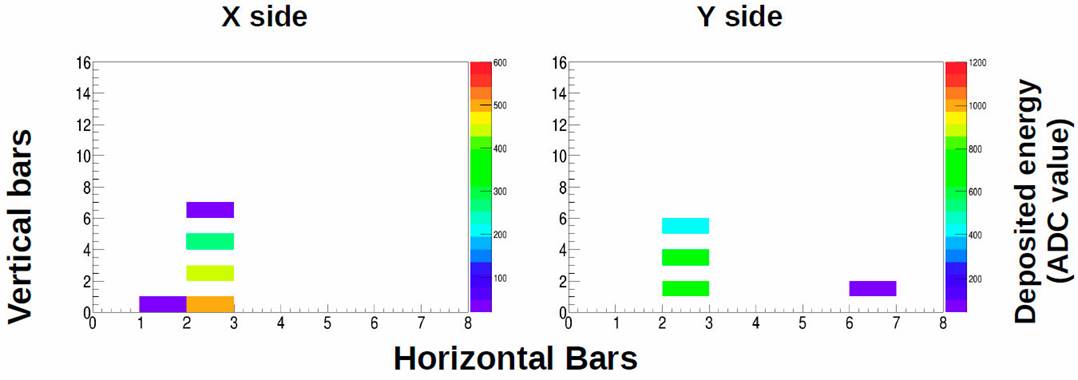
In Figs. 7 and 8, we show simulated tracks of a neutron and a gamma ray respectively, both with 100 MeV kinetic energy, injected at an incidence angle of 0 ° on the mini-SciCR. In these figures we can see that both tracks did not trigger the edge scintillator bars (top and lateral). According to the color scale, the neutron deposits more energy per bar than the gamma ray.

Figure 7 Track left by a neutron with 100 MeV kinetic energy, injected at an incidence angle of 0o (results of MC simulation).
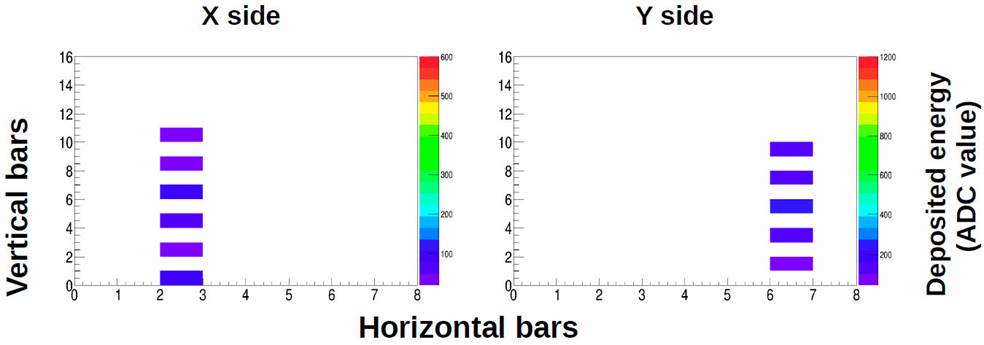
Figure 8 Track left by a gamma ray with 100 MeV kinetic energy, injected at an incidence angle of 0o, results of MC simulation.
To establish criteria to separate neutron signal from gamma ray signal in the mini-SciCR, we used the aforementioned results of the MC simulation, to calculate the maximum energy deposited at a scintillator bar by each of these particles. The energy spectrum for neutrons and gamma rays were obtained from [7-9] respectively; we used an angular distribution: I(θ) = I(0°) cos4 θ. The main results of our simulation are summarized as follows:
The maximum energy deposited by neutrons with kinetic energy between 100 and 1,000 MeV is distributed in a broad band of energy from 0.8 MeV to ~ 30 MeV (see Fig. 9): the neutrons produce protons in a broad range of energy via nuclear collisions.
The maximum energy deposited by gamma rays with energy between 100 and 1,000 MeV is distributed in a narrow band of energy from 0.8 MeV to ~ 11 MeV, with a maximum around of 5 MeV (see Fig. 10): they produce a high energy electron-positron pair and, these new particles depostited part of their energy in a narrow band.
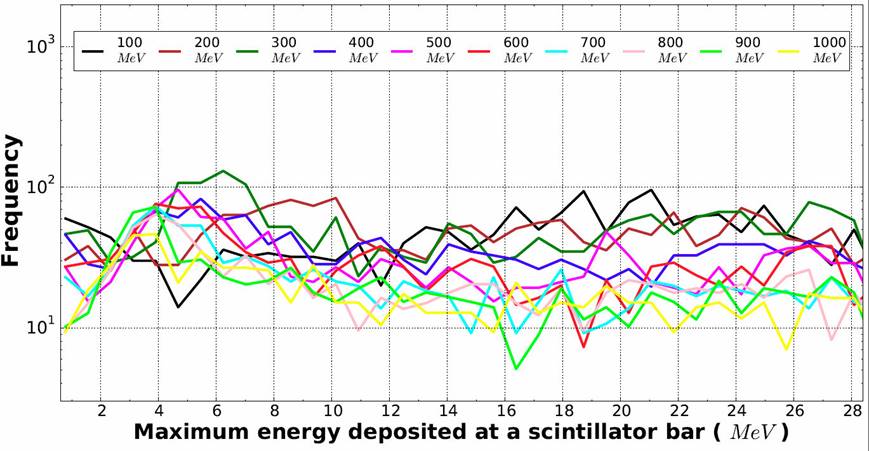
Figure 9 Distributions of the maximum energy deposited at a scintillator bar, by neutrons with kinetic energy between 100 and 1,000 MeV, injected with an incedence angle of 0 ° on the mini-SciCR. Results of MC simulation.
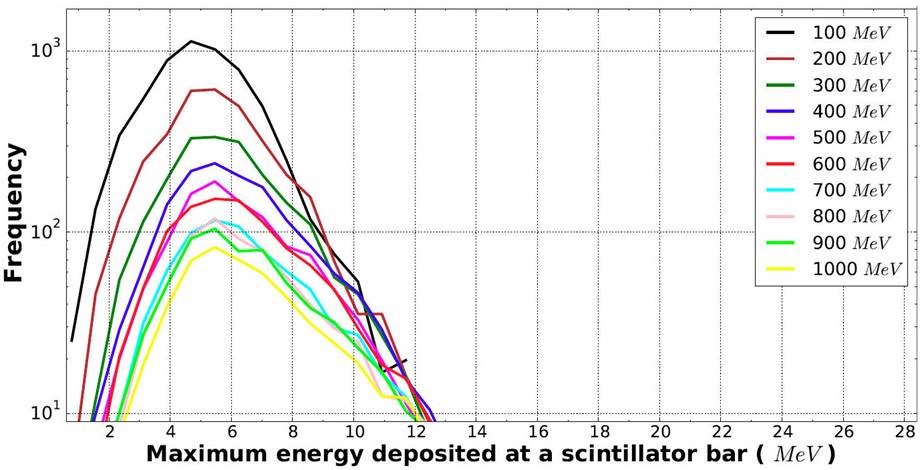
Figure 10 Distributions of the maximum energy deposited at a scintillator bar, by gamma rays with kinetic energy between 100 and 1,000 MeV, injected with an incedence angle of 0 ° on the mini-SciCR. Results of MC simulation.
In Fig. 11, we show the distributions of the maximum energy deposited in a scintillator bar by neutrons and gamma rays. Each distribution is the sum of the distributions obtained for all energies (from 100 to 1,000 MeV) and of the distribution obtained for all incidence angles (from 0° to 70°). We can see that the maximum energy deposited by neutrons is distributed in a broad band of energy, from 0.8 MeV to ~ 30 MeV, causing a distribution almost flat. The maximum energy deposited by gamma rays is concentrated in a narrow band from 0.8 MeV to ~ 14 MeV; the distribution shows a sharp increase from 0.8 to ~ 5 MeV, then a slower decrease from 6 to ~ 14 MeV and, with a maximum at ~ 5:5 MeV.

Figure 11 Distributions of the maximum energy deposited in a scintillator bar by neutrons and gamma rays, both with kinetic energy between 100 and 1000 MeV, injected at an incedence angle between 0 ° and 70 ° on the mini-SciCR. Results of Monte Carlo simulation.
In order to establish an appropriate energy deposition threshold to distinguish the neutron signals from gamma ray signals, we calculate the detector efficiency by applying our algorithm to the results of MC simulation; we define the efficiency as the ratio of the number of particles that correctly recognizes our algorithm and the total number of particles injected into the detector. The results are presented in Fig. 12.
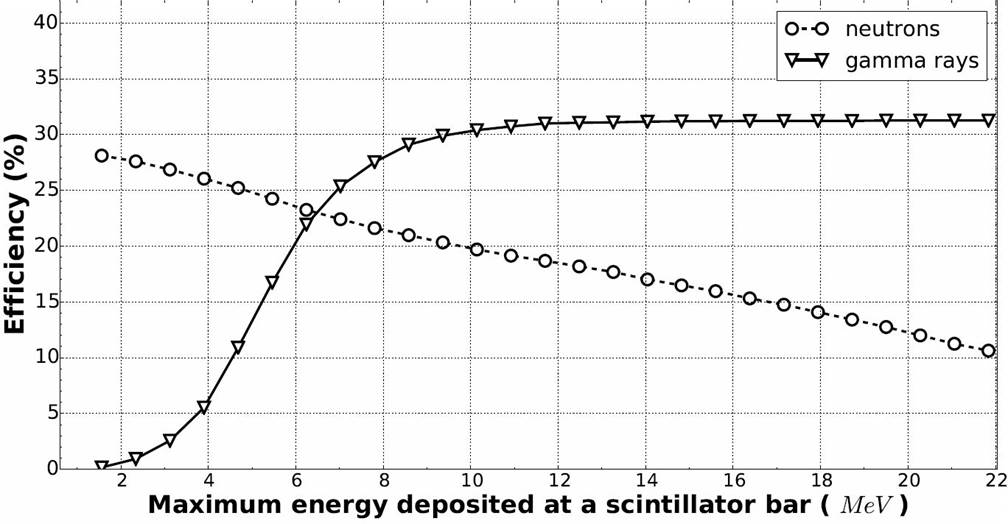
In Fig. 12, we can see that: 1) the efficiency curve to detect neutrons shows a slowly decrease as the maximum energy deposited increases, and 2) the efficiency curve to detect gamma rays shows a sharp increase from ~ 2 MeV to ~ 9 MeV, and it reaches its maximum practically at 10.9 MeV.
To separate neutron signal from gamma ray signal we chose 10.9 MeV as threshold, because it produces that, of total number of gamma rays injected into the detector only ~ 5% are confused with neutron signals, see Fig. 11; in addition, using this threshold we obtain practically the maximum efficiency to detect gamma ray ( ~ 31%), see Fig. 12.
Based on the results of the MC simulation, a suitable criteria for the estimation of the fluxes of neutrons and gamma rays in the real data recorded needs to consider essentially the regions of the distributions in Fig. 11 that do not overlap. A neutron is considered a particle that deposit a maximum energy at a scintillator bar greater or equal than 10.9 MeV (see Fig. 11), the neutrons whose maximum energy deposited is below this range are 35.5% of the total. A gamma ray is considered a radiation that deposit a maximum energy greater than 2 MeV and less than 10.9 MeV at a scintillator bar (see Fig. 11), the gamma rays that deposit an energy outside this range are 5.1% of the total.
6. Results of the analysis of mini-SciCR’s data
With the separation criteria established in the previous section, we proceeded to analyse the data recorded by the mini-SciCR for the period from October 2010 to July 2012, when the detector was in operation at the top of the Sierra Negra volcano. In Figs. 13 and 14 we present examples of tracks obtained with the mini-SciCR data that, based on the results of the MC simulation, could be assigned to a neutron and a gamma ray, respectively. Using the separation criteria established on the data, we could estimate an average counting rate of neutrons of 1, 463 ± 42 counts/hour, and an average counting rate of gamma rays is 8, 791 ± 129 counts/hour.

In Fig. 15 we show the counting rate of neutrons and gamma rays (normalized with their respective average quoted above) obtained with the criteria established based on the simulation. Figure 15 corresponds to a period when a Forbush decrease was registered by the mini-SciCR with an on-set March 8, 2012. The Forbush decrease reaches a minimum on March 9, the counting rate of neutrons presented a decrease of ~ 10%, and the counting rate of gamma rays a decrease of ~ 4%; both with respect to their average counting rate. We believe the significant difference in counting rate decrease for the particles considered species may be possibly due to the fact that the gamma rays recorded by the mini-SciCR at the top of the Sierra Negra volcano must come from higher energy primary cosmic rays as compared with the primary cosmic rays that produce the neutrons recorded.
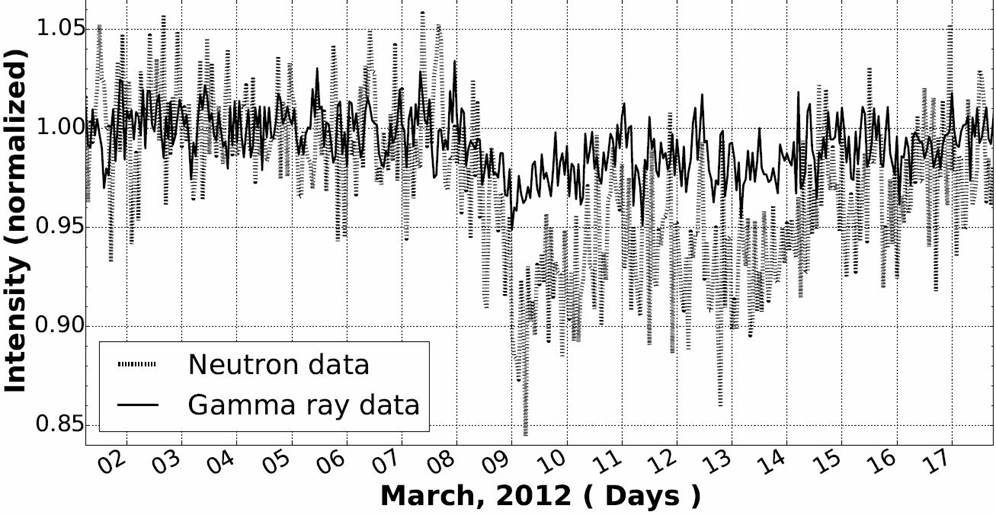
Figure 15 Forbush decrease on March 8, 2012, recorded by the mini-SciCR. The dotted line represent the neutron counting rate normalized to 1,434 counts/hour. The solid line represent the gamma ray counting rate normalized to 8,767 counts/hour.
Based on the results of the MC simulation, we estimate those neutron signals that are undistinguishable from gamma ray signals, the counting rate of neutrons must be approximately 1, 582 ± 65 counts/hour; if we omit the neutron signals that contribute to this counting rate and estimate those gamma ray signals that are undistinguishable from neutron signals, the estimated gamma ray counting rate should be approximately 8, 672 ± 136 counts/hour.
Considering the area of the detector (225 cm2) and the solid angle (2π), the counting rates obtained of neutrons and gamma rays per hour are equivalent to 3.1±0.1×10 -4 (cm2s sr) -1 and 1:70 ± 0:03 × 10 -3 (cm2s sr) -1 respectively.
Taking into account the efficiency of the mini-SciCR to detect neutrons and gamma rays for a threshold equal to 10.9 MeV (see Fig. 12), the estimated fluxes of neutrons and gamma rays are 1.6 ± 0.1 × 10 -3 (cm2 s sr) -1 and 5.5 ± 0.1 × 10 -3 (cm2 s sr) -1 respectively.
In Table I we show the neutron and gamma ray fluxes obtained with mini-SciCR and in other experiments. The results reported in the experiments were corrected for a latitude of 20 - N and an atmospheric depth of 600 g/cm2, making use of the curves reported in [10] and [11] respectively.
7. Summary
With a system of anti-coincidence between edge scintillator bars and internal bars, we were able to separate the neutral radiation signals (neutrons and gamma rays) and charged particles signals. Based on the maximum energy deposited in a scintillator bar by neutrons and gamma rays, estimated with the help of a Monte Carlo simulation, we established criteria that allowed us to separate neutron from gamma ray signals. These criteria do not produce a total separation of these radiations; however it does provide tools to make calculations to correct the observed counting rates.
We were able to estimate the fluxes of neutrons and gamma rays at the top of the Sierra Negra volcano (600 g/cm2) as 1.6 ± 0.1×10 -3 (cm2 s sr) -1 and 5.5 ± 0.1×10 -3 (cm2 s sr) -1 respectively.
The particle species separation methods developed here and in two previously published papers [1,2] provides us with the capability to make realistic estimates of the fluxes of muons, electrons, protons, neutrons and gamma rays in any detector using the scintillation techniques employed in the mini-SciCR.
As the mini-SciCR is a prototype of a larger detector, the Scintillator Cosmic Ray Telescope (SciCRT) that is now in operation in Sierra Negra [3], the methods developed will be applicable to the registers of this large detector, providing us with realistic estimates of the particle species that are detected and their relative abundances, being those part of the secondary flux arriving to the top of the Sierra Negra volcano, or generated by the interactions of the cosmic ray flux within the material of the SciCRT.

