


 nueva página del texto (beta)
 Inglés (pdf)
 Artículo en XML
 Referencias del artículo
 Enviar artículo por email
 Citado por SciELO
  Similares en
SciELO
Similares en
SciELO 
 Permalink
1. Introduction
Titanium oxide IV or titanium dioxide (TiO2) conformed by highly reactive oxygen and titanium, which are is the ninth element and seventh most abundant metal in the earth’s crust. It is a material abundant in the nature, thermally stable and relatively cheap [1]. This semiconductor material has become an increasingly important material, which attracts considerable attention in recent decades. Titanium dioxide also called titania crystallizes in three major different structures: anatase, rutile and brookite [2]. However, only rutile and anatase are used in the applications of TiO2. The brookite phase is the least stable, therefore, it is the least used [3]. Anatase is more chemically reactive than rutile [4], but rutile is the most thermodynamically stable phase and it is preferred for applications in pigments paints [5] and as UV absorbers thanks to its high refractive index (n = 2.9 for rutile and 2.4 for anatase) [6]. Almost all the used TiO2 white pigments are rutile particles with grain sizes in the micrometre scale. Approximately four million tons of this pigment are consumed annually worldwide. It is the most important pigment in the world [7]. Rutile TiO2 white pigments are used in many products every day from milk, toothpaste, paints, suncream, cosmetics, varnishes, textiles, paper, plastics, food and drugs. Depending on the application field, the size range of the TiO2 particles differs: nanoscale titanium dioxide is used for specific applications and is not used as food additives. TiO2 nanoparticles are a promising material for many applications and are used in a multitude research projects [8]. The decrease of the TiO2 particle size to nanometric dimensions increases the yield as a result of the increase in the area of the surface with respect to the “bulk” sizes [9]. So, the photo-catalytic activity is increased considerably through the high surface-to-volume ratio of the nanoparticles as compared to that of microparticles. The anatase is the most requested crystalline phase for applications in dye-sensitized solar cell and photocatalytic [10]. More recently, the photocatalytic properties of TiO2 have been extensively investigated for applications that include photovoltaic energy, photo-assisted hydrogen production from water, water purification process, self-cleaning surfaces [11-14]. These TiO2 nanoparticles can be synthesized using different methods; however, some methods are very long and expensive processes, either because of the synthesis conditions or because of the equipment they use [15-17]. On the other hand, in some projects in the area of photocatalysis the TiO2 nanoparticles are used suspended in the aqueous medium [18-20]. However, in other areas of research the need to have TiO2 in immobilized form is indispensable. One way to have the immobilized TiO2 is in the form of fibres and preferably in the anatase phase since has been reported as the crystalline phase of greatest photocatalytic activity [2]. One way to obtain these fibres is through the electrospinning technique. This is an economical and versatile technique that allows the manufacture of fibres of different polymeric materials in which the shape, surface area and fibres diameter can be controlled [21]. TiO2 nanofibres manufactured with the electrospinning technique and the solgel process provide the advantage of high porosity and a high surface area [22]. The electrospinning method continues to attract attention in research fields such as biotechnology, the textile industry and the environment where TiO2 nanofibres are used [23-26].
In this work we report the synthesis and characterization of TiO2 nanofibres obtained by electrospinning technique and annealing at different temperatures. The effects of the annealing temperature on chemical composition and structural properties of the TiO2 nanofibres were studied systematically by SEM-EDS, X-ray diffraction, Raman spectroscopy and photoluminescence.
2. Materials and chemicals
In order to obtain titanium dioxide nanofibres titanium (IV) n-butoxide (TBT), (Ti(OBu)4, (Mw= 340.32 g/mol with 97% purity) and polyvinylpyrrolidone (PVP, Mw =1300000 g/mol with 99.9 % purity) were used purchased from Sigma-Aldrich company, glacial acetic acid and ethanol from Baker supplier. All chemicals precursors were used as they were received without subsequent purification. Deionized water (> 18 MΩ cm -1 ) was used at all times to wash the laboratory equipment used during the nanofibres preparation.
3. Electrospinning equipment
Figure 1 shows a schematic diagram of the used electrospinning system. It contains an infusion pump (kd Scientific, KDS 100) used for controlling the feeding speed of 0.5 mL/s, a syringe with stainless steel needle (0.514 × 32 mm) by which is expelled the precursor solution, a high voltage source (EQ series Matsusada Precision) including two electrodes, one is connected to the terminal section of the stainless steel needle and the other is connected to the collector plate (aluminium sheet with 5 cm of diameter) where the nanofibres are deposited. The separation between the needle tip and the collector plate is called “the working distance”, which was maintained at 15 cm. When the electrical potential between both electrodes is enough and exceeds the surface tension of precursor solution, final nanofibres are expelled to the collector in an interconnected network shape.

4. Preparation of TiO2 nanofibres
In order to prepare TiO2 nanofibres the method reported by Li and Xia [27] was used but with the modification in the amount of PVP and the titanium molecular precursor. Inside a glove box with nitrogen atmosphere was prepared the PVP viscous solution in ethanol at a concentration of 1 g/20 mL and placed in constant stirring during 2 h. In another container was prepared a solution of 6 g of Ti(OBu)4 in 6 mL of acetic acid with constant stirring during 30 min. Then, both solutions were mixed under constant stirring during 2 h with the aim to obtain a transparent precursor solution of electrospinning titanium. The precursor solution was removed from the glove box and immediately loaded to the syringe to be electrospinning with an electrical potential of 15 kV. The white and continuous composite nanofibres were finally deposited on the collector plate. The white colour is the result of the formation of titanium dioxide as was revealed by the chemical analysis results presented and discussed below. For the thermal treatment of the electrospinning nanofibres was not used a special gas mixture as atmosphere. The oxidation was performed in the laboratory air atmosphere using different temperatures in a wide range of 0 to 1000°C as oxidation temperatures for 3 h in an oven (trademark 1300 Furnace) for each temperature. The temperature increase used was 4°C/min and after annealing, they were allowed to cool to room temperature for further characterization.
5. Characterization equipment
The nanofibres surface morphology and chemical stoichiometry were obtained by Scanning Electron Microscopy and Energy Dispersive Spectrometry (SEM-EDS), which were carried out in a System LEO 438VP, with W.D. of 26 mm using a pressure of 20 Pa. The crystalline phase and quality structure of the typical nanofibres were determined with a Bruker D8 Discover diffractometer using the copper Kα radiation (λ = 1.5406 Å) at 40 kV and 40 mA with parallel beam geometry. Raman scattering experiments were performed using the 6328 Å line of a He-Ne laser at normal incidence for excitation. The light was focused to a diameter of 6.0 µm at the sample using a 50 × (numerical aperture 0.9) microscope objective. The nominal laser power used in these measurements was 20 mW. Care was taken to avoid the heating of the sample to the point of changing its Raman spectrum. Scattered light from sample was analyzed using a micro-Raman system (Lambram model of Dilor), a holographic notch filter made by Kaiser Optical System, Inc. (model superNotch-Plus), a 256 × 1024-pixel CCD used as detector cooled at 140 K using liquid nitrogen, and two interchangeable gratings (600 and 1800 g/mm). Typical spectrum acquisition time was limited to 60 s to minimize the sample heating effects discussed above. The photoluminescence measurements were carried out using a He-Cd (Omnichrome-Series 56) laser emitting at 325 nm with an optical excitation power of ∼ 15mW at room temperature. The radiative emission from the sample was focalized to the entrance slit of a HRD-100 Jobin-Yvon double monochromator with a resolution better than 0.05 nm, and detected with an Ag-Cs-O Hamamatsu photomultiplier with spectral response in the range 350-1000 nm.
6. Experimental results and discussion
Taking into account the experimental conditions of the preparation of titanium dioxide, it may be hypothesized that the formation of the TiO2 nanofibres is carried out through the hydrolysis and condensation reactions of the TBT:
As TBT is a highly reactive metal alkoxide precursor product of the presence of highly reactive alkoxide (OR) groups, then when it is expelled from the stainless steel needle, it begins to react with the water vapor contained in the air forming amorphous titania particles with small and uniform sizes in the electrospun composited nanofibres of PVP [28]. The role of acetic acid and ethanol used in the preparation of the precursor solution is to retard the hydrolysis reaction [29]. The white colour obtained in the samples and the results presented below validate the postulated hypothesis [30]. The transformation of the amorphous to crystalline phase of the titania fibres was developed by annealing at high temperature.
In order to have a more profound knowledge regarding the chemical composition of the obtained titanium oxide nanofibres, energy dispersion spectroscopy (EDS) measurements were made to the annealing samples. The measured EDS spectra indicate clearly the presence of titanium and oxygen atoms. Besides, the analyses show that the samples contain a significant amount of carbon and other residual impurities. The most of residual impurities contained in the nanofibres come from the nanofibres precursors and the PVP carrier. The results of such EDS measurements for the titanium and oxygen atoms of all the studied samples are presented in Table I. These experimental results can be explained as follows: the as-synthesised samples are amorphous and contain a large amount of residual impurities, which upon annealing, most of them are desorbed and the host atoms are rearranged to form the TiO2 crystalline phases, which result in a significant decrease in the nanofibres diameter, see Table I. In addition, the oxygen molar concentration decreases and that of titanium increases, which tend to the ideal molar concentrations as the annealing temperature increases. As the TiO2 crystalline phases, anatase and rutile, they contain two units of TiO2 in the unit cell [31], that is, two titanium atoms and four oxygen atoms. Thus, the atomic weight of the TiO2 ideal unit cell is ∼ 159.796u corresponding to 40.049% oxygen atoms and 59.951% titanium atoms. Then, when a stoichiometric deviation of the ideal unit cell occurs it could establish a correspondence between vacancies or interstices of some of the constituent elements of the compound (VO, VTi, Tii, Oi). From these results is observed that the annealing temperature of 500°C is the one that gives a better stoichiometric compound and that starting from it is observed that nanofibres annealed at temperatures lower than 500°C contain a low titanium concentration and a high oxygen concentration, which indicates that oxygen can be found in interstices and antisites of the unit cell, which generates a high concentration of structural defects. From Table I can be seen that at higher annealing temperatures than 500°C there is a slight increase in the presence of titanium in the material and a slight absence of oxygen, which indicates that titanium has been incorporated into the unitary cell as an interstice and/or in antisites, indicating that there are oxygen vacancies generated by desorption, but the molar fractions are maintained close to the ideal stoichiometric molar composition, as can be seen in Table I. For this annealing temperature range, there are excess of titanium and lack of oxygen atoms, which favor the phase crystalline transformation, from anatase to rutile. Although, the density of structural defects decreases significantly, as will be discussed later.
Table I They are presented the temperatures at which the nanofibres were annealed. In addition, titanium and oxygen concentrations in synthesized TiO2 nanofibres that were estimated by EDS are included. The average errors with that were calculated percentage masses and molar fraction of different elements are presented. Additionally, they are shown the mean diameters of TiO2 nanofibres.
| Sample |
|
|
|
|
|
|
|---|---|---|---|---|---|---|
| M0 | 0 | 18.9 ± 00.32 | 41.10 ± 0.69 | 81.10 ± 0.77 | 58.90 ± 0.56 | 137.00 |
| M2 | 200 | 20.79 ± 0.66 | 44.01 ± 1.40 | 79.21 ± 1.48 | 55.99 ± 1.05 | 120.05 |
| M3 | 300 | 24.49 ± 0.58 | 49.26 ± 1.18 | 75.51 ± 1.30 | 50.74 ± 0.87 | 117.50 |
| M5 | 500 | 34.20 ± 0.60 | 60.87 ± 1.08 | 65.80 ± 1.41 | 39.13 ± 0.84 | 114.62 |
| M6 | 600 | 35.05 ± 0.65 | 61.77 ± 1.15 | 64.95 ± 1.44 | 38.23 ± 0.85 | 115.00 |
| M7 | 700 | 37.03 ± 0.54 | 63.77 ± 0.93 | 62.97 ± 1.24 | 36.23 ± 0.71 | 115.02 |
| M8 | 800 | 37.03 ± 0.54 | 63.78 ± 0.93 | 62.97 ± 1.33 | 36.22 ± 0.76 | 115.05 |
Figure 2 shows the images of scanning electron microscopy (SEM) of the four typical samples that were synthesized and annealed at different temperatures a) 500, b) 700, c) 800 and d) 1000 ° C. The micrographs illustrate clearly the presence of solid nanofibres with a defined shape, a smooth surface and without the presence of interconnections and defects called beds, ribbon-like and pores through their longitudinal directions. It is evident the presence of nanofibres with almost completely circular shape at nanometric scale. The same diameters and morphologies of the samples in different places of collector plate were observed indicating the homogeneity of the nanofibres. It is observed that the excess of oxygen and lack of titanium in the structures significantly alters the diameter and surface morphology of the TiO2 nanofibres. As is observed in Fig. 2 a and b, when there is an excess of oxygen the surface morphology is smooth and when the nanofibres chemical composition tends to the stoichiometry, the nanofibres surface morphology becomes rough and segmented. This occurs mainly for samples annealed at temperatures higher that 700 ° C corresponding to the rutile crystalline phase, as can be observed in the micrographs of typical samples, see Fig. 2 c-d. Based on more than 100 measurements taken from the SEM micrographs of the M5 sample, a diameter distribution histogram was obtained, see inset of Fig. 3: a Gaussian fit with a narrow size distribution and a maximum diameter value of 114.62 nm can be detected. Absence of a bimodal distribution in the distribution diameter size histogram suggests that the composite nanofibers are electrospun from a single and uniformly thinning jet extends from the nozzle to the collector plate. The sample annealed at 500 ° C ensures the formation of stoichiometric TiO2 system. A comparable analysis was performed for the rest of the samples and the results are presented in Fig. 3 and Table I. It is observed from Table I that the nanofibres diameter decreases approximately 16%, which is product of the PVP that disintegrates together with all the waste of the reagents used in the manufacturing process of titania nanofibres caused by the heat treatment. The mean diameter of the nanofibres decreases exponentially as a function of the annealing temperature tending to 114.89 nm with an activation energy of 13.08 meV, which could be associated with the desorption of oxygen molecules, generating vacancies and favouring the crystalline phase transformation, as was discussed. Therefore, the annealing temperature can be used to control the stoichiometry, crystalline formation and diameter of the titanium dioxide nanofibres.
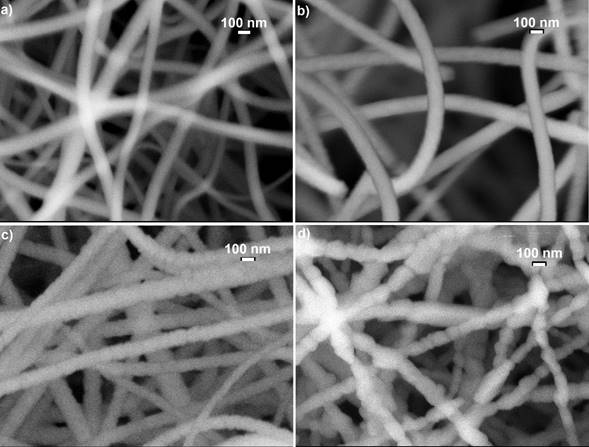
Figure 2 It illustrates the images of scanning electron microscopy (SEM) of the four TiO2 nanofibres annealed at a) 500, b) 700, c) 800 and d) 1000 ° C, which clearly show the effect of the annealing temperature on the surface morphology of the TiO2 nanofibres.
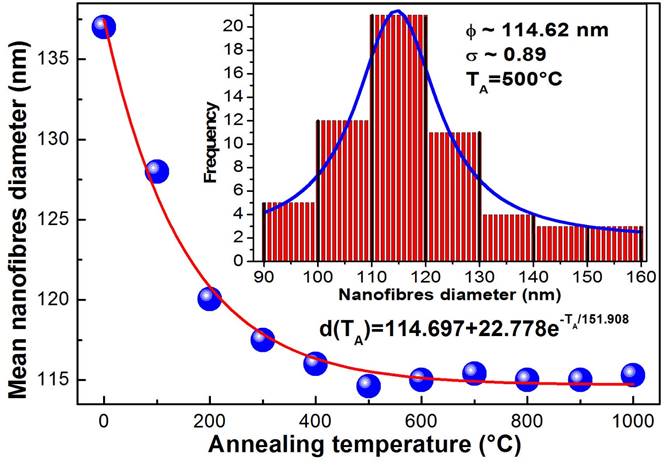
Figure 3 It shows the dependence of the nanofibres diameter with annealing temperature. The solid line corresponds to an adjustment by least squares, which corresponds to a decreasing exponential function.
The as-deposited TiO2 nanofibres are structurally amorphous and become into crystalline after annealing them at a sufficiently high temperature in an air atmosphere, which causes the annealed nanofibres transform their crystalline phase from amorphous→ anatase→ anatase-rutile mixed→ rutile. In order to determine the structural quality and the crystalline phase of the obtained nanostructures, X-ray diffraction analysis and Raman scattering of typical samples were performed. Figure 4 shows the XRD patterns of two typical TiO2 nanofibres obtained at the annealing temperatures: a) 500 and b) 800 ° C. It is observed from XRD patterns that annealed TiO2 nanofibres are in polycrystalline nature. The first diffractogram exhibits five main diffraction peaks at 2θ = 25.24, 37.69, 48.02, 54.23 and 62.70 ° corresponding to the crystalline planes (101), (004), (200), (105) and (204) of anatase phase (JCPDS cards # 00-021-1272). Similarly, the second diffractogram presents three main diffraction peaks at 2θ = 27.37, 36.00 and 54.40 ° that are associated to the crystalline planes (110), (101) and (211) of rutile phase of TiO2 (JCPDS cards # 00-021-1276), whose preferential growth directions are (101) for anatase and (110) for rutile. From X-ray patterns is observed that the full width at half maximum (FWHM) of the main peak decreases as is increased the annealing temperature, which indicates that the mean diameter of the nanocrystals that form the nanofibres increases. The average crystallite size of prepared TiO2 nanoparticles was was estimated by applying Scherrer-Debye equation to the dominant peak of the diffraction data and taking an average [32,33], obtaining for the annealing at 500 ° C a mean diameter of 10.3 nm and 32.9 nm for the nanofibres annealed at 800 ° C, which correspond to anatase and rutile crystalline phases. These results indicate that as the annealing temperature increases, in addition to the crystalline phase transformation, the size of the nanocrystal also increases. By refinement of X-ray diffraction experimental data finds the unit cell parameters for the anatase crystalline phase. For the 500 ° C nanofibres the parameter average values are a = 3.7852 Å and c = 9.5139 Å. The angle between them corresponds to 90 ° . Similarly, for 800 ° C nanofibres, which corresponds to rutile crystalline phase, the unit cell parameters are a = 4.5937 Å and c = 2.9587 Å. In addition, the weak peaks of both diffractograms were multiplied by a numerical factor to improve them, which were deconvoluted, these were assigned by the databases mentioned above of each crystalline phase, see the insets in Fig. 4.
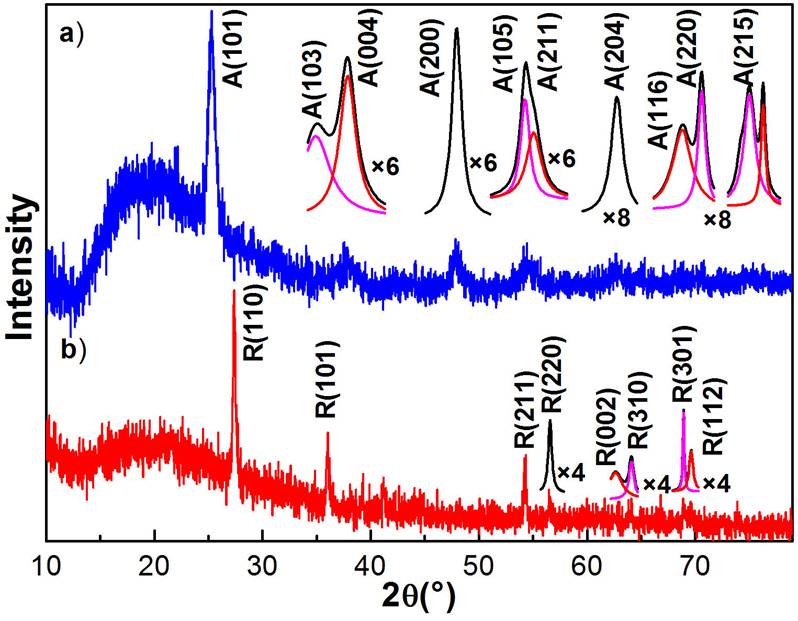
Figure 4 It shows the X-ray diffraction patterns of two typical TiO2 nanofibres annealed at 500 and 800 ° C. a) Anatase crystalline phase (JCPDS cards # 00-021-1272) and b) rutile crystalline phase (JCPDS cards # 00-021-1276). It is observed that the width at medium height of the main peak of the crystalline phases narrows, which indicates that the size of the nanocrystals that make up the nanofibres increases with the increase of the annealing temperature, obtaining for these cases, a mean diameter of 10.3 nm for anatase phase and 32.9 nm for the rutile phase. Deconvolutions of weak peaks of the two diffractograms are shown in insets of figure, which were assigned by the databases of each crystalline phase.
Figure 5 depicts the Raman spectra measured on the TiO2 fibres at 300 K. As can be observed in figure, the Raman spectra show different vibrational bands that depend on the crystalline phase, which were obtained by annealing at high temperatures. In addition, the effect of temperature is strongly expressed in the vibrational bands intensity. Before comparing the experimental results with previously reported data, one first presents an overview of the first-order Raman scattering from TiO2 crystalline structure type. Anatase TiO2 unit cell belongs to the
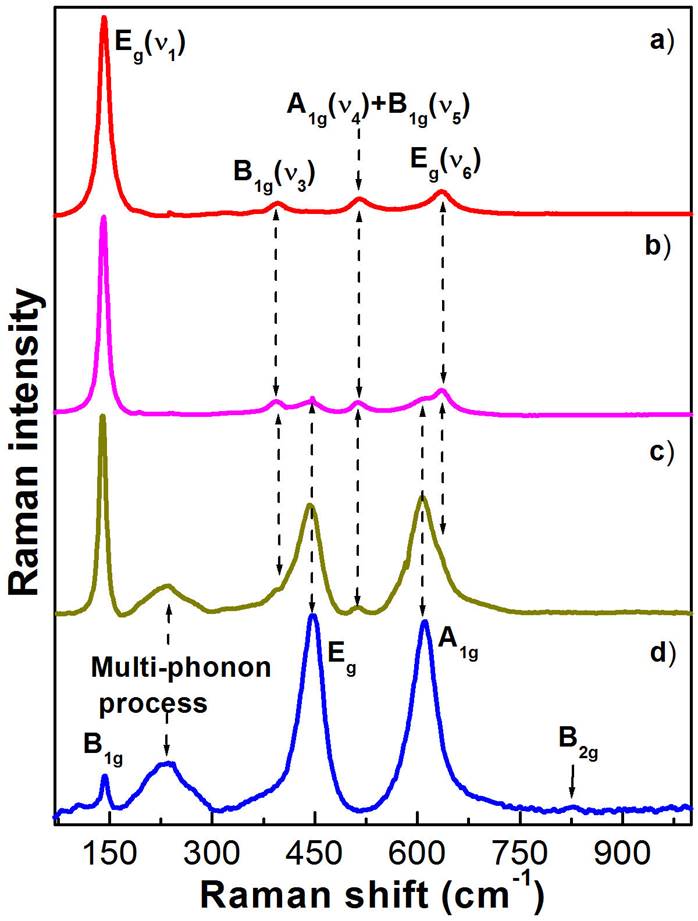
Figure 5 Raman spectra of the TiO2 nanofibres annealed at a) 500, b) 600, c) 700 and d) 800 ° C. a) The Raman spectrum of the anatase-type nanofibres shows the E g modes at 142.3.8 and 634.3 cm -1 , the B 1g mode at 396.3 cm -1 , and a doublet of A 1g and B 1g modes at 518.3 cm -1 . d) Raman spectrum of the rutile nanofibres, showing the B 1g mode at 139.8 cm -1 , a multi-phonon process mode at 234.3 cm -1 , E g mode at 440.7 cm -1 , A 1g mode at 609.6 cm -1 , and B 2g mode at 825.5 cm -1 . b-c) They show the Raman spectra of the anatase-rutile mixed crystalline phases. In figure clearly is showed the crystalline phase evolution as function of annealing temperature.
Table II It presents the observed Raman shift (cm -1) of two TiO2 single crystal phases and their assignment reported in literature.
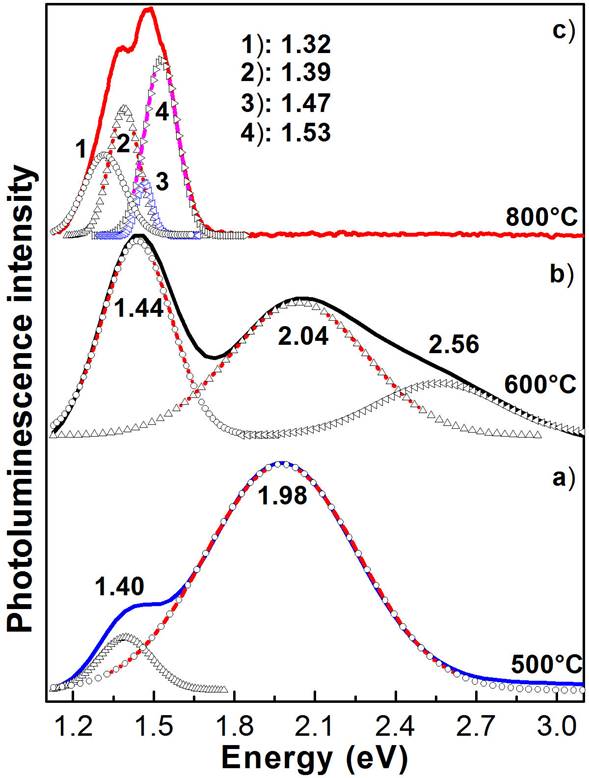
Figure 6 shows the room-temperature photoluminescence spectra of the three typical TiO2 nanofibres annealed at 500, 600 and 800 ° C, which correspond to three TiO2 crystalline phases of interest. In figure is clearly observed the dependence of the TiO2 nanofibres photoluminescence of the annealing temperature. As is observed in figure, the photoluminescence of fibres annealed at temperature at 500 ° C presents two radiative transitions at 1.40 and 1.98 eV that are associated with levels of surface traps, which are induced by the presence of oxygen vacancies and/or carbon complexes [41,42]. These have a very wide FWHM, which is indicative of a poor crystalline quality of the TiO2 nanofibres. Besides, it is observed from the figure that the radiative transitions do not correspond to band-band transitions, because of these ones are in lower energies of the band gaps [43]. As it was reported [43], when the annealing temperature increases the crystalline phase transformation occurs, for temperatures between 400-500 ° C it is anatase, while for the temperatures between 500 and 700 ° C the crystalline anatase-rutile mixed crystalline phases are obtained. Moreover, for temperatures higher than 700 ° C only the rutile crystalline phase prevails. The photoluminescence spectrum of the anatase-rutile mixed presents radiative transitions from both crystalline phases, with the dominant band being at 1.44 eV, which could be associated with the rutile phase and whose origin is associated with carbon complexes [42], and two other radiative bands at 2.04 and 2.56 eV associated with the anatase crystalline phase. Finally, the PL spectrum of the sample annealed at 800 ° C, which corresponds to the pure rutile crystalline phase has four radiative bands at 1.32, 1.39, 147 and 1.53 eV, which could be caused by the alcohoxides as has been reported by Abazovic´ et al.
7. Conclusions
In this work, the successful synthesis of TiO2 nanofibers was reported obtained by the electrospinning technique at room temperature. By thermal treatments in a wide range of temperatures, the crystalline phase transformation was achieved, from amorphous to rutile, through anatase and its crystalline phases mixed. During the thermal treatments the oxygen loss is evident, which was evaluated by EDS, indicating generation of oxygen vacancies, which favour the crystalline phase transformation. By Raman spectroscopy the crystalline phase transformation was systematically evaluated as a function of annealing temperature. The experimental results showed that the polymorphs were: (1) pure anatase phase for films as-deposited and annealed lower than 600 ° C, (2) anatase-rutile mixed crystalline phase for films annealed at less than 800 ° C and (3) pure rutile for films annealed at 800-1000 ° C. Therefore, the transformation in the crystal structure from anatase phase to rutile phase is due to oxygen vacancies. The room-temperature photoluminescence presented radiative bands whose main band redshifts from 2.56 to 1.32 eV, as the crystalline phase of TiO2 nanofibres transformed from anatase to rutile in the investigated annealing temperature range.

