


 text new page (beta)
 English (pdf)
 Article in xml format
 Article references
 Send this article by e-mail
 Cited by SciELO
  Similars in
SciELO
Similars in
SciELO 
 Permalink
1. Introduction
Plant extracts have a role of excellence in people’s lives. Among these, we can mention the essential oils and vegetables [1,2]. These products are used for a wide range of purposes, and these applications are designed, in most cases, to improve the quality of life in a society. In the food context, vegetable oils are indispensable because they provide essential nutrients, such as unsaturated fatty acid and fat/soluble vitamins, which have great health benefits and can not be synthesized by the human body [3-9]. Producing good quality vegetable oil is not so simple, not to mention the big routes of adulteration of industrial processes, thus causing economic losses to consumers and even food safety problems. For these and other factors, the industry is more conscious in the pursuit of quality of goods and better quality standards [10,11]. In this work, we present a vibrational approach of AND COP and CDB, originating in the Brazilian north, in the Amazonian scenario, crossing information among their spectral natures, providing rapid resources in the characterization process of this type of samples [12,14].
Qualitatively, the results were obtained in order to compare the vibrational and molecular nature of the samples [15]. The analyzes were performed as the FTIR [16-18] and Raman [19,21] since these, combined with chemical methods, provide a good approach for a vegetable oil analysis. In this case, this approach provides advantages in the process of caracrization over other methods, which are not infrequently expensive, requiring the preparation of samples and, consequently, more time to obtain results [22-27]. Both techniques are complementary, so we can understand the behavior of the samples when they present different vibrational patterns. In order to more torough evaluations, the results were assimilated with DFT calculations [28] for a set of molecules known to be identified with the samples. These molecules represent oleic, linoleic, palmitic and copalic acids, which are directly associated with the oils under study.
2. Materials and methods
2.1 Vegetable Oils
The oils were obtained using the traditional procedures of the local culture, by means of mechanical pressing the CDB almonds preceded by the collection of the fallen hedgehogs from the trees. For AND and COP, direct extraction of an adult tree was carried out, whose resin flows from the stem of the tree stored in opaque plastic bags and finally in bags with aluminum coating.
2.2. Raman and FTIR spectrocopy
The Raman and FTIR scattering measurements were performed, respectively, in the Light Scattering Laboratories, using a Labram HR 800 spectrometer coupled to a Coupled Charge Device (CCD) detector, cooled by the Peltier system at -70 C with excitation of 633 nm in the range 80 to 3400 cm-1. The measurements were performed at room temperature with depolarized scattering and with the aid of an Olympus microscope and lens with focal length f = 50 mm and numerical aperture NA = 0.35, and an IRPrestige-21 Shimadzu Fourier Transform Infrared Spectrophotometer in with resolution of 4 cm-1, accumulation of 1 minute, in the region of 2100 cm-1.
2.3. DFT calculations
The calculations were generated by the Gaussian 09W computational package [29]. The core of the DFT method was the use of the basic set B3LYP 6-311g. The gradient corrected density functional theory with the three parameter hybrid function (B3) was used for the exchange part as well as the Lee-Yang-Parr (LYP) correlation function [32-35] (the correlation functional of Lee, Yang, and Parr, which has both local and non-local terms). The Lee-Yang-Parr (LYP) correlation function is considered as the cost-effective approach for the computation of molecular structure, vibrational frequencies and energy of optimized structures [36]. All these details were applied for a better comparison of the measured and calculated spectra. This model (DFT) is the most used because of the quality of the results, mainly for organic molecules.
3. Results and discussions
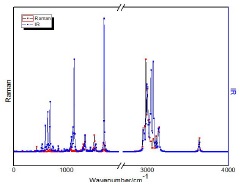
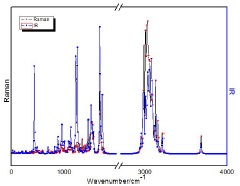
In Fig. 1 we show the layout of the experimental measurements for the sample. Table I contains the results of vibrational modes observed by the previously described methods. The calculations were obtained from the molecules of oleic, linoleic, linolenic and palmitic acids. The spectra shown in Fig. 1a) bring the modes present in FTIR, in regular scale inverted at the point of origin between 3500 - 650 cm-1. The Raman spectra in Fig. 1b), are on a scale ranging from 80-3500 cm-1. In the results of Table I, the vibrational modes in FTIR and Raman of the acids tested are shown. In this table, in addition to the vibrational signatures and their patterns, a set of graphs is presented that puts the results of the DFT (B3LYP) calculations with a horizontal cut in the region between 2000-2800 cm-1 because they do not present vibration modes.

Table I General vibrational patterns for calculated values of oleic, linoleic, palmitic and copalic acids. Results from Gaussian 09 andOrigin 8 graphics.
| AFs | Calc. Bands | Assignment | Structure | B3LYP | |
| ωRaman | ωFTIR | ||||
| Oleic | 1083 | 767 | ρω(CH2) | 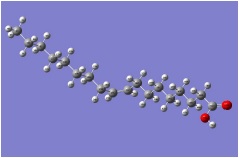 |
 |
| 1328 | 1086 | ρt(CH2) | |||
| 1344 | 1198 | ρt(CH2) | |||
| 1528 | 1464 | δ,ρr (CH2) | |||
| 1713 | νs (C=C) | ||||
| 1721 | 1721 | νs (C=O) | |||
| 2986 | 2998 | νs (CH) | |||
| 3074 | νs (CH) | ||||
| 3641 | 3641 | νs (OH) | |||
| Linoleic | 643 | ρr(CH2) |  |
 |
|
| 685 | ρr(OH) | ||||
| 1079 | ρω(CH2) | ||||
| 1317 | ρω(CH2) | ||||
| 1344 | 1151 | ρt(CH2) | |||
| 1452 | ρr=CH | ||||
| 1527 | 1555 | δ(CH2) | |||
| 1708 | νs (C=C) | ||||
| 1712 | 1712 | νs (C=O) | |||
| 2981 | 2995 | νs (CH) | |||
| 2998 | 2998 | νas (CH) | |||
| 3006 | νs CH3 | ||||
| 3142 | 3141 | νs (=CH) | |||
| 3637 | 3636 | νs (OH) | |||
| Palmitic | 684 | ρr (CH2) | 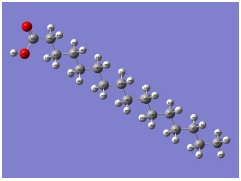 |
 |
|
| 1074 | 1111 | ρω(CH2) | |||
| 1342 | ρt(CH2) | ||||
| 1529 | δ(CH) | ||||
| 1712 | 1712 | νs (C=O) | |||
| 2986 | 2999 | νs (CH) | |||
| 3076 | 3073 | νas (=CH) | |||
| 3636 | 3636 | νs (OH) | |||
| Copalic | 1219 | 1219 | δ(OH)[6,27] |  |
 |
| 1677 | 1677 | νs (C=C)[2,3] | |||
| 1696 | 1696 | νs (C=O)[10,11] | |||
| 1723 | 1723 | νs (CH)[4,5] | |||
| 2951 | 2951 | νs (CH)[ring] | |||
| 2986 | νs (CH) | ||||
| 3007 | 3007 | νs (CH3)[ring] | |||
| 3057 | 3057 | νas (CH3) | |||
| 3130 | νs (CH) | ||||
| 3209 | 3209 | νas (CH3) | |||
| 3677 | 3677 | νs (CH)[6,27] | |||
Nomenclature: ρω = wagging, ρt = twisting, δ = bending, νs = symmetric stretch, νas = asymmetric stretch
3.1. FTIR
In Fig. 1a), COP we have the band 885 cm-1, characteristic peak for aromatic rings, which normally present off-plane C-H folding between 900 - 690 cm-1 and C=C between 1600 - 1450 cm-1. A closer observation can identify the type of ring substitution by checking harmonic bands between 2000 - 1667 cm-1. This assessment is not so obvious when these peaks are not present.
AND and CDB have spectral similarities at 723 cm-1, closely related to long chain peaks for carbon bonds. An oleic acid molecule has a C=C double bond in its structure, whereas the palmitic acid has a minor chain, and consists only of carbon single bonds. Thus, for the formation of hydrogen bonds, the field effects of neighboring groups and other factors modified the band positions of the carbon chain, contributing to a difference in the intensity of the characteristic bands [32]. However, the characteristic band intensities obtained from Raman spectroscopy can be used as an important criterion to evaluate the composition of vegetable oil. Still in both samples (AND and CDB) we have, 96, 97, 1126, 1137, 1176, 1747, 2366, 2933, 2927 cm-1 as similar bands. Among these, 1745 cm-1 of carbonyl (C=O) and 2927 cm-1 of C-H bonds are bands that are normally present in organic substances.
3.2. Raman
The Raman spectra of Fig. 1b) presented high frequency noises [33], requiring a brief treatment of the data, basing and correcting noises by data smoothing adjustments between levels of 13 to 30%, with calculation of FFT Filtering (AND and COP) and Gauss Convol. (CDB) in the PikFit software. Although the Raman spectra were generated by scanning the entire length of the 80 - 4000 cm-1 spectrometer, we reduced the displayed range, in the region 250-300 cm-1, in agreement with the known findings in the related literature [37]. For the modes obtained in Fig. 1b), AND and CDB, the similarity in their vibrational arrangements may be associated with the long chain acid molecules present in abundance in the samples. These fatty acids, can be saturated acids (SFA) without aliphatic double bonds and unsaturated fatty acids (USFA). USFAs are monounsaturated (MUFA) or polyunsaturated (PUFA), which are based on the presence of one or more double bonds between carbon atoms. USFAs are usually in cis (cis isomer) form in vegetable oils where the hydrogen atoms are on the same side of the double bonds. In trans configuration, the hydrogen atoms are on the opposite side of the carbon chain and adopt the linear configuration as SFA [38].
The peak at 1745 cm-1 is the peak vibration of ester bond carbonyl stretching and appears discreetly in AND. Those at 1656 cm-1 are vibrating peaks of cis (C=C) and cis (C-H) groups of USFA acids. The peak at 1442 cm-1 represents methylene vibration. The region from 800 - 2000 cm-1 was good well for the analysis of unsaturated fatty acids, but was not suitable for quantification of SFA. In the region 2500 - 3000 cm-1, AND and CDB bring modes common to other vegetable oils, which are responsible for the carbon bonds. For andiroba oil, in this same region, the mode is intense, and has a unique peak. Because it is considered an acid, more elongated pattern in that region is expected to appear, and in many cases, a displaced peak just above 3000 cm-1 may arise, indicating OH vibrations. Thus, the copalic acid will differentiate, because it presents a pair of rings which, in fact, will show vibrational patterns differing from the others.
Interestingly, most of the modes discussed in Fig. 1 can be identified in Table I. This can in fact be expected, since the structures analyzed by DFT are representations that compose the oils under study. The calculated bands are shown according to the type of vibration obtained with the calculations. We note that the modes of C = O are seen in 1712 cm-1 for aromatic ring molecule in the calculated acids. The C = C bond is absent from the calculated ωFTIR of the oleic, linoleic acids. In the B3LYP column, all figures the OH stretching modes well above the bands observed in the experimental spectra. Thus, the experimental analyzes presented indicate patterns slightly attributed to the respective calculated acids, and give us the indication that the DFT method can be complementary in the data analysis in Raman spectroscopy and FTIR, as these are with each other.
4. Conclusion
Spectral analyzes reveal that vegetable oils have common vibrational modes. These modes are present in the regions 900 - 690 cm-1, 1600 - 1450 cm-1, 2000-1667 cm-1 and 3000 cm-1 for FTIR, at 1200 - 1800 cm-1 and 2750 - 3000 cm-1 in Raman. However, there are small differences in characteristic modes, which are caused by the different levels of USFA acids, specifically in the possible combinations of C=C and the aromatic nature of one of the samples. The calculations revealed the proximity of these vibration bands to the verified components, and the spectra were complementary in the identification of the compounds. Fatty acids can be marked by the described procedure, quickly, aiding in the process of investigation and identification of vegetable oils.

