SciELO - Scientific Electronic Library Online

 
vol.65 issue2Study of thermal properties on the different layers composing a commercial ceramic tilePhysical properties of reactive RF sputtered a-IZON thin films author indexsubject indexsearch form
Home Pagealphabetic serial listing  

Services on Demand

Journal

Article

Indicators

Related links

  • Have no similar articlesSimilars in SciELO

Share


Revista mexicana de física

Print version ISSN 0035-001X

Rev. mex. fis. vol.65 n.2 México Mar./Apr. 2019  Epub Apr 17, 2020

https://doi.org/10.31349/revmexfis.65.128 

Investigación

An accelerated growth model to generate complex networks with connectivity distribution slope that varies with time

P. Castillo-Castilloa 

P. D. Arjona-Villicañab 

J. Acosta-Eliasc 

a Instituto de Investigación de Comunicación Optica, Universidad Autónoma de San Luis Potosí. e-mail: pcastillo@fc.uaslp.mx

b Facultad de Ingeniería, Universidad Autónoma de San Luis Potosí, e-mail: david.arjona@uaslp.mx

c Facultad de Ciencias, Universidad Autónoma de San Luis Potosí, e-mail: jacosta@uaslp.mx


Abstract

Many real-life complex networks have in-degree and out-degree distributions that decay as a power-law. However, the few models that have been able to reproduce both of these properties, can not reproduce the wide range of values found in real systems. Another limitation of these models is that they add links from nodes which are created into the network, as well as between nodes already present in this network. However, adding links between existing nodes is not a characteristic available in all systems. This paper introduces a new complex network growth model that, without adding links between existing nodes, is able to generate complex topologies with in-degree and out-degree distributions that decay as a power-law. Moreover, in this growth model, the ratio at which links are created is greater than the ratio at which nodes are born, which produces an accelerated growth phenomenon that can be found in some real systems, like the Internet at the Autonomous System level. This model also includes a behavior in which the slope of the in-degree distribution changes as the network grows, in other words, it is a function of time. Similar behaviors have been previously observed in some real systems, like the citation network of patents approved in the US between 1975 and 1999. However, in this latter network, the slope of the out-degree decreases as the network grows.

Keywords: Complex networks; scale-free networks; accelerated growth; Barabási model; Krapivsky-Redner model

PACS: 05.65.+b; 05.90.+m; 89.75.Fb

1. Introduction

Many systems and their interactions can be described using Directed Complex Networks (DCN) which share similar properties [1-3]. In order to model a system as a complex network, a set of components in the system are defined as nodes, and the relationships between them as links. For example, scientific papers’ citation networks represent articles as nodes, and citations as the links that join them. Citations in an article are outwardly directed to the articles they cite to. When directed links are necessary to represent a network it is called a DCN. However, when all the links are bidirectional or non-directional, the network is considered to be a non-directed complex network (NDCN). In a DCN, the number of links that leave a node is called its out-degree, while the number of links that enter a node is called its in-degree.

Before the turn of the century, the random network model was considered suitable to study most known networks. In this model, each node randomly selects to which nodes it connects to. This generates out-degree and in-degree values for all the nodes in the network that follow a Poisson probability distribution. However, research published in 1998 and 1999 [4-6] reported that some real networks have in- and out-degree distributions that follow a power-law function 7, P(k)kγ, which means that the properties observed in this type of networks may not be the result of simple random processes, hence they have been called complex networks (CN). Newer studies have uncovered that many other systems follow the CN mechanisms and properties [3]. For example: the power grid, airline networks, social-contact disease networks, neuronal networks, protein-protein interactions, scientific papers’ citation networks 4, the WWW and the Internet at the autonomous system scale, to mention a few.

The collective study of real systems that have power-law connectivity distributions has found that their in-degree distributions’ exponent, γin, vary in a range between 1.05 and 4.69, while their out-degree distributions’ exponent, γout, have a range between 1.05 and 5.01 [2, 8].

These values have an important effect on the properties of this type of networks. For example, networks with exponent values (γin and γout) in the range between two and three are considered scale-free 2. In this type of networks, a large percentage of nodes have a smaller than average degree, while a few nodes possess a high degree value. Another particular property of scale-free networks [9], is that they have a small network diameter d (see Fig. 1). Typically, dln(ln(N)), where N is the number of nodes in the network. Therefore, it is common to refer to such networks as “ultra-small-world” networks. This property has an effect in the behavior of such networks. For example, in the implementation of routing and searching algorithms, or the propagation of computer or biological viruses.

Figure 1 The shortest path is the path with fewest number of links (hops) between two nodes. For example the shortest path between nodes 0 and 3, is 2. The diameter in a graph or network is the longest shortest path or the distance between the two furthest nodes. The diameter of this graph is 3, because the shortest path between the two furthest nodes is 3.  

Since the publication of Barabási and Albert’s (BA) growth model [10] to generate complex networks, this model has been used as a reference for others to add new processes which allow to reproduce other properties observed in real networks [8].

For example, the original BA model included only NDCNs and could only generate networks with the γ=3 exponent. Dorogovtsev et al. added an initial attractiveness property [11] which allowed to model DCN and produced an exponent γin that could vary between 2 and ∞.

Not all networks possess the same processes. For example, adding and deleting links is possible only in networks like the WWW, where a web programmer may manually add or delete hyperlinks between pages. Another example could be a friendship network, where people may make new friends and lose others. However, this property is not available in a citation’s network, since once an article has been published, it is usually not possible to change its references to other articles. Interestingly, a published article has a fixed out-degree, but its in-degree may increase over time as new articles may reference any published article. Therefore, it is possible to deduce that in-degree distributions that follow a power-law function in this type of networks is due to preferential attachment [15]: Articles that have many references have a greater probability to acquire new references. However, the preferential attachment mechanism does not apply for the out-degree distribution of this type of networks and thus, it has not been possible to determine the laws, principles or rules that could explain why this distribution follows a power-law function in networks without a rewiring mechanism, like the citation network.

Models introduced after the one proposed by Barabási[15] define new processes that reproduce the behaviors and properties of specific real complex systems. However, there is no generic model that could reproduce the diverse number of properties found in the real world.

For example, Bollobás et al. [12] applied the preferential attachment model to the out-degree, while Dorogovtsev et al. [13] added links with preferential destination and links with random source and destination, both tried to produce in-degree and out-degree distributions that follow a power-law. However, the models proposed by Bollobás et al. and by Dorogotsev et al. are suitable for networks that are able to create new links between existing nodes, but not for networks lacking this mechanism, like the citation’s network.

Among the models that may be used to study networks that do not allow adding and deleting links after nodes have been created, the Krapivsky-Redner (K-R) model [14] allows power-law behavior for the in-degree distribution of the networks generated, but the out-degree distribution follows a Poisson function. The model proposed by Jabr-Hamdan et al. [15] simply assigns a power-law distribution to the outgoing links. While the model proposed by Esquivel et al. [18] only reproduce power-law distribution for the out-degree, but not for the in-degree. Other models have not been able to concurrently produce out-degree and in-degree distributions that decay as a power-law function.

The motivation behind this work is that, for the case of complex networks that do not allow to add and delete links, there are no models able to simultaneously produce out-degree and in-degree distributions that decay as a power-law.

This paper introduces a new DCN accelerated growth model which, without adding new links or rewiring between existing nodes in the network, is able to generate networks in which the in-degree and the out-degree node distributions decay as a power-law. Accelerated growth is a behavior available in some complex networks, where the ratio at which new links are created is greater than the ratio at which new nodes are added [17].

2. Network growth model proposed

The DCN growth model proposed in this paper is based in the Krapivsky-Redner [14] model. Initially the network has m0 isolated nodes and at each time-step a new node n is created, and one of the following two operations happens:

  • 1. With probability 1-p, a random number m is selected, where m is the number of outgoing links for n. The number m has a range between 1 and N, where N is the number of nodes in the network before n was created. The new node n randomly selects m nodes in the network, and it connects to each of these m nodes through a directed link that originates in n and finishes in each m node.

  • 2. With probability p, n randomly selects an existing node x and then connects n to all ancestors of x, where the directed links originate in n and terminate at each ancestor of x.

  • This article considers that node x1 is an ancestor of x2, if there is a link that originates at x2 and finishes at x1.

Figure 2 shows an example for the proposed model. In this example, the network has a set of nodes Net[0,1,,4], and p=0.8. Then, at the first time-step, node 5 gets created and randomly selects a real number between 0 and 1 which determines if it needs to execute the operation that corresponds to probability p or the one that corresponds to probability 1-p. For example, if the chosen number is 0.1, then the operation correspond to probability 1-p (1-0.8) as shown at Fig. 2a. Then, a random number between 1 and N is selected, which determines the out-degree of the new node, m. Notice that the range of m for this example is from 1 to 5. Assume a value of m=2 for this example, then two outgoing links are created from node 5 to two different nodes randomly selected from the network: nodes 0 and 3. Figure 2b shows an example of the operation that corresponds to probability p: a new node, 6, is created and randomly selects a number between 0 and 1. Assume that this number is 0.35, which is greater than 1-p and, therefore, this should be an operation that corresponds to p. Then, a random node from the existing network is chosen, for example 5, and the new node copies all the outgoing links of this node. This is also expressed as node 6 connects to node 5’s ancestors.

Figure 2 An example of the proposed model. (A) New node 5 performs operation 1, where it randomly chooses two nodes and connects to them. (B) New node 6 performs operation 2, where it randomly selects node 5 and connects to this node’s ancestors.  

3. Experiments and results

The following experiments were designed to find the impact that the parameters of the proposed model have in the out-degree and in-degree distribution of the generated networks, and to determine the range of the exponent in these distributions.

The proposed model was tested using numerical simulations. The generated networks were grown from N=1 to N=104. The range for the m outgoing links lies between 1 and N. The value of probability p varied from 0 to 1. Logs from these simulations were employed to generate the graphs shown in Fig. 3. For clarity, this figure only shows the distributions for p=0.10, 0.80, 0.90, 0.97 and 0.99.

Figure 3 shows that, when p=0.10, the in-degree distribution’s tail decays as an exponential function. In this case, the probability that a new node connects with m randomly selected existing nodes is 0.90. For this condition, the network’s growth is governed by non-biased random processes. In other words, each node in the network has the same probability to obtain new incoming links.

Figure 3 The in-degree connectivity distribution of networks generated by the proposed model. This figure shows a family of curves in which the γin varies from ∞ to approximately 4.30. 

When p=0.99, it is possible to see that the distribution’s tail has approximately three decades in the y-axis that decay as a power-law with exponent γ4.30.

These experiments show that for the proposed model, the average in-degree increases as the network grows. For example, when p=0.99 and the network reaches 103 nodes, the average in-degree is 4.79. In contrast, when the growth reaches 104 and using the same p, the network has an average in-degree of 48.64. This increment in the average in-degree indicates that, as the network grows, the speed at which links are born increases with respect to the speed at which nodes are born. In other words, the model exhibits accelerated growth .

Figure 4 shows that, for a network that has grown to 103 nodes, the exponent γin ≈ 3.30, and when the network reaches 104 nodes, γin ≈ 4.30. In other words, γin increases as the network grows.

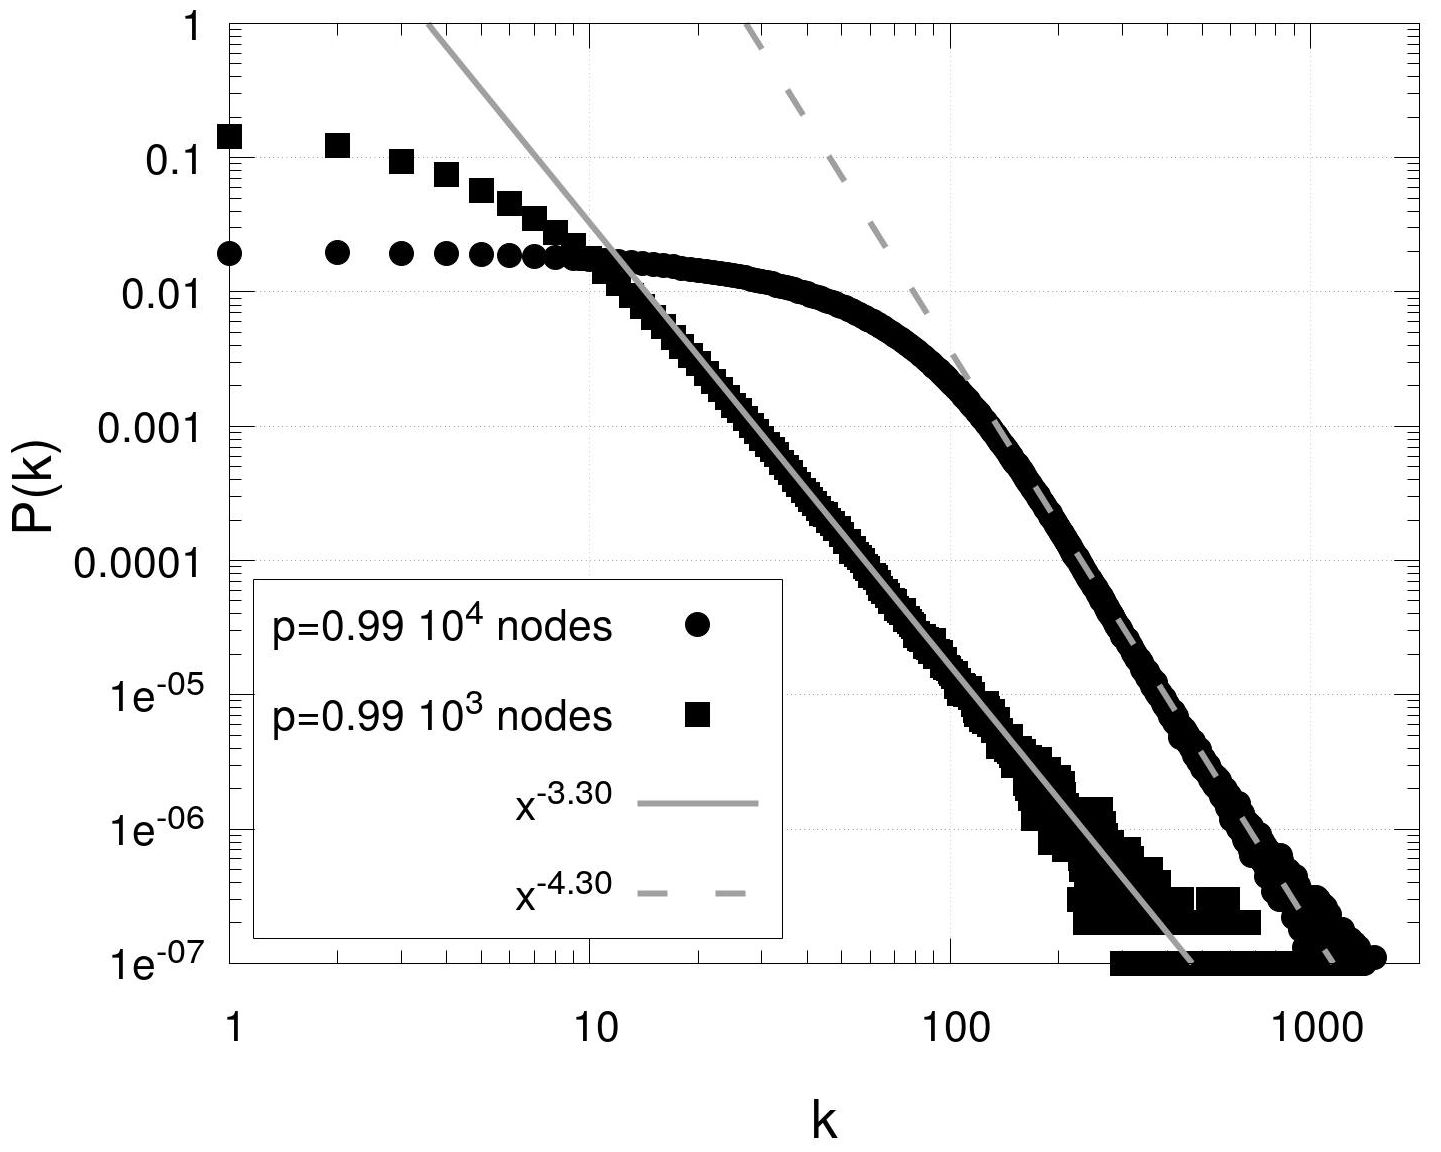
Figure 4 The impact of growth in the value of γin in a network generated by the proposed model. When the network has grown to 103 nodes, the in-degree distribution has a slope γ3.3, but when the network reaches 104 nodes, the value of γin has increased to approximately 4.3. 

A consequence of the variation of γin with the growth of the system, is that it becomes complicated to use the analytical tools that have been traditionally used to study complex networks: the master equation and the continuum method[10,18].

When in this model m=1 and remains constant during the growth of the network, the acceleration is equal to zero and the proposed model is identical to the one published by Krapivsky et al.[14]. For this case, γin also varies from 2 to ∞.

Figure 5 shows a family of curves that show the out-degree distributions produced by the proposed model. This figure shows that, when p approximates 0, the out-degree distribution exponent γout also approximates 0. In other words, as p gets closer to 0, the out-degree distribution approximates to a uniform distribution. When p tends to 1, the γout also tends to 1. Therefore, the numerical experiment shows that the γout has a range between 0 and 1.

Figure 5 The out-degree connectivity distribution of networks generated using the proposed model: when p → 0, γout → 0 and when p → 1, γout →1.  

This result coincides with the analytical model published by Esquivel et al. [16], where they applied the Krapivsky-Redner model to a random generation of the out-degree to generate their own model. The γout obtained with the model proposed in here is similar to the one obtained in [16] because it is one of the components of the proposed model.

4.US Patents and its γout

The references between the patents approved in the US between 1975 and 1999 [19] are an example of a CN that changes its γ exponents value as it grows, similarly as in the proposed model. In this network, each node represents a patent and the directed links, the references between patents. This system was selected because there is a record that allows to reproduce the network’s growth, which allows to analyze its state and properties at different time intervals. This is impossible or considerable more complicated in other systems, like the WWW or the paper citation’s network, since there is no accurate recordings on how these systems evolve with time.

The patents network analyzed here has 2,089,345 patents that have references of others that may have been approved before or after 1975. This network has a total of 16,518,948 links. For the current analysis, the network growth has been divided in two stages: ST1 is used to represent when the system has grown to 106 nodes and ST2 when the network has reached its maximum number of nodes. Figure 6 shows the out-degree distribution of this system when the network is at both of these stages. It is possible to observe that γout ≈4.38 at ST1 and it changes to approximately 3.38 at ST2. This is a clear example of a real system that has a growth behavior similar to the one observed in the proposed model. In other words, γout or γin may vary over time as the network grows. Unfortunately, this analysis cannot be done for γin because the data range stops at 1999, which hides all citations received from patents created after this date.

Figure 6 The out-degree connectivity distribution for the US Patents citation’s network 1975-1999. When this network had 106 patents, γout was approximately 4.38; when the network reached 2,089,345 (all patents in the dataset) γout changed to ≈3.38. 

5. Discussion

The model introduced in this article has an accelerated growth behavior which was expected, since each new node added to the network creates m links, where m may be greater than one. However, the fact that the γ exponent changes as the network grows, was not an expected behavior. Therefore, it becomes important to study the mechanisms that produce such behavior, which for the case of the patents citation’s network, produces that the γout exponent takes smaller values as the network grows, while this same exponent does not change for the proposed model.

It may also be interesting to study what could happen as the patent citation’s network system grows: will the γout exponent continue to decrease? At which point will it stop changing? Maybe the γout will stop when the network becomes scale-free (γout between 2.0 and 3.0), where it may become an ultra-small-word network. This study may have implications when trying to model other systems. For example, if a network can be used to model the propagation of a biological virus, it may be possible to anticipate how the network will grow, its expected diameter and other structural properties, which may then help to predict or contain the propagation of such virus.

The answer to the previous questions may be available once there is enough information about the evolution of this type of networks and a deeper understanding about the different processes that allow to produce and model this type of networks.

6. Conclusions

This article has introduced a new DCN growth model based in previous models by Krapivsky-Redner and by Esquivel et al. . The new model has resulted in a growth mechanism that is able to generate DCN with an out-degree and in-degree node distribution that decays as a power-law and which also includes an accelerated growth phenomenon, where the rate at which links are created is greater than the speed at which nodes are created. This causes the mean number of links per node to increase as the network grows, and it also exhibits an increase in the γin exponent, but not for γout.

References

1. S. Boccaletti, V. Latora, Y. Moreno, M. Chavez, D.-U. Hwang, Physics Reports 424 (2006) 175- 308. [ Links ]

2. A. L. Barabási, Network Science, Cambridge University Press, (2016). [ Links ]

3. M. Small, L. Hou, L. Zhang, National Science Review 1 (2014) 357-367. [ Links ]

4. S. Redner, The European Physical Journal B 4 (1998) 131-134. [ Links ]

5. R. Albert, J. Hawoong, A. L. Barabási , Nature 401 (1999) 130. [ Links ]

6. M. Faloutsos, P. Faloutsos, and C. Faloutsos, ACM SIGCOMM, Cambridge, MA, 29 (1999) 251-262. [ Links ]

7. Virkar, Yogesh; Clauset, Aaron, Ann. Appl. Stat. 8 (2014) 89-119. [ Links ]

8. R. Albert andA. L. Barabási , Rev of Mod Phy 74 (2002). [ Links ]

9. K. Judd, M. Small and T. Stemler, EPL 103 (2013) 58004. [ Links ]

10. S. N. Dorogovtsev, J. F. F. Mendes, and A. N. Samukhin, Phys. Rev. Lett. 85 (2000) 4633. [ Links ]

11. S. N. Dorogovtsev , S. Mendes, J. & Samukhin, A. ArXiv:cond-mat/0009090, (2000). [ Links ]

12. B. Bollobás, B., Christian, B., Chayes, & J. Riordan, O. Directed scale-free graphs, SODA’03. Philadelphia, PA, USA: Society for Industrial and Applied Mathematics, (2003) 132-139. [ Links ]

13. A. Jabr-Hamdan,J. Sun and D. ben-Avraham, Physical Review E 90 (2014) 052812. [ Links ]

14. P. L. Krapivsky and S. Redner, Physical Review E 71 (2005) 036118. [ Links ]

15. A. L. Barabási , R. Albert , Science 286 (1999) 509-512. [ Links ]

16. A. L. Barabási , R. Albert , H. Jeong Physica A 272 (1999) 173-187. [ Links ]

17. S.N. Dorogovtsev and J.F.F. Mendes, Phys. Rev. E 63 (2001) 1-4. [ Links ]

18. J. Esquivel-Gomez, E. Stevens-Navarro, U. Pineda-Rico, J. Acosta-Elias, Sci. Rep. Nature 5 (2015) Article number: 7670, doi:10.1038/srep07670, . [ Links ]

19. V. Batagelj, arXiv:cs/0309023v1 [cs.DL], (2003). [ Links ]

Received: May 03, 2018; Accepted: November 09, 2018

Creative Commons License This is an open-access article distributed under the terms of the Creative Commons Attribution License