


 text new page (beta)
 English (pdf)
 Article in xml format
 Article references
 Send this article by e-mail
 Cited by SciELO
  Similars in
SciELO
Similars in
SciELO 
 Permalink
Introduction
The family of ordered-vacancy compounds (OVC’s) with the general formula
A semiconductor property which is affected by the presence of Mn+2, especially at low temperatures, is the band gap E G . Theoretical studies have shown [19,20] that nearby a critical point, as for example the spin glass transition temperature T f , a magnetic contribution to the variation E G with temperature, due to the exchange interaction between the d electrons of Mn+2 ions and the electrons in the valence and conduction bands, should occur. For antiferromagnetic exchange interaction, as is the case of MnIn2Se4, an increase in E G around T f is expected [19]. In spite of these advances, to the best of our knowledge, a detailed study of the temperature dependence of E G for semiconductors where a paramagnetic to spin-glass transition occurs, has not been reported. This is of interest in relation to whether it is a true phase transition from a thermodynamic point of view or a gradual freezing of the magnetic moments. For this reason, in the present work we present a study of the temperature dependence of the fundamental band gaps in MnIn2Se4. This dependence is discussed in terms of the theoretical models reported in the literature that analyze the magnetic contribution to the shift of E G with T.
2. Crystal growth and experimental details
Bulk single-crystals of MnIn2Se4 were grown by chemical vapor transport technique from polycrystalline MnIn2Se4 which was synthesized from stoichiometric amounts of 5 N pure Mn, In, and Se, in an evacuated and closed ampoule. This was carried out by gradual heating of the mixture, subsequent melting, and gradual cooling through the freezing point. For the crystal growth, a 20 cm long and 1.5 cm inner diameter quartz stationary ampoule loaded with 1.5 g charge of the pre-synthesized material was used. I 2, with a concentration of 4 mg/cm3 of ampoule volume, was employed as transport agent in the reaction. The transport reaction was carried out in a two-temperature zone furnace during seven days between 800oC, in the highest-temperature region of the ampoule where the source pre-reacted material is initially placed, and 750oC, in the lowest-temperature region where the obtained bulk crystals are deposited. As-grown bulk crystals have typical dimensions of about 20-30 mm2 and show a dark color.
A SIEMENS D-5005 diffractometer, operated at 30 kV and 15 mA, with a Cu-target (λ−Cu Kα = 0.15418 nm) tube, a graphite monochromator and a scintillation detector, was used to register the powder X-ray diffraction pattern at room temperature. The intensity data were recorded in a θ/θ reflection mode from 10 to 100o with a step size of 0.02o and a scan speed of 25 s/step. Quartz was used as an external standard.
The absorption coefficient spectra α was obtained from the optical transmittance T r spectra through the relation [21] T r = [(1 − R)2 exp(−αx)]/[1 − R 2 exp(−2αx)], where x is the thickness sample and R ≈ 0.223 [18], is the reflectivity. T r spectra were measured by using an Acton Research Spectra P-500 spectrometer in the energy range from 1.2 to 2.4 eV. For the measurements of these spectra at various temperatures from 10 to 295 K, the samples were mounted on a cold finger of a Janis closed cycle refrigerator.
3. Powder X-ray diffraction analysis
To determine the crystal structure and unit cell parameters of MnIn2Se4, powder X-ray diffraction analysis was carried out. The structure was refined by means of the Rietveld method using the Fullprof program. For the refinement, atomic coordinates of MnIn2Se4 single-crystal reported by Range et al. [17], where used in the analysis. The Rietveld plot is shown in Fig. 1. The final refinement converged to the profile agreement factors: R
p
= 9.9 %, R
wp
= 10.5 %, R
exp = 9.1%, S = 1.2. MnIn2Se4 crystallizes in the centrosymmetric space group
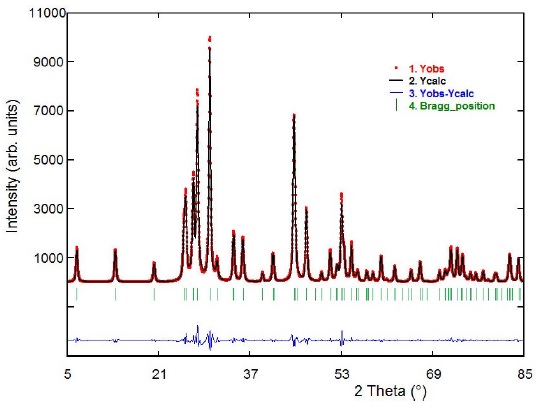
FIGURE 1 Observed (circles), calculated (solid line), and difference plot of the final Rietveld refinement of MnIn2Se4.
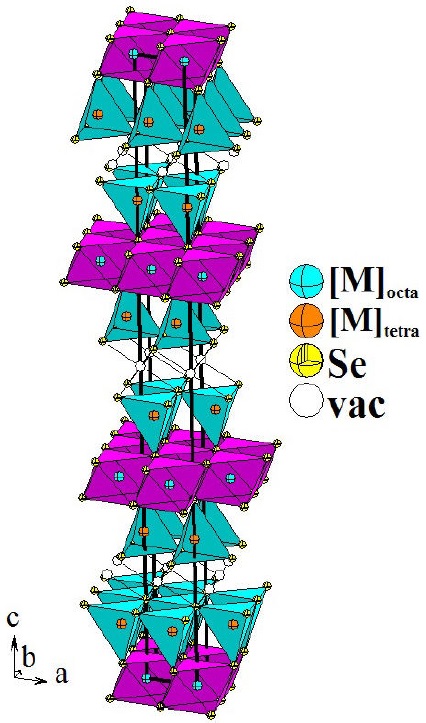
The crystallographic analysis confirms that MnIn2Se4 belongs to a rhombohedral defect structure with tetrahedral and octahedral cation-to-anion coordination, which can be expressed by the chemical formula [M]oct([M]tetr)2Se4, where [M] means either Mn and In cations distributed in a disordered arrangement. [M]oct being the disordered cations occupying the octahedral sites, six-fold coordinated by Se anions, while [M]tetr being these cations occupying the tetrahedral sites, four-fold coordinated by Se anions.
The unit cell diagram of MnIn2Se4 is shown in Fig. 2. A close-packed Se layer, with Mn and In cations at random in octahedral and tetrahedral voids, leaving the interlayers between h-stacked layers vacant, can be observed in this figure.
4. Temperature dependence of the band gap energy
The nature of the fundamental absorption edge in MnIn2Se4 was examined by us in a previous article [18] by studying the optical absorption coefficient spectra α
c
of this compound at several temperatures between 10 and 295 K. It was found, at values of α
c
lower than about 2 × 103 cm−1, that the lowest energy gap is indirect. On the other hand, for values of α
c
greater than 2 × 103 cm−1, the absorption coefficient spectra show the presence of two direct band-to-band transitions at higher energies. These two processes, with characteristic energies
The shape of E
G
vs. T curve in non-magnetic semiconductors is approximately flat at low temperatures, but smoothly changes to a linear decrease in the high temperature region. However, as can be seen in Fig. 3, where the temperature variation of E
GI
,
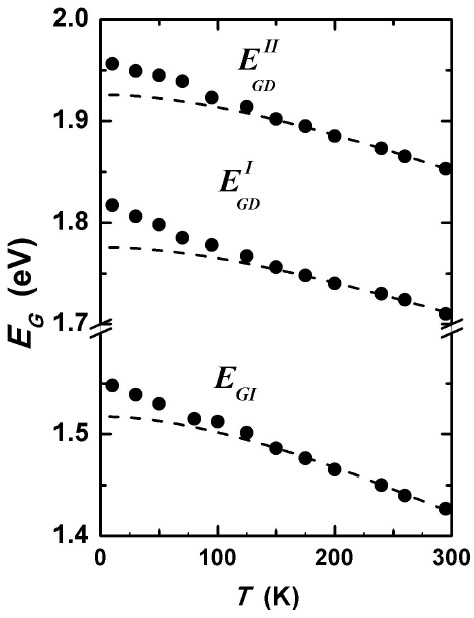
FIGURE 3 Temperature variation of E
GI
,
Such a behavior at low T, which has also been observed in other materials having antiferromagnetic exchange [22,24], is also consistent with the theoretical study [19] about the effects of spin fluctuations on the shift of the E G with temperature around a magnetic critical temperature T C . According to this study, for an antiferromagnetic exchange interaction between spins, a magnetic contribution is expected that should cause an increase ∆E GM in the band gap of the semiconductor in the vicinity of the spin-glass transition temperature T f .
To describe the behavior of E G near the critical freezing temperature T f in terms of a power law, the reduced temperature difference τ = |T − T f |/T f , which is zero at the phase transition, is introduced in the analysis of the data [19]. For a semiconductor with antiferromagnetic exchange interaction, the theory indicates that ∆E GM satisfies a relation of the form
where λ is the critical exponent of the band-gap variation ∆E GM and A is a parameter that measures the strength of the total spin interaction on this variation.
Two different temperature regions should be taken into account in this analysis. The critical region, near the spinglass freezing temperature T f , where the main contribution to ∆E GM vs. T arises from short-range spin correlations, and the non-critical one, far from T f , (T > Tf) where longer-range effects turn out to be important. Kasuya and Kondo [25], when studying the anomalies of the electrical resistivity in antiferromagnetic materials that exhibit orderdisorder second-order phase transitions, have found that in the critical region λ is equal to the critical index of the specific heat magnetization α, which has a value close to zero. On the other hand, for τ outside the critical region (at T > T f ), Alexander et al. [19] predict that the value of exponent λ should be 1/2. Analyses of experimental E G vs. T data for various diluted magnetic semiconductors showing antiferromagnetic behaviour [22-24] confirm the predictions of both these models.
In order to obtain a theoretical expression for ∆E GM that can be compared with the data, Eq. (1) should be integrated.
then, if the value of ∆E GM at T f is expressed as ∆E f , the constant of integration C in Eq. (2) can be removed and this equation can be written as:
Thus, values of the magnetic shift ∆E GM determined from the experimental data can be analyzed in terms of Eq. (4). To calculate ∆E GM it is necessary to know the values of E G in the absence of any magnetic effects. These can be determined by extrapolating to low temperatures the E G (T) curves at high temperatures where the magnetic effects are unimportant. This may be done by using the expression for the E G vs T variation based on Bose-Einstein phonon model, given by [26]
where E B −α b = E G (0) is the value of the energy gap at 0 K, and Φ an average phonon related to the Debye temperature.
The difference between the measured curves and those extrapolated by using Eq. (5) is thus attributed to the magnetic contribution∆E
GM
. Hence, the data shown in Fig. 3 have to be fitted to Eq. (5) in the high-temperature region (T ≥ 150 K). Thus, in order to reduce the number of the free parameters to be determined from the data, i.e. E
B
, α
B
, and Φ, to only two, we have taken Φ = 200 K, which is the Debye temperature for MnIn2Se4 estimated from its melting point (T
M
≈ 1178 K) by using the classical Lindemann expression, which relates Φ to the melting point T
M
through the expression Φ ∼ TM
1/2
[27]. Hence, using Φ ≈ 200 K as a fixed parameter, Eq. (5) was fitted to the experimental E
GI
(T),
TABLE II Values of parameters E
G
(0) and a
B
, obtained from the fit of E
GI
(T),
| Optical transition |
E
G
(0) (eV) |
αb (eV) |
λc | λnc |
A
c (meV) |
A
nc (meV) |
| EGI | 1:516 ± 0:001 | 0:044 ± 0:06 | 0.02 | 0.46 | 1.3 | 2.0 |
|
|
1:775 ± 0:001 | 0:031 ± 0:001 | 0.08 | 0.49 | 1.6 | 2.7 |
|
|
1:925 ± 0:005 | 0:035 ± 0:001 | 0.09 | 0.52 | 1.4 | 2.5 |
The temperature variation of ΔEGM for the three band-to-band transitions in the form of a plot of ln(ΔEGM-ΔEG) vs. ln τ, in the temperature range where the magnetic contribution to EG vs. T is appreciable, is shown a broken line, in Figs. 4, 5a, and 5b, for EGI,
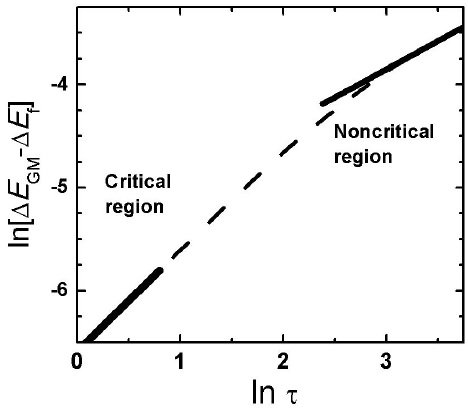
FIGURE 4 Temperature variation of ∆E GM for the indirect bandto-band transition E GI observed in MnIn2Se4 in the form of a plot of ln(∆E GM − ∆E f ) vs. lnτ, in the temperature range where the magnetic contribution to E G vs. T is appreciable (T < 150 K) (broken line). The slopes in both low and high-τ regions are indicated by bold continuous straight lines.
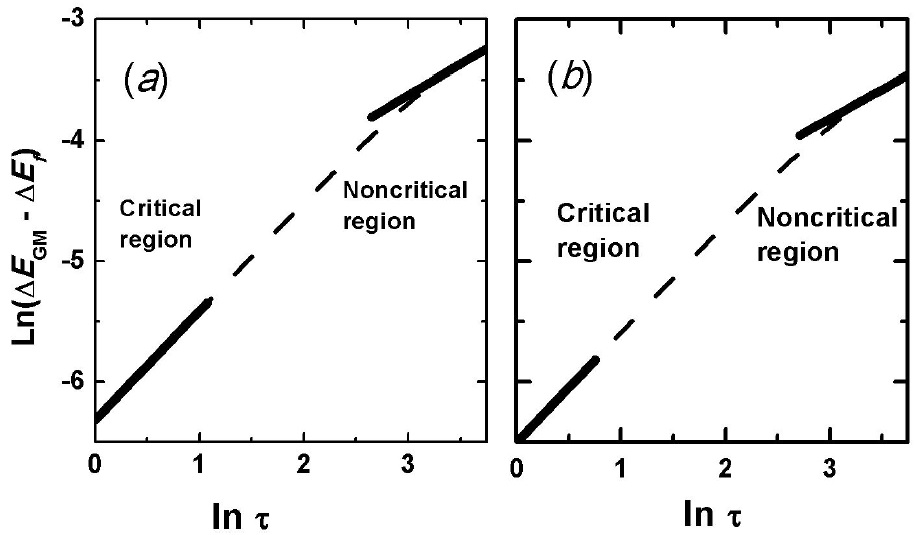
FIGURE 5 Temperature variation of ∆E
GM
for the indirect band-to-band transition
However, it is also observed that an intermediate temperature region exists where λ which was obtained from the slope of the broken lines at each temperature in Fig. 5, gradually increases between these two values. This is shown in Fig. 6 where the variation of λ with lnτ is plotted for the
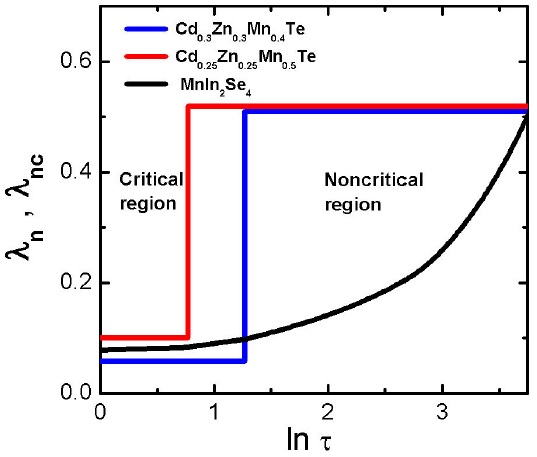
FIGURE 6 Variation of λ¸ obtained from the slope of broken lines in Fig. 5, with ln τ in the critical and noncritical regions for the direct transition
The existence of this intermediate region, which does not appear in ideal antiferromagnetic compounds where an abrupt change when passing from critical to noncritical regions is observed [22-24], indicates that in the present case a gradual change is occurs when MnIn2Se4 pass from the spinglass phase to the paramagnetic one. This fact reveals that it is not a true phase transition in the thermodynamic sense but a gradual freezing of the magnetic moments.
Thus, it is found that in MnIn2Se4 below about 20 K, short-range spin correlations give the main contribution to ΔEGM vs. T, while longer-range effects becomes dominant at temperatures between about 70 to 150 K. In the intermediate temperature region, where λ¸ varies from about 0.02 to 0.40, both these two spin correlation effects should be taken into account in the analysis of magneto-optical properties of this compound.
Values of the parameters A in the critical and non-critical regions, obtained from the fit are also shown in Table II. These values of A c and A nc , are in good agreement with those reported for antiferromagnetic semiconductors [22,24] that vary from 0.2 to 28.0 and 4.8 to 18.0 meV, respectively.
5. Conclusion
The temperature dependence of the indirect and direct fundamental band gaps of single crystals on the layered compound MnIn2Se4, that crystallize in the rhombohedral defect structure with space group

