


 nueva página del texto (beta)
 Inglés (pdf)
 Artículo en XML
 Referencias del artículo
 Enviar artículo por email
 Citado por SciELO
  Similares en
SciELO
Similares en
SciELO 
 Permalink
1. Introduction
Ternary compounds of the
Hence, in the present work we report on the temperature dependence of Urbach’s energy in pure and Mn-doped samples of the orthorhombic structure Cu2GeSe3 compound (CGSe) having small a deviation from the ideal stoichiometry 2:1:3. The results here obtained are analyzed with the theoretical model proposed by Wasim et al. [18] and the effect of structural disorder caused by the deviation from ideal molecularity and valence stoichiometry on the phonon energy of pure and Mn-doped CGSe is discussed.
2. Crystal growth and Experimental methods
Polycrystalline pure and Mn doped (containing 0.03% Mn in weight) CGSe samples used in the present study were prepared by melting with direct fusion the constituent elements in a sealed and evacuated quartz tube. The ampoules were placed in a vertical furnace. Initially they were heated from room temperature to 300oC at the rate of 30oC/h. The mixture was kept at this temperature for 24 h and then heated at 6oC/h up to 960oC. Again the mixture was kept at this temperature for 24 h. Then it was heated to 1150oC at the rate of 30oC/h. The mixture in the liquid phase was agitated carefully by periodically rocking the furnace for 48 h. It was cooled at a rate of 60oC/h up to 900oC and then to 800oC at 10oC/h with a dwell time at this temperature of 24 h. The cooling rate from 800 to 650oC was 6oC/h with a dwell time of 24 h. The furnace was then cooled to 500oC at 20oC/h and the ingot was annealed at this temperature for 200 h. Finally, the furnace was cooled to room temperature at 30oC/h.
The chemical composition of samples taken from the central part of the ingots was obtained by energy dispersive Xray spectroscopy (EDX).
The powder X-ray diffraction (XRD) patterns of the samples were recorded at room temperature using a calibrated Guinier-de Wolf camera. The camera was installed in a x-ray generator equipped with a Cu-target tube operated at 40 kV and 20 mA. The position of each peak was established using the α 1 component (λCuKα 1 = 0.15406 nm).
For the measurements of the absorption coefficient spectra at various temperatures, parallel-sided single-crystal samples were selectively cut from polycrystalline ingots grown from the melt as described above. They were placed in a He2 cryostat operating in the range from 10 to 300 K. A fully automated SPEX 1870 monochromator and a 170 W tungsten lamp as a light source were used. The transmitted radiation was detected by a cooled PbS detector.
3. Theory
At a given temperature, the optical absorption coefficient α just below the fundamental absorption edge is called Urbach’s tail and can be expressed by a relation of the form [15]
where hν is the incident photon energy, σ the steepness parameter, α 0 and E 0 two characteristic parameters of the material, and K B the Boltzmann constant. This behavior has its origin in the interaction of electrons and excitons with phonons [16, 18]. E U = K B T/σ, which represents the width of the exponential tail, is called Urbach’s energy. The steepness parameter σ is found to satisfy the relation [18]
where hν p is the energy of the phonons associated with Urbach’s tail and σ 0 a constant. Different values of hν p for the same material, some of them much higher than the highest optical mode observed in the vibrational spectra of each material, have been reported in ternary chalcopyrite [18,20-22] and chalcopyrite-related structure compounds [23-26].
The existence of these unusually higher energy modes is explained by assuming that they are due to the structural disorder caused by the deviation from ideal molecularity and valence stoichiometry in the samples studied [18]. This is described by means of the parameter ∆Z defined as ∆Z = ∆X + ∆Y, where for the present compound CGSe, ∆X = |Cu|/2|Ge| − 1, and ∆Y = |Se|/|Metal| − 1, represent the deviations from molecularity and valence stoichiometry, respectively [18]. In these relations, |Cu|, |Ge|, and |Se| being the average concentrations in atomic percent of the constituent elements in CGSe obtained from the composition analysis. This behavior can be expressed by the relation [18]:
where hν p0 is the average of the phonon energy in an entirely ordered system and C a constant.
On the other hand, to explain the temperature dependence of Urbach’s energy in ternary chalcopyrite and chalcopyriterelated structure compounds, Wasim et al. [18] have used an expression of the form:
where the adjustable parameters P and N are related to structural disorder and thermal phonon modification, respectively. In a perfectly ordered system, P and N are expected to be zero and unity, respectively. N is introduced in Eq. (4) to take into account the fact that due to structural disorder only a fraction of the total phonon modes excited at a given temperature can interact with excitons/electrons, and Θ is a characteristic lattice temperature related to the mean frequency of phonons in the crystal. It is expected to be of the same order as the Debye temperature Θ D .
4. Experimental Results and Discussion
A detailed analysis of the XRD patterns confirms that this material crystallizes in an orthorhombic cell with space group
The chemical analysis of samples taken from the central part of the ingots of S1, S2 and S3 CGSe, performed by EDX, gives chemical compositions of |Cu| : |Ge| : |Se| = 28.4:15.0:56.6, 30.1:17.5:52.4, and 26.3:16.0:57.7, in atomic percentage, respectively. These are close to the ideal value 2:1:3. However, all the samples show deviations from its ideal stoichiometry. Thus, all the samples have deficiency of Cu with respect to Ge (|Cu|/|Ge| ≈ 1.64-1.89) and an excess of Se over cations (|Se|/|metal| ≈ 1.10-1.35).
The logarithmic variation of α with hν at several temperatures for pure S1 and S2, and Mn doped CGSe samples are plotted in Figs. 1(a), 1(b), and 1(c), respectively. Linear dependence within certain energy range at each temperature that converges to a single point defined by E 0 and α 0, is observed in these figures. The value of E 0 and α 0, obtained from the fit of Eq. (1) to the data of these CGSe samples are listed in Table I.
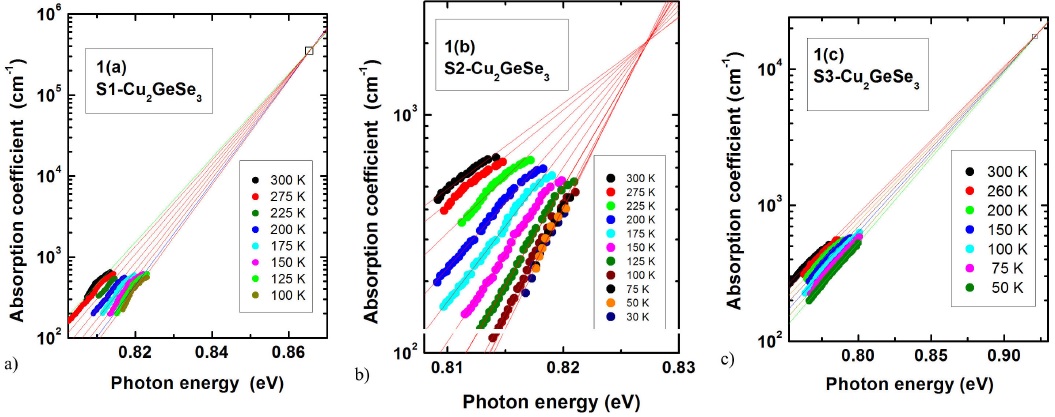
FIGURE 1 Absorption coefficient α as a function of photon energy hν at different temperatures for pure S1 and S2, and Mn doped S3 Cu2GeSe3 samples.
TABLE I Unit cell constants α, b, c and volume V for Pure S1 and S2, and Mn-doped S3 Cu2GeSe3 samples
| CGSe-sample | α(nm) | b (nm) | c (nm) | V (nm3) |
| S1-CGSe | 1.1854(4) | 0.3954(2) | 0.5489(1) | 0.2573(2) |
| S2-CGSe | 1.1860(3) | 0.3960(1) | 0.5475(1) | 0.2572(2) |
| S3-CGSe | 1.1864(2) | 0.3951(1) | 0.5489(1) | 0.2573(1) |
In addition, the temperature dependence of the steepness parameter is plotted in Fig. 2. Values of σ 0 and hν p obtained from a fit of Eq. (2) to the data are also given in Table II.
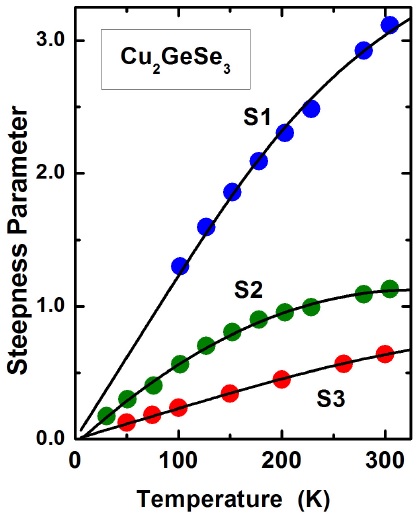
FIGURE 2 The steepness parameter σ as a function of temperature for pure S1 and S2, and Mn doped S3 Cu2GeSe3 samples. The continuous curves represent a fit of Eq, (2) to the data with the adjustable parameters σ0 and hν p given in Table II.
TABLE II The parameters E 0, α 0, σ 0, phonon energy associated with Urbach’s tail hν p , absolute value of the molecularity ∆X, deviation from valence stoichiometry ∆Y , ∆Z = ∆X+∆Y , and the adjustable parameters P and N for pure S1 and S2 and Mn doped S3 Cu2GeSe3 samples.
| CGSe Samples |
E
0 (eV) |
α
0 (104 cm−1) |
σ 0 |
hν
p
(meV) |
|∆X| | |∆Y | |∆Z| | P | N |
| S1 | 0.865 | 34.8 | 4.30 | 60 | 0.087 | 0.261 | 0.348 | 3.81 | 0.46 |
| S2 | 0.827 | 0.203 | 1.55 | 48 | 0.130 | 0.098 | 0.228 | 1.81 | 0.61 |
| S3 | 0.921 | 1.73 | 1.09 | 81 | 0.181 | 0.370 | 0.551 | 5.69 | 0.29 |
As mentioned above, it was found for ternary chalcopyrite compounds that high values of hν p , as those at 48, 60 and 81 meV found for CGSe in the present work, appear due to the structural disorder caused by the deviations from molecularity ∆X and valence stoichiometry ∆Y in the samples of these ternaries. Hence, to estimate the phonon energy in an entirely ordered CuGSe sample, hν p 0, we plot in Fig. 3 the change in hν p with |∆Z|. Values of hν p vs. |∆Z| for several chalcopyrite related compounds reported in the literature are also shown in this figure for comparison.
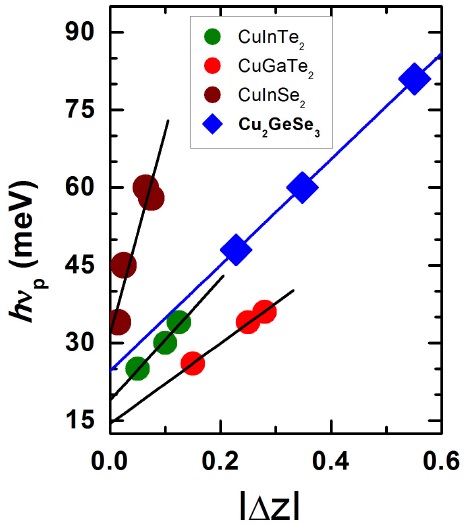
FIGURE 3 The change in hν p with |∆Z| for Cu2GeSe3 of the present work. Values of hν p vs. |∆Z| for CuInTe2, CuGaTe2, and CuInSe2 chalcopyrite compounds reported in the literature [18,20] are also shown in this figure for comparison. Straight lines represent linear fits to the data. For CGSe, the extrapolation of the straight line to |∆Z| = 0 gives hν p0 ≈ 25 meV (≈ 201 cm−1).
A linear variation between both these parameters, as expected from Eq. (3), is observed. The extrapolation of the straight line to |∆Z| = 0, that would correspond to a sample of ideal stoichiometry, gives hν
p0
≈ 25 meV (
From the Raman spectra of CGSe measured at 300 K reported elsewhere [26], the number of lattice vibrational modes observed is 8. The frequency of these Raman modes varies from the lowest at 135 to the highest at 385 cm−1. The highest intensive line, assigned as an A
2-symmetry mode, was observed at 189 cm−1. This is very close to
This confirms that, apart from hν p at ∆Z = 0, additional phonon energy, proportional to |∆Z|, is involved in the formation of Urbach’s tail in CGSe.
The variation of Urbach’s energy E U ≡ K B T/s with temperature is shown in Fig. 4. The E U vs T data of CGSe are fitted to Eq. (4) with P and N as adjustable parameters. A good fit, also shown in Fig. 4, is obtained with the values of P and N also given in Table II.
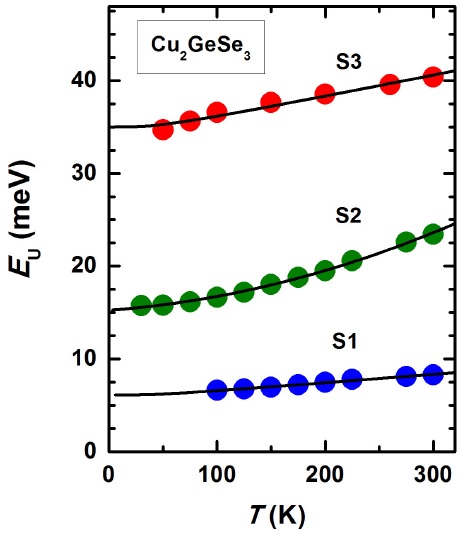
FIGURE 4 The Urbach’s energy as a function of temperature for pure and Mn-doped Cu2GeSe3 samples. The continuous curves represent a fit to the data of each sample with Eq. (4). The corresponding adjustable parameters P and N of the two different samples are given in Table II.
To calculate the Urbach’s energy we have used Θ ≈ 200 K. This value was obtained from a theoretical fit of the temperature dependence of the energy gap [9] by using an expression proposed by Viña et al. [28] based on a BoseEinstein factor for phonons where Θ appears as one of the parameters. It is also expected that P and N should be related to |∆Z| describing deviations from the ideal stoichiometry [18].
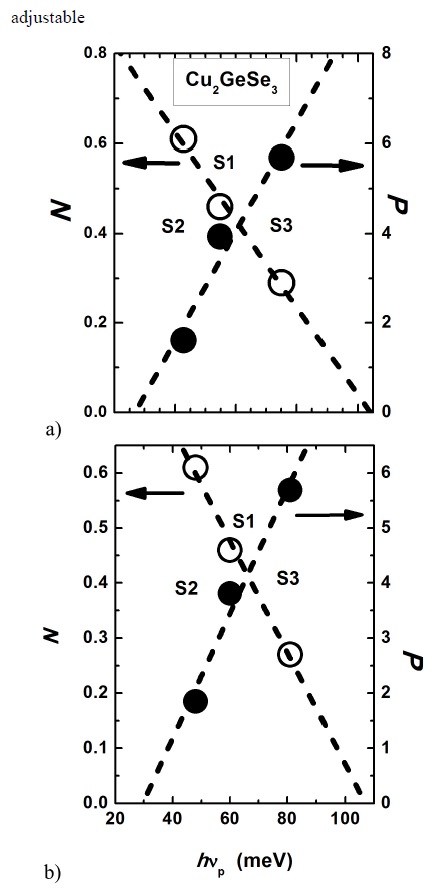
In Fig. 5 (a), we plot P and N as a function of |∆Z|. It is observed that both P and N versus |∆Z| can be fitted to straight lines displaying the trend that when |∆Z| tends to zero, which corresponds to a defect free sample, P also approaches to zero and N to unity. The dependence of P and N on hν
p
is also displayed in Fig. 5 (b). Again, a linear dependence between both P and N vs. hν
p
is obtained. The extrapolation of these straight lines gives hνp ≈ 29 and 106 meV at P = 0 and N = 0, respectively. The value of hvp at P = 0, that would correspond to an ideal 2:1:3 CGSe sample, agrees well with both hv
p ≈ 25 meV at ΔZ = 0, determined from the extrapolation to |∆Z| = 0 in Fig. 3, and the average energy of all the eight optical modes, which is 27 meV. On the other hand, the value of hv
p ≈ 106 meV (~1200 K) at N = 0, is of the same order as the melting point of CGSe, which is about 1060 K [29, 30]. This last result is consistent with the fact that CGSe undergoes an orderdisorder phase transition near its melting temperature from the orthorhombic phase to a disordered face-centered cubic structure with space group
5. Conclusion
In the present work we report on the analysis of the Urbach’s tail in Cu2GeSe3 ternary semiconductor compound which crystallizes in an orthorhombic cell with space group

