


 text new page (beta)
 English (pdf)
 Article in xml format
 Article references
 Send this article by e-mail
 Cited by SciELO
  Similars in
SciELO
Similars in
SciELO 
 Permalink
1.Introduction
The toxicity of hexavalent chromium (Cr(VI)), a water contaminant wich frequently appears in several industrial processes, and the interest on its reduction to trivalent chromium (Cr(III)) have given relevance and pertinence to the monitoring of this metal through compact analytic methods that allow the high-sensitivity in situ determination of trace amounts 1. The Thermal Lens (TL) technique is a method with high temporal resolution that allows the study of samples with very small optical absorption coefficients, which is an advantage for this purpose 2,3. With this technique, the amount of heat that a sample produces due to the absorption of energy from an excitation light beam (pump) is measured considering the generation of a spatial refractive index gradient in a region adjacent to the sample, called thermal lens. This optical influence zone causes distortions of the wave front of a second light beam, called the probe beam. By measuring the transmission of the probe beam through a small aperture located at some distance from the sample, a signal proportional to the amount of absorbed heat is obtained. The amplitude of this signal is proportional to the concentration of the absorbing specie. If the pump and probe beams are focused onto a microscopic region of the sample, the technique is called thermal lens microscopy (TLM)4. Recently, a TLM setup with coaxial counter-propagating pump and probe laser beams 5,6 and an integrated passive optical Fabry-Perot resonator has been described by Cabrera et al 7, who enhanced the sensibility of the technique and achieved limits of detection of some parts per billion (ppb) for Fe-II in water. In the mentioned work, the resonator has only one mirror to create the optical cavity, as the same front light output mirror of the probe laser (a gaseous HeNe) cavity was used to create the feedback. Cedeño et al 8 further improved the method, avoiding the possibility of self-mixing effects by introducing an additional mirror, increasing the optical path length, and allowing the use of a solid state laser instead of the gaseous one. A Cr(VI) detection limit in water of some ppb has been obtained with that set-up and a cavity amplification factor of
Photocatalysis has recently became a common word, and among many candidates for photocatalysts TiO2 is almost the only material suitable for industrial use at the moment and also probably in the near future. This is due to several reasons, among them that TiO2 has efficient photoactivity, it is chemically stable, inexpensive and harmless 9. The TiO2 photoactivity has been widely used for several applications, such as the photobleaching of dyes and the destruction of some microorganisms and pollutants 9. Due to its wide band-gap, TiO2 has no optical absorption in the visible region, so usually the photocatalysis is induced by irradiation with ultraviolet light. However, the use of UV lamps can be expensive in large-scale application and the solar light only contains about 5% of UV photons. For this reason, one current area of interest is the modification of the TiO2 band-gap to make it sensitive to a wider spectral range including visible light in order to use efficiently sunlight for photocatalysis. Efforts in this direction have included doping TiO2 with metal impurities 10. Here, we resorted to the use of Fe.
Usually, the monitoring of the photocatalytic reaction kinetics is performed using the UV-VIS optical spectroscopy (OS) technique, which requires the continuous removal and replacement of the samples for each measurement, i.e. it doesn’t allows in-situ measurements 11. Although international regulations fix the maximum allowed Cr-VI levels to values ranging from 0.05 12 to 0.5 ppm 13, which are easily accessible by OS, after a photocatalytic event Cr-VI may even exist at lower concentrations. Therefore, the search of methods for monitoring the degradation rate induced by photocatalysis in the sub ppm to ppb range has become necessary. Among them, the TLM approach used in this paper has demonstrated that low detection limits obtained which can be comparable with those achieved by expensive methods such as high performance spectroscopies 14. Therefore, in the present work this last approach, aided with a well-established diphenyl carbazide colorimetric method 15, is used to monitor in-situ the temporal evolution of the Cr(VI) concentration in water during a photocatalytic reaction induced by the irradiation with UV-violet light of an iron-incorporated (see later) titanium dioxide (TiO2) thin film acting as a catalyst.
2.Experimental
Catalyst
In this work, an iron-incorporated TiO2 (Fe: TiO2 for short) thin film grown onto a 1 mm thick glass microscope slide by the sol-gel dip-coating technique 16 was synthetized in order to shift the band-gap energy of TiO2 towards the violet region of the optical spectrum. Details about sample’s preparation and characterization are given elsewhere 17. Figure 1 shows the optical UV-VIS absorbance spectra of the pure TiO2 and the Fe-TiO2. The start of the absorption edge for pure TiO2 is approximately 390 nm, which is consistent with the intrinsic absorption bandgap of pure anatase TiO2 (∼3.2 eV18. On the other hand, the Fe: TiO2 spectrum presents a shift towards the red and its absorption increases in the visible range. This increase may be induced by a secondary transition corresponding to the excitation of Fe3+ 3d electrons to the conduction band of TiO2 (charge transfer transition) at 415 nm and the Fe3+ transition d-d

Experimental set-up
In our experimental set-up a pump laser beam, whose intensity is periodically modulated at a 50% duty-cycle, is focused onto a small region of the sample. Light absorption causes local periodical sample’s heating and induces, consequently, a thermal lens effect, namely periodical fluctuations in the sample’s refractive index (a temperature dependent parameter). The transmitted intensity distribution of a collimated continuous probe beam, passing through the heated region, changes periodically due to the locally induced refractive index variations. These intensity changes are recorded by a photodiode resulting in a TLM voltage, which is measured as a function of time with an oscilloscope. The amplitude of this signal, i.e. the maximal change occurring after each duty-cycle of excitation, is named the TLM amplitude signal, or TLM signal for short (see Sec. III for details).
The schema of the experimental set-up is shown in Fig. 2. It is similar to that described elsewhere 8, with the properly modifications to accommodate the UV-violet lamp used to induce the photocatalytic reaction.

FIGURE 2 a) Schema of the experimental set-up. EL: Excitation or pump laser. PL: Probe laser. CH: Chopper. O: Objective (focusing) lens. M1: Dichroic mirror. M2, M3, M4: Mirrors. BS: Beam splitter. The modulated pump beam is shown with dashed arrow. The continuous probe beam is shown with the solid arrow. The multiple reflections of the probe beam within the optical cavity formed by the mirrors M1 and M2 is schematically represented by two ends arrow. S: Sample’s cell. b) The sample’s cell with more details, showing the quartz cuvette containing the sample (Cr(VI)-water solution) and the photocatalyst (TiO2 film deposited onto the glass substrate), as well as the lamp (Pen Ray 11SC/2.25PV) emitting a broad band spectrum in the UV-Violet region centered at 365 nm (» 3:4 eV), which was used to induce the photocatalytic reaction.
The pump laser (LSR 532NL-300) in this system has a wavelength of 532 nm and a beam power at the sample position was 10 mW. The intensity of the pump laser beam was modulated periodically at the frequency of 1 Hz, using a mechanical optical chopper (Thorlabs MC 2000), and it was focused onto a very small region of the sample, using a microscope objective. The probe beam from a continuous He-Ne laser (PL) of 632.8 nm wave-length and 35 mW nominal power (JDS Uniphase 1145P) is highly collimated, being the power at the sample’s position much lower. Both beams propagate coaxially and in counter directions. The optically passive Fabry-Perot cavity formed between the mirrors M1 (dichroic) and M2 causes several times the forward and back propagation of the probe beam through the sample; thus, the thermal lens effect increases the sensitivity of the system about 10-times 8. The rays, resulting from the multiple reflections within the optical cavity, are measured with a photodiode PD (THORLABS DET-36 A/M) in a reflection mode described elsewhere 8. A pinhole (500 𝜇m diameter THORLABS- P500S) is located in front of the photodiode, so that only the contribution of the central region of the probe beam is sensed, which contains the information related to the thermal lens effect. The signal from the photodiode is measured using a digital oscilloscope (BK PRECISION 2542B). More experimental details can be found elsewhere 8.
Samples
A series of test samples of Cr(VI) in distilled water was prepared using the well-known 1,5 diphenil carbazide colorimetric method 15. All solutions were prepared using analytical-reagent grade chemicals and deionized water. All samples show the expected broad absorption band centered at 540 nm, which justifies the use of a pump laser emitting very near this wavelength.
3.Results and discussion
Figure 3 shows the time evolution of a typical thermal lens signal measured at a modulation frequency of 1 Hz for a sample of 4 𝜇g/L of Cr(VI). The TLM amplitude signal is calculated as usual using the definition 21:
where 𝐼(0) is the signal of the probe beam when the excitation beam is off and 𝐼(𝑡) is the probe beam signal when the excitation beam is on at the end of each heating cycle.
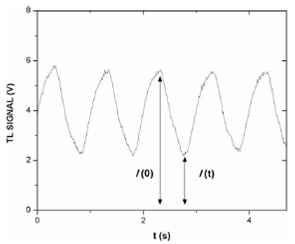
FIGURE 3 Typical TLM signal as a function of time for 4 ¹g/L of Cr(VI). The modulation frequency was 1 Hz.
A calibration curve was obtained by plotting the TLM signal as a function of the concentration of Cr (VI) in water, as is shown in the Fig. 4, in a range between 0 and 10 μ/L, with a limit of detection (LOD) of 53 ng/L (53 ppt) determined from this curve as usual 22, i.e. as the concentration of the absorbing species that produces the signal equals to three times the standard deviation (SD) of the ordinate intercept divided by the slope of the calibration curve.
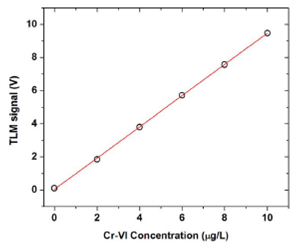
FIGURE 4 TLM signal as a function of the concentration of Cr(VI) in water. The solid curve is the best least squares linear fit result.
Note that this LOD is of the same order of magnitude than the values achievable using expensive techniques such as High Performance Spectroscopies 3.
A solution of 10 μg/L of Cr(VI) in water was added to 25 mg of diphenylcarbazide dissolved in 50 mL of acetone and was placed into a measurement cell in contact with the TiO2 film. Special care was taken to avoid irradiation of the film with the pump and probe beams and to avoid the possible degradation of Cr(VI) due to the direct irradiation of the solution with the light beams. The TLM signal was measured as a function of the photocatalysis time from the beginning of irradiation of the film with violet light. Using the calibration curve, the Cr(VI) concentration was determined for each TLM signal value. Figure 5 shows this concentration as a function of the time. After the first 50 minutes of the photocatalytic reaction, the Cr(VI) amount was reduced to an almost constant value of ∼0.7 ppb, a value well below of the detection limit of the conventionally used OS technique. The solid curve is the result of the best-fitting by method of least squares to the following relationship between the Cr(VI) concentration, C, and the time, t:
where

FIGURE 5 The Cr(VI) concentration as a function of the photocatalysis time. The solid curve is the result of the best least squares fitting to the potential function described by Eq. (1). The curve was obtained in the following way. First the TLM signal was measured as a function of time. Then, the calibration curve (Fig. 4) was used to determine which concentration correspond to each measured TLM signal. The concentrations determined in this way are those that are showed in this figure. The inset shows the same curve in logarithmic scale, where the solid line is the result of the best least squares fitting line.
4. Conclusions
We demonstrated that thermal lens microscopy can be used straightforwardly for in-situ monitoring of the chemical kinetics of the photocatalytic degradation of Cr(VI) at ppb concentrations. This kind of measurements are usually performed using conventional OS techniques such as UV-VIS spectroscopy, which has the following disadvantages when compared with the method proposed by us: 1-ex-situ measurements, i.e. for each photodegradation time a sample must be extracted from the photocatalysis reactor to be analyzed with the UV-VIS spectrometer. In our TLM approach the reactor is introduced within the experimental set-up so that the measurements can be performed in-situ. 2- Higher limit of detection (LOD within the ppm range) than TLM. The Cr (VI) LOD in water of our experimental set-up is 53 ppt. Our TLM configuration allowed us to determine an almost constant value of ∼0.7 ppb for the Cr-VI concentration reached after the first 50 minutes of the photocatalytic reaction. This value is well-below the LOD of UV-VIS spectroscopy, being only comparable with those achievable using very expensive techniques such as High Performance Liquid and Ion Spectroscopies. It is also well below the toxicity limits imposed for the Cr(VI) content in drinking water by international regulations.

