SciELO - Scientific Electronic Library Online

 
vol.64 número5Luminescent characteristics of Eu2+/Li+ doped (La-Al)2O3 phosphors and PMMA films activated with them índice de autoresíndice de materiabúsqueda de artículos
Home Pagelista alfabética de revistas  

Servicios Personalizados

Revista

Articulo

Indicadores

Links relacionados

  • No hay artículos similaresSimilares en SciELO

Compartir


Revista mexicana de física

versión impresa ISSN 0035-001X

Rev. mex. fis. vol.64 no.5 México sep./oct. 2018  Epub 30-Nov-2019


Research

Study of non-linear optical properties of center and edge δ-doped multiple quantum wells

M. Gambhir1  * 

V. Prasad1 

1Department of Physics, Swami Shraddhanand College, University of Delhi, Delhi 110036, India.


Abstract

In the present paper, the linear and non-linear optical properties of GaAs/AlGaAs with on-center and on-edge delta doping are studied within the effective mass approximation. The delta potential is analytically modeled within each quantum well potential to obtain the energy levels and the corresponding wave functions using the robust finite difference method. The linear and non-linear optical absorption coefficients and changes in the refractive index are studied in the presence of a static magnetic and a periodic laser field using the density matrix approach. The obtained results show that the position of resonances and the amplitude of the optical absorption coefficients and the refractive index changes can be modified by varying the magnetic field and strength and position of doping potential. Lastly, an increase of the optical intensity appreciably changes the total absorption coefficient, as well as the total refractive index changes. Obtained results are important for the design of various electronic components such as high-power FETs and infrared photonic devices based on the intersubband transition of electrons in δ-doped MQWs.

Keywords: Multiple quantum well; delta doping; optical absorption coefficient; refractive index changes; laser; magnetic field

PACS: 73.21.Fg; 78.20.Ci; 78.67.De

1.Introduction

The study of the optical properties of low-dimensional semiconductor heterostructures with impurity doping attracts much interest given the vast possibility of purposeful manipulation by means of external influences. Elevation in growth methodologies have made it possible to introduce dopants which can be confined in a single atomic layer. Delta (or δ-) doping was given the name to the procedure of embedding highly localized impurity sheets within a semiconducting layer. Such a kind of growing impurity gives rise to a high-density quasi-two-dimensional electron or hole gas in low-dimensional semiconductor heterostructures. Using this doping technique, we can adjust the width and the profile of confinement potential of the heterostructure. The first report of such a dopant deposition is due to Bass 1, who found that a strong surface adsorption of Si to GaAs surface results in sharp doping spikes. The versatility of dopant deposition was realized by Wood et al 2, who mentioned that complex doping profiles can be achieved by “atomic plane” doping. Such tapering doping profiles can be mathematically described by Dirac’s delta function. The atomic plane doping profile was first implemented in a high electron mobility field effect transistor proposed as δ-FETs by Schubert et al 3,4. Many modernistic structures based on δ-doped structures can be experimentally realized and studied using various assembling techniques 5-8. In recent years, the physics communities have devoted a great deal of attention to carry out experimental studies of δ-doped quantum well structures. Lee et al 9 carried out experiments to study the transport and optical properties in the conduction band of δ-doped quantum wells. Tribuzy et al 10 studied the quantum confined Stark effect in GaAs/AlGaAs MQW structures containing a nipi δ-doping superlattice. Photoluminescence studies were carried out in the δ-doping and on the parabolic quantum well by Tobata 11 et al Luo et al 12, studied transport measurements on a δ-doped quantum well system with extra modulation doping and proposed that their results may be useful for simplifying circuitry design for low-temperature amplifiers, and devices for space technology and satellite communications. Very recently, excitonic light emission decay time measurements in moderately δ-doped GaAs MQWs using a time-correlated single photon counting system was investigated by Kundrotas et al 13.

Not only experimental but also theoretical studies of low-dimensional semiconductor heterostructures with δ-doping have gained great importance due to their potential applications in optoelectronic and photonic devices 14,15. Localization of impurities in δ-doped structures is used in devices to give a surge to quantum confinement of carriers. Furthermore, such δ-doped quantum well structures have many advantages, such as marked radiative recombination rates and notable values of the oscillator strength 16 that accounts for the large dipole moment expectation values. Ozturk et al 17 studied the linear and non-linear intersubband optical absorption in n-type δ doped GaAs semiconductor quantum wells. The effect of the δ doping location on the linewidth of the intersubband absorption in GaN/AlGaN quantum wells was reported by Edmunds et al 18. Tulupenko et al 19 have calculated the intersubband absorption coefficients for either center, or edge δ-doped quantum wells. The multisubband electron mobility in a barrier δ-doped GaAs double quantum well structure using the self-consistent solution of the coupled Schrödinger equation and Poisson’s equation was studied by Das et al 20. Almansour et al 21 have investigated the effects of the concentration and the thickness of Si δ-doped layer on optical absorption and refractive index changes in an InAlN/GaN single quantum well taking into account the piezoelectric polarizations.

The understanding of the electronic and optical properties of doping in the quantum wells heterostructures is imperative because the optical, electrical, and transport properties of devices made from these materials show exotic behavior in the presence of external fields 22-25. Among various electronic and optical properties in semiconductor quantum wells, the optical absorption and refractive index changes have drawn great interest in theory and experiment 26,27 In this study, we have investigated the intersubband optical absorption coefficients and refractive index changes in a GaAs/AlxGa1-xAs MQWs which includes an attractive δ-doping potential in the middle of each quantum well. The time-independent Schrödinger equation for this composite potential is solved numerically using the finite-difference technique to yield the allowed values of energy eigenvalues and eigenstates. The linear and non-linear optical properties are then investigated within the compact-density matrix formalism. The paper is organized as follows: In Sec. 2, we describe the model and theoretical framework. The Hamiltonian and the relevant eigenenergies and eigenfunctions, obtained using the effective mass approximation are presented analytically. The analytical expressions for the linear and non-linear optical absorption coefficients and refractive index changes, obtained using the density matrix approach are also presented in Sec. 2. The numerical results and detailed discussions are given in Sec. 3. Finally, a brief conclusion is made in Sec. 4 followed by references. Our results obtained with this model show that the position and the magnitude of the linear, non-linear and total optical absorption coefficients and refractive index changes are sensitive to not only the optical wave but the strength of the static magnetic field and location and strength of δ-potential also affect the positions and intensity of resonance.

2.Outlook on the theoretical model

2.1.Energy eigenvalues and eigenfunctions

The heterostructure system under study consists of symmetric GaAs/AlxGax1-xAs coupled quantum wells exhibiting the properties of a collection of single quantum wells in the presence of a static magnetic field. The potential profile of such a heterostructure can be described as:

V(z)=nV(z-nl), (1)

where,

V(z-nl)=*20cV0if|z-nl|>L/20if|z-nl|<L/2

where n is the number of quantum wells, with period l. We assume, for simplicity, that in the coupled quantum well structure under consideration the neighbouring potential wells are so far apart that the wave functions of the individual potential wells do not overlap. The size of each well is L and the thickness of the barriers is fixed equal to the thickness of the wells. Apart from this, each well is having on-center δ-doping. A one-dimensional doping profile in a semiconductor can be treated to be like a δ-function, if the thickness of the doped layer is smaller as compared to other admissible length scales, which causes a conduction band bending. Such profile is described by the equation Δ(z)=βδ(z-γL) where β is the strength of the δ-potential and γ specifies the location of the impurity within the quantum wells. The structure becomes a MQW with finite potential with each quantum well doped in a single δ-spike.

In order to study the optical properties related to intersubband energy transitions in such a system, we consider the time-independent Schrödinger equation within the framework of effective mass approximation,

[-22m*2z2+Δ(z)+V(z)+B2z22m*]ψ(z)=Eψ(z) (2)

where ψ(z) is the wave function of an electron in the conduction band, V(z) is the confining potential in the growth z-direction and m* is the effective mass of an electron. The magnetic field B is taken along the growth z-direction. Equation (2) can be solved numerically by using a self-consistent method based on a very sensitive and versatile technique, finite-difference technique 28, to yield the allowed values of energy eigenvalues and eigenstates. The motivation behind using this computational technique is that it is fast to execute and light on memory and is more efficient for the evaluation of eigenstates of complex nanostructures with specific geometries. It employs a uniform grid structure to formulate sparse, structured Hamiltonian matrices, and thus provides a great advantage for dealing with arbitrary and complex structures [29,30]. By using this method, the solution of Eq. (2) gives the energy spectrum and the corresponding wave functions as a function of the position of z, depending upon the width and depth of each δ doped well.

2.2 Linear and non-linear intersubband optical absorption coefficients and refractive index changes

In this section, we present a brief derivation of the linear and the non-linear optical absorption coefficients and refractive index changes. Consider that our quantum system is excited by an electromagnetic field. If the wavelength of the progressive electromagnetic wave is larger than dimension of a MQW, the amplitude of electromagnetic wave may be considered as a constant throughout, so that dipole approximation becomes valid. Then the electric field of an incident wave can be expressed as

E(t)=2E0cos(ωt)=E0eiωt+E0e-iωt (3)

When an electromagnetic radiation propagates through the material it produces changes in the spatial and temporal distribution of electrical charges in material and mainly the valence electrons are perturbed from their normal orbit. This perturbation is responsible for the induced polarization. In case of a weak radiation field, the induced polarization in the material is directly proportional to the applied field, but in the presence of an intense field, the induced polarization becomes a non-linear function of the applied field. The induced electronic polarization caused by the incident field is

P-tε0χ1ωE-0eiωt+ε0χ22ωE~02e2iωt+ε0χ33ωE~03e3iωt+c.c (4)

The tilde ( ) in P and E represent their rapid variation in time. Here the terms up to the third-order in are retained. The terms χ(1)(ω), χ(2)(2ω) and χ(3)(3ω) are known as the linear, the second and the third-order non-linear optical susceptibilities, respectively, and ε0 is the electrical permittivity of vacuum. We use the compact density matrix method [31-34] to derive the expressions for various orders of electric susceptibilities and polarization components. The mathematical procedure is relatively simple and clear.

Considering the medium and the applied field as a united system, the time variation of density matrix in the presence of damping is governed by the equation

ρt=1i[H,ρt]-Γ(ρ-ρ(0)) (5)

where H=H0+HI(t) is the total Hamiltonian, H0 is the Hamiltonian without electromagnetic field and HI(t) is the interaction Hamiltonian of the whole system. Here, ρ is the density matrix operator. The second term in above equation is phenomenologically introduced to explain the relaxation influence of damping effect on the density matrix. Γ represents the relaxation rate. Equation (5) can be solved using an iterative procedure,

ρ(t)=kρ(k)(t), (6)

with

pij(k+1)t=1iH0,p(k+1)ij-iΓijpij(k+1)-1iqz,pkijEt. (7)

The electronic polarization P(t) and susceptibility x(t) are defined by the dipole operator M and the density matrix ρ as

P(t)=1vTr(ρM), (8)

where V and ρ are the volume and the one-electron density matrix of the system, respectively.

Using this, the analytical expressions for the absorption coefficients and the refractive index changes based on linear susceptibility, χ(1)(ω), and the third order susceptibility, χ(3)(ω), corresponding to an optical transition between two levels in a quantum system can be written as:

ε0χ1ω=Mfi2σEfi-ω-iΓfi (9)

ε0χ1ω=Mfi2σE~2Efi-hω-ihΓfi×4Mfi2(Efi-hω)2+(hΓfi)2-(M22-M11)2(Efi-ihΓfi)(Efi-hω-ihΓfi) (10)

where Efi=Ef-Ei=En'm'-Enm is the energy interval between the energy levels of minibands considered for the study of absorptive transition and Mfi=ψf|ez|Ψi is the electron dipole moment of the transition from state 𝑖 to f. Here the polarization of electromagnetic radiation is chosen as z-direction. σ is the carrier density and Γ is the phenomenological relaxation rate, caused by the electron-phonon, electron-electron and other collision processes. Non-diagonal matrix element Γfi(if) of operator Γ is the inverse of the relaxation time τfiε0 denotes the dielectric permittivity of the vacuum.

The susceptibility χ(ω) is related to the changes in the refractive index Δn(ω)/nr and the absorption coefficient α(ω) as follows

Δn(ω)nr=Re(χ(ω)2nr2) (11)

α(ω)=ωμεrIm(ε0χ(ω)) (12)

where μ is the permeability of the material, εr is the real part of the permittivity of the medium, c is the speed of light in vacuum and nr represents the refractive index of the material of quantum well.

Using this approach, the linear and the third-order non-linear optical absorption coefficients are obtained analytically as follows:

α(1)(ω)=ωμεr|Mfi|2σΓfi(Efi-ω)2+(Γfi)2 (13)

α3ω,I=-ωμεrI2ε0nrcMfi2σhΓfiEfi-hω2+hΓfi22×4Mfi2-Mff-Mii23Efi2-4Efihω+h2(ω2-Γfi2)Efi2+(hΓfi)2 (14)

Here I is the incident optical intensity.

I=2εrμE~(w)2=2nrμcE~(w)2

The total absorption coefficient α(ω,I) is

α(ω,I)=α(1)(ω)+α(3)(ω,I) (15)

The linear and the third-order non-linear refractive index changes are obtained using above analysis as follows:

Δn(1)(ω)nr=σ|Mfi|22ε0nr2Efi-ω(Efi-ω)2+(Γfi)2 (16)

Δn3(ω,I)nr=-σMfi24ε0nr3 μcI(Efi-ω)2+(Γfi)22×4Efi-ωMfi2-Mff-Mii2Efi2+ω2×Efi-ωEfiEfi-ω-Γfi2-Γfi2(2Efi-Γ) (17)

Therefore, the total refractive index change Δn(ω)/nr can be written as

Δn(ω)nr=Δn(1)(ω)nr+Δn(3)(ω,I)nr (18)

In the next section, we present the obtained results and the implications related to them.

3.Numerical Results and Discussion

In the system developed in this study, the linear and non-linear optical properties such as linear and non-linear absorption coefficients and the refractive-index changes as a function of photon energy are analyzed given by Eq. (13-18) for the GaAs/AlxGa1-xAs MQW with δ-doping. We have used the following physical parameters for the numerical computation, μ=4π×10-7NA-2, refractive index nr=3.2, ϵ0=8.854×10⁻¹²Fm-1 and ϵr=1.218ϵ0.

The electron density is considered a unity. The parameters are suitable for GaAs/AlxGa1-xAs MQW. In our calculations, we have taken a position dependent electron effective mass, m*=(0.067+x*0.083)me where me is the free electron mass with x=0.25 as the stoichiometric ratio or Aluminium concentration ratio.

We consider a combined system of isolated δ doped five wells system with the barrier height of each well kept constant at 0.3 eV. Eq. (2) for this system is solved numerically by using the finite-difference technique to provide the allowed values of energy eigenvalues and eigenstates. The solution gives the energy spectrum and the corresponding squared wave functions as a function of the position of z as shown in Fig. 1. Results show that energy levels coincide with their single-well positions and are five-fold degenerate in absence of magnetic field, as can be observed from Fig. 2. At B=0 T , we have three minibands each consisting of five energy levels within the confining potential. The difference between energy levels in a miniband is close to zero in the absence of magnetic field. Further it is observed that δ doping gives rise to better quantum confinement of electrons which leads to lowering of energy levels in δ-doped MQW structure as compared to undoped structure. We represent the energies of the levels by E nm where m and n correspond to the quantum numbers representing m th level in the n th miniband. Eg: the eigenvalue labelled E 11 corresponds to the energy of first level in the first miniband; E 21 corresponds to the energy of first level in the second miniband, etc. The presence of a magnetic field breaks the degeneracy and the energy levels get apart from each other leading to a nonequidistant energy separation between them as can be seen from Fig. 2.

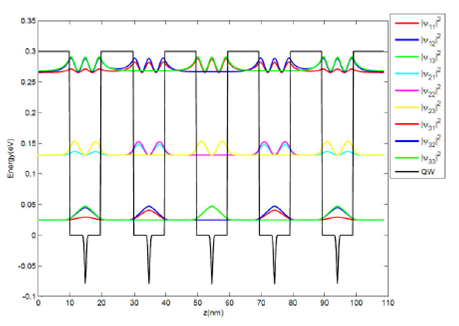
FIGURE 1 Schematic representation of formation of minibands, first three energy levels in each miniband and orresponding squared wavefunctions as a function of position in a five period on-center delta doped MQW structure when B = 0. 

FIGURE 2 Magnetic field dependence of energy levels in minibands in ±-doped MQWs. 

In this paper we perform the calculations for transitions from state n=2, m=1 to n'=3, m'=1 state i.e. from the first level in the second miniband to the first level in the third miniband. The matrix elements involved in intersubband transitions are n'm'|eEr|nm. In Fig. 3 we show the linear absorption coefficient α(1)(ω), the third-order non-linear absorption coefficient α(3)(ω,I), and the total absorption coefficients α(ω,I) as a function of the incident photon energy, ω. The relaxation time and laser field intensity are kept constant at 0.04 ps and 42.7 MW/cm2, respectively. The curves are plotted for three different values of the static magnetic field, B=2T, 4T and 6T. We notice that α(1)(ω), α(3)(ω,I) and α(ω,I) have observable peaks that correspond to the position where maximum absorption or resonance occurs when the energy of incident photon coincides with the interlevel difference of energy between the considered minibands. Besides for all values of a static magnetic field, the linear absorption coefficient α(1)(ω) is observed to be positive whereas the non-linear one α(3)(ω,I) is observed to be negative. This is expected from Eq. (13) and (14). However, the linear term makes a larger part of the total coefficient α(ω,I), therefore, the total absorption is also positive but with a decreased magnitude. We observe that the variations of peak values of α(1)(ω), α(3)(ω,I) and α(ω,I) are not a monotonous function of magnetic field The two factors-change in interlevel energy difference and change in dipole matrix element between the levels considered in the transition account for the observed behavior.

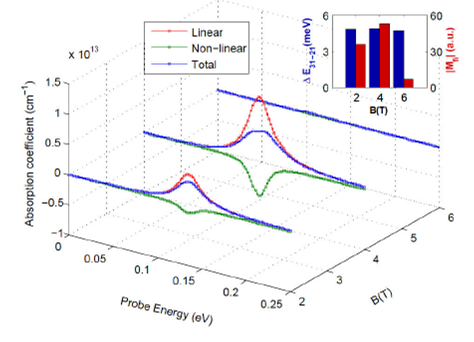
FIGURE 3 Plot of optical absorption coefficients as a function of the incident photon energy for different values of B. 

The variation of these two factors is shown by bar graphs in the inset of Fig. 3 and can be explained as follows: With the increase in magnetic field strength the separation between the energy levels increases, though the increase is not very much pronounced. This occurs due to the fact that as the magnetic field is increased, the energy of each individual level increases and energy levels move away from each other, however, due to avoided crossing (see magnified image in Fig. 2) the increase in energy level spacing is not very much significant. The increase in the magnetic field causes a small blue-shift of the resonant peaks towards higher energy values. Further, the change in amplitudes of resonant peaks can be accounted to change in the value of dipole matrix element. The linear term α(1)(ω) is proportional to the second power of transition dipole matrix element and the non-linear term α(3)(ω,I), it is proportional to the fourth power of |Mfi|. Since the change in the energy interval is not very much significant, the values of |Mfi| are an influential factor in determining the amplitudes of resonant peaks. The enhancement in value of dipole matrix element results in an increase of amplitudes of the linear as well as non-linear term of the absorption coefficient and vice-versa. It is to be noted, however, that in our MQW system, the variation of dipole matrix element shows complicated behavior with enhancement in field strength as can be observed from bar graph in an inset of Fig. 3. This is because the value of dipole matrix element depends on the overlap of the wave functions of the energy levels which shows a complicated behavior due to the involvement of five quantum wells. The wave functions that are bound inside the MQW potential are confined to only a few quantum wells and are not spread over the whole MQW structure. This leads to steep fall in the value of dipole matrix element for some B values as for the case of B=6T. In such cases least value of dipole matrix elements indicates least absorption and light passes unattenuated through the system at this magnetic field strength.

Now let us have a look at the results for the variation of the linear absorption coefficient α(1)(ω), the third-order non-linear absorption coefficient α(3)(ω,I), and the total absorption coefficients α(ω,I) are plotted as a function of the incident photon energy, ω for different values of strength of δ-potential,β=2.88, 11.52 and 20.16 in units of eVÅ as shown in Fig. 4. The laser field intensity and the magnetic field are kept constant at 42.7 MW/cm2 and 2T, respectively. The behaviour of amplitudes of peak values of absorption coefficients and stark shifts of resonant positions so observed can be explained on the basis of variation of interlevel spacing between levels of minibands and changes in dipole matrix elements so considered. With the increase in strength of δ potential, confining potential of the quantum well system changes and hence there is a change in interlevel spacing between minibands. There is a steep fall in interlevel spacing which starts increasing with β0.86 eVÅ upto β1.73eVÅ and again it falls. This results in the blue stark shift in the range β0.86-1.73 eVÅ and then red stark shift afterwards. Further, it is seen that dipole matrix element between the transition levels doesn’t show a monotonic behaviour. Initially, dipole matrix element increases with the increase in the value of β, it remains constant within a certain range from β0.15-1.15 eVÅ and then its value decreases abruptly which result in loss of transition between the levels. The decrease hence, results in loss of absorption of incident light for higher values of β and hence we can conclude that the strength of δ potential can be used as a tool to adjust the desired magnitude and position of optical absorption coefficient by controlling the quantum confinement of electrons and hence any device that is suitable for some specific purposes can be designed by δ-doping of MQW system.

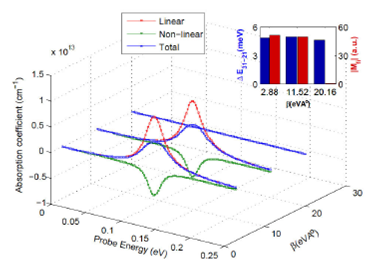
FIGURE 4 Optical absorption coefficients as a function of the incident photon energy for different values of the strength of ± potential. 

Figure 5 corresponds to the plot of the variation of absorption coefficients as a function of the incident photon energy, ω for different doping positions in each well of MQW. The magnetic field and laser field intensity are kept constant at 2T and 42.7 MW/cm2, respectively. Three δ-doping positions are considered: on-centre doping when δ-doping exists at the centre of each quantum well i.e z=0 and other two close to the edges of each quantum well on either side of z=0 i.e. on-edge doping. In Fig. 5 it is possible to detect a blue-shift in the resonant peak positions with the displacement of impurity positions towards the edges. This shift is accompanied by the decrease in amplitudes of linear and non-linear peak values of absorption coefficients. The blue shift can be accounted as arising due to the increase in interlevel energy difference. The decrease in amplitudes of peak values is due to fall in values of dipole matrix elements that happens in turn due to the decrease in wave function overlap. Further, it is observed that the interlevel energy difference and dipole matrix are symmetrically placed about the position of on-centre doping as can be observed from the inset plot. This leads to the symmetrical behaviour of linear, third order non-linear and total absorption coefficient for on-edge doping on either side of on-centre doping.

FIGURE 5 Optical absorption coefficients as a function of the incident photon energy for different values of doping positions in each well. 

The refractive index changes are another important optical parameters in optical studies of quantum nanostructures. The outcome of analogous calculations for the influence of various parameters on the linear, third order non-linear and total refractive index changes as a function of incident photon energy is presented in Fig. 6 and 7. As seen from figures, the linear refractive index increases steadily with photon energy and reaches a maximum value. In that case, the structure gives normal dispersion for any frequency of incident photon where d(Δn)/(dω)>0. As the photon energy approaches the resonance, the dispersion in the refractive index changes its sign. This anomalous dispersion, defined by d(Δn)/dω<0, is found at each resonant frequency of the system. This region is called an absorption band because the photon is very strongly absorbed, the linear, third order non-linear and total refractive index changes are equal to zero at this resonance photon energy. The observed variation in the amplitudes of the linear, third order non-linear and total refractive index changes with the variation of β and position of doping can be accounted to the growth or fall in the values of dipole matrix elements since refractive index changes depend directly on the value of electric dipole moments, as can be concluded from Eq. (16)-(18). The changes in peak values are accompanied by the stark shifts in the resonance position of refractive index changes coming from the increment or decrement in interlevel spacings between the minibands. Growth in the interlevel spacing results in the blue-shift (shift towards higher energy) and fall in the interlevel spacing results in the redshift (shift towards lower energy) of the resonance position of refractive index changes. As for the total refractive index changes, the linear change generated by the term χ(1) is positive, whereas the third-order non-linear change generated by the term χ(3) is negative. The variations in the Fig. 6 and 7 show the above characteristic features and hence confirm our previous results. Therefore, the total refractive index change is significantly reduced by the non-linear contribution.

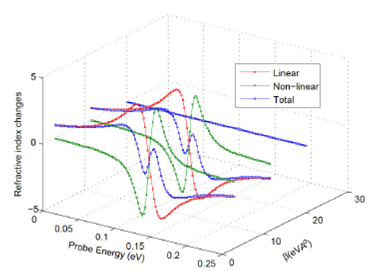
FIGURE 6 Plot of refractive index changes as a function of the incident photon energy for different values of strength of 𝛿 potential. 

FIGURE 7 Plot of refractive index changes as a function of the incident photon energy for different doping positions. 

4.Conclusion

In this paper, we have presented a complete study of linear and non-linear intersubband optical properties in a MQW with δ-doping under intense high-frequency laser field. The analytic expression of the optical absorption coefficients and refractive index changes was derived in detail by using the compact-density-matrix approach and the iterative method. The results of numerical calculations show that the optical absorption coefficients and refractive index changes are strongly affected by the magnetic field; the position and strength of the δ-doping potential, and the incident optical intensity. It is noted that the strength and the doping position are important factors in studying absorption spectra and hence should be taken into consideration when we do both theoretical calculation and experimental work. Moreover, in such structures, a favorable Stark shift characteristic occurs, which can be used to control and modulate the intensity output of the device. To our knowledge, there are very few reports of the absorption spectra in δ-doped quantum wells. With respect to the lack of such studies, we believe that our study makes an important contribution to the literature. The theoretical investigation of the linear and non-linear optical properties in such a system will lead to a better understanding of the properties of quantum wells. Such theoretical studies may have profound consequences about the practical application of the electro-optical devices, and the optical absorption studies also have extensive application in the optical communication.

References

1. S. J. Bass, J. Cryst. Growth 47 (1979) 613. [ Links ]

2. C. E. C., Wood, G. Metze, J. Berry, and L. F. Eastman, J. Appl. Phys. 51 (1980) 383. [ Links ]

3. E. F. Schubert, and K. Ploog, Jpn. J. Appl. Phys. 24 (1985) L608. [ Links ]

4. E. F. Schubert, A. Fischer, and K. Ploog, IEEE Transactions on Electron Devices 33 (1986) 625. [ Links ]

5. Y. Horikoshi, M. Kawashima, and H. Yamaguchi, Jpn. J. Appl. Phys. 25 (1986) L868. [ Links ]

6. T. W. Kim, Y. Kim, M.S. Kim, E. K. Kim, and S. K. Min, Solid State Communications 84 (1992) 1133. [ Links ]

7. G. M. Yang, S. G. Park, K. S. Seo, and B. D. Choe, Appl. Phys. Lett. 60 (1992) 2380. [ Links ]

8. C. H. Lee, Y. H. Chang, Y. W. Suen, and H. H. Lin, Phys Rev B 58 (1998) 10629. [ Links ]

9. C. H. Lee, Y. H. Chang, C. F. Huang, M. Y. Huang, H. H. Lin, and C. P. Lee, Chin J Phys 39 (2001) 363. [ Links ]

10. C. V. B. Tribuzya et al., Physica E 11 (2001) 261. [ Links ]

11. A. Tabata et al., Physics Procedia 28 (2012) 53. [ Links ]

12. D. S. Luo et al., Nanoscale Research Letters 6 (2011) 139. [ Links ]

13. J. Kundrotas et al., Lithuanian Journal of Physics 55 (2015) 264. [ Links ]

14. A. Marti et al., Thin Solid Films 511 (2006) 638. [ Links ]

15. A. I. Yakimov, A. V. Dvurechenskii, A. I. Nikiforov, and Y. Y. Proskuryakov, Journal Of Applied Physics 89 (2001) 5676. [ Links ]

16. L. C. West and S. J. Eglash, Appl. Phys. Lett. 46 (1985) 1156. [ Links ]

17. E. Ozturk, Opt. Commun. 294 (2013) 361. [ Links ]

18. C. Edmunds et al., Appl. Phys. Lett. 101 (2012) 102104. [ Links ]

19. V. Tulupenko et al., Physica E 74 (2015) 400. [ Links ]

20. S. Das, R.K. Nayak, T. Sahu, and A.K. Panda, Physica B: Condensed Matter 476 (2015) 91. [ Links ]

21. S. Almansour, H. Dakhlaoui, and E. Algrafy, Chin. Phys. Lett. 33 (2016) 027301. [ Links ]

22. C. A. Duquea et al., Superlatt. Microst. 87 (2015) 5. [ Links ]

23. S. Liang, W. Xie, H. A. Sarkisyan, A.V. Meliksetyan, and H. Shen, Superlatt. Microstruct. 51 (2012) 868. [ Links ]

24. I. Rodriguez-Vargas, M.E. Mora-Ramos, and C. A. Duque, Microelectronics Journal 39 (2008) 438. [ Links ]

25. K.A. Rodríguez-Magdaleno, J.C. Martínez-Orozco, I. Rodríguez-Vargas, M.E. Mora-Ramos, and C.A. Duque, Journal of Luminescence 147 (2014) 77. [ Links ]

26. J.G. Rojas-Briseño, J.C. Martínez-Orozco, I. Rodríguez-Vargas, M.E. Mora-Ramos, and C.A. Duque, Physica B: Condensed Matter 424 (2013) 13. [ Links ]

27. Dong-Feng Liu, Jian-Gang Jiang, Yu Cheng, and Jia-Feng He, Physica E 54 (2013) 253. [ Links ]

28. A. Deyasi, S. Bhattacharyya, and N. R. Das, Phys. Scr. 89 (2014) 065804. [ Links ]

29. D. M. Sullivan, and D. S. Citrin, J. Appl. Phys. 97 (2005) 104305. [ Links ]

30. M. Tsetseri, G. P. Triberis, Superlatt. Microstruct. 32 (2002)79. [ Links ]

31. M. Gambhir, M. Kumar, P.K. Jha, and M. Mohan, Journal of Luminescence, 143 (2013) 361. [ Links ]

32. P. Silotia, K. Batra, and V. Prasad, Optical Engineering 53 (2014) 027105. [ Links ]

33. C. J. Zhang, K. X. Guo, and Z. E. Lu, Physica E 36 (2007) 92. [ Links ]

34. J. Huang, and Libin, Phys. Lett. A 372 (2008) 4323. [ Links ]

Received: April 12, 2018; Accepted: April 27, 2018

*e-mail: monicagdu@gmail.com

Creative Commons License This is an open-access article distributed under the terms of the Creative Commons Attribution License