SciELO - Scientific Electronic Library Online

 
vol.64 número4A method to obtain orientation curves in Euler space for a seccond diffraction process in polycrystalsSpray-pyrolyzed Al22 O3-Ag Nano-Cerments coatings for solar absorbers índice de autoresíndice de materiabúsqueda de artículos
Home Pagelista alfabética de revistas  

Servicios Personalizados

Revista

Articulo

Indicadores

Links relacionados

  • No hay artículos similaresSimilares en SciELO

Compartir


Revista mexicana de física

versión impresa ISSN 0035-001X

Rev. mex. fis. vol.64 no.4 México jul./ago. 2018


Research

Effect of Re and Tm-site on morphology structure and optical band gap of ReTmO 3 (Re = La, Ce Nd, Gd, Dy, Y and Tm = Fe, Cr) prepared by sol-gel method

M. Tufiq Jamil1 

J. Ahmad1 

S. Hamad Bukhari1 

M. Saleem2 

1Department of Physics, Bahauddin Zakariya University, Multan 60800, Pakistan.

2Department of Physics, Syed Babar Ali School of Sciences and Engineering (SBASSE), Lahore University of Management Sciences (LUMS), Opposite Sector U, DHA, Lahore 54792, Pakistan.


Abstract

Rare earth nano sized pollycrystalline orthoferrites and orthocromites ReTmO3 (Re = La, Nd, Gd, Dy, Y and Tm = Fe, Cr) have been synthesized by sol-gel auto combustion citrate method. The samples have been characterized by means of X-ray diffraction (XRD), scanning electron microscope (SEM), energy dispersive X-ray spectroscopy (EDX), and UV-visible spectroscopy. The samples are single phase, as confirmed by XRD analysis, and correspond to the orthorhombic crystal symmetry with space group pbnm. Debye Scherer formula and Williamson Hall analysis have been used to calculate the average grain size, which is consistent with that of determined from SEM analysis and varied between 25-75 nm. The elemental compositions of all samples have been checked by EDX analysis. Different crystallographic parameters are calculated with strong structural correlation among Re and Tm sites. The optical energy band gap has been calculated by using Tauc relation estimated to be in the range of 1.77 - 1.87 eV and 2.77 - 3.14 eV, for ReFeO3 and ReCrO3, respectively.

Keywords: Sol-gel method; orthoferrites and orthocromites; optical band gap; structural characteristics.

PACS: 61.05.cp; 73.63.Bd

1. Introduction1 3 4 5 6 7 Fig. 1 8 13 14 18 19 20 21 22 23 24

ReTm3ReTmfdReTm-ReTm3ReTmReTm6TmReTm3Re3NRe3-Re3-,Re3,Re3,ReTmReTm3ReTmReTmReTm3ReTm

FIGURE 1 Orthorhombic perovskite structure of ReTmO3

2. Experiment

ReTm3ReTmRe332ReTm332Tm68724Re3Re3

Re(NO3)3.6H2O+Tm(NO3)3.9H2O+C6H8O7.H2O+NH4OHReTmO3+6CO2+3.5N2g+nH2O(g) (1)

where (Re = La, Ce, Nd, Gd, Dy, Y) and (Tm = Fe, Cr). Nucleation is responsible for the formation of grains. In our case transition metal ions act as seed crystal and responsible of nucleation during the sol-gel process. The stoichiometric ratio of rare earth and transition metal ions is equal, so more nucleation was observed in synthesis process that is responsible to nanocrystals formation. The phase identification was carried out using Bruker D8 advance X-ray diffractometer equipped with Cu-K α source of X-rays of wavelength 1.54056 Å. Average grain size was estimated by Scherrer’s formula considering the position and broadening of the most intense diffraction peak in XRD spectra and by Williamson Hall analysis. Morphology and elemental composition of the samples were observed using FEI NOVA 450 scanning electron microscope (SEM) equipped with Oxford energy dispersive X-rays spectroscopy (EDS) detector. The UV-visible measurements were taken by using Perkin Elmer Lambda 950 UV/VIS/NIR spectrophotometer.

3. Results and discussion

(5)3.1. Structural and morphological Properties

Figure 2 shows the X-ray diffraction pattern of a representative sample LaFeO3 among the prepared samples analyzed by using Rietveld refinement technique considering orthorhombic structure with Pbnm space group. The pseudo-Voigt function was used to perform fitting of diffraction peaks by using the JANA2006 software. A good fitting has been clearly seen between observed and refined XRD data, as all the peaks are well overlapped with fitted data, which confirm single phase has been successfully formed and no impurity peak has been observed. All samples of ReTmO3 (Re = La, Nd, Gd, Dy, Y and Tm = Fe, Cr) were fitted by JANA2006 (not shown here). Figure 3(a) shows the XRD spectra of polycrystalline ReTmO3. The diffraction peaks are narrow and sharp, which reflects the high crystalline nature of the prepared samples. The diffraction pattern of ReTmO3 (Re = La, Nd, Gd, Dy, Y and Tm = Fe, Cr), suggest orthorhombic perovskite structure with space group pbnm (No. 62). The XRD pattern of polycrystalline Ce(Fe,Cr)O3, where a couple of secondary phases are present as shown in Fig. 3(b). Thus single phase Ce(Fe,Cr)O3 could not be obtained by sol-gel combustion method. The calculated lattice parameters (a, b, c), unit cell volume (V), and data collected about miller indices (hkl) of lattice planes of as prepared ReTmO3 (Re = La, Nd, Gd, Dy, Y and Tm = Fe, Cr), are tabulated in Table I. It is clearly shown that, in all cases, c/2 lies between a and b(b>c/2>a) (see Table I), this is the characteristic of the O-type orthorhombicaly distorted perovskite oxides25, where the distortion occurs due to the steric effect and Jahn Teller effect9.

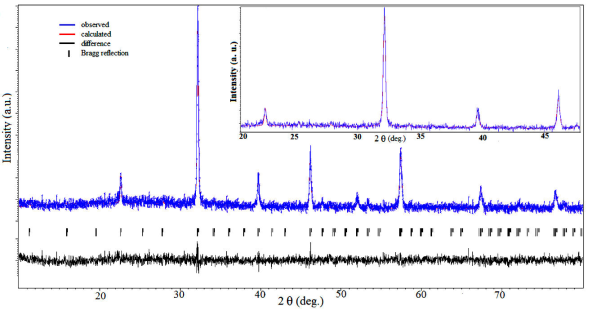
FIGURE 2 (color online) Rietveld refinement of the XRD pattern by using the JANA2006 program of representative sample LaFeO3. Inset shows zoom region of the fit of calculated curve on observed curve. 

FIGURE 3 XRD pattern of (a) ReTmO3 (Re = La, Nd, Gd, Dy, Y and Tm = Fe, Cr) and (b) Ce(Fe,Cr)O3. The asterisks on the peaks show the cerium dioxide (CeO2) phase and circles on the peaks show. Iron(III) oxide or ferric oxide (Fe2O3) and Chromium(III) oxide (Cr2O3). 

TABLE I Summary of XRD refined data of ReTmO3 (Re = La, Nd, Gd, Dy, Y and Tm = Fe, Cr). Where S.C (Sample Code), C.F (Chemical Formula), F.W (Formula Weight), C.S (Crystal Structure), S.G (Space Group), D.C (Data Collected). 

S.C LF(C)O NF(C)O GF(C)O DF(C)O YF(C)O
C.F LaFe(Cr)O3 NdFe(Cr)O3 GdFe(Cr)O3 DyFe(Cr)O3 YFe(Cr)O3
a(Å) 5.55 (5.48) 5.45 (5.42) 5.35 (5.31) 5.30 (5.262) 5.28 (5.24)
b(Å) 5.56 (5.51) 5.58 (5.48) 5.62 (5.52) 5.60 (5.50) 5.59 (5.51)
c(Å) 7.87 (7.76) 7.77 (7.69) 7.67 (7.60) 7.62 (7.55) 7.60 (7.53)
V(Å3) 243.0 (234.3) 236.5 (228.6) 230.2 (222.6) 226.3 (262.5) 224.8 (217.4)
F.W 242.7 (238.9) 248.1 (244.2) 261.1 (257.2) 266.3 (262.5) 192.7 (188.9)
Z 4 4 4 4 4
C.S Orthorhombic Orthorhombic Orthorhombic Orthorhombic Orthorhombic
S.G Pbnm Pbnm Pbnm Pbnm Pbnm
S.G 62 62 62 62 62
D.C 0≤h≤4 0≤k≤4 0≤1≤6 0≤h≤4 0≤k≤5(4) 0≤1≤6 0≤h≤4 0≤k≤5(4) 0≤1≤6 0≤h≤4 0≤k≤5(4) 0≤1≤6 0≤h≤4 0≤k≤5(4) 0≤1≤6

The values of average grain size of ReTmO3, which was calculated by using the well known Scherrer’s formula [ D=0.89λ/βcosθ, where λ is the wavelength of X-ray radiation (1.54056 Å), θ is the diffraction angle and β is the full width at half maximum (FWHM) of diffracted peaks], are shown in Table II and Table III. It is obvious to identify that the grain size decreases as ionic radius of Re and Tm decreases.

In nanomaterials lattice strain and grain size both have their self contribution to peak broadening of X-ray diffraction and lattice strain is to be contributed in peak broadening due to large volume of grain boundaries26,27. In order to measure the grain size precisely, the lattice strain calculations are very important28. Hence, the Williamson-Hall (W-H) method was used for estimating the lattice strain and grain size29,30. In addition, lattice strain and grain size independently contribute to the total peak broadening. The peak broadening induced by strain (βS) is given by the relation βS = 4 εtanθhkl. Assuming that the strain present in the material is uniform, the W-H equation for the total peak broadening is given by31,

βhkl=βS+βD,βhkl=4εtanθhkl+kλDcosθhkl, (2),(3)

Rearranging Eq. (3) gives:

βhklcosθhkl=4εsinθhkl+kλD, (4)

where k is the shape factor and D is the grain size. A graph is plotted by taking 4sinθhkl along X-axis and βcosθhkl along Y-axis as shown in Fig. 4. In W-H analysis, the strain present in the material is extracted from the slope and the grain size is estimated from the Y-intercept of the linear fit made to the plot. The estimated values of grain size and lattice strain are (60.52 nm) and (1.32×10⁻³) for NdFeO3 and (67.60 nm) and (2.57×10⁻³) for NdCrO3 respectively. The small values of lattice strain indicate that the volume of grain boundries should be small for prepared samples. The values of grain size estimated by W-H analysis for ReFeO3 and ReCrO3 are shown in Table II and Table III, respectively. The SEM micrographs of all samples of the polycrystalline ReTmO3 (Re = La, Nd, Gd, Dy, Y and Tm = Fe, Cr) which were taken at accelerating voltage of 10 KV and magnification of 80 K are shown in Fig. 5(a) to (l). Large grains with less grain boundaries can easily be seen from micrographs. However, grains show no perfect alignment, which is a typical characteristic of polycrystalline sample. The individual grains shown in the Fig. 5(a) to (l), are of the round shape with an average grain size 25-75 nm, which is consistent with XRD results. Moreover, from Fig. 5(f) and 5(l), which show the SEM images of CeCrO3 and CeFeO3 respectively, it is clear there is no formation of grains were observed as in other SEM images. These results also consistant with XRD analysis, the two phase formation in CeCeO3 and CeFeO3. In Fig. 6(a) to (l), EDX spectra show the chemical composition of the synthesized samples of ReTmO3 (Re = La, Nd, Gd, Dy, Y and Tm = Fe, Cr). It can be seen that there are clear peaks of rare earth elements (Re = La, Nd, Gd, Dy, Y), Iron (Fe), Chromium (Cr), and oxygen (O) elements present with the molar ratio of about 1:1:3 (Re:Fe(Cr):O), giving a stoichiometric formula for ReFe(Cr)O3, confirmed with analysis of atomic % of all elements present in a sample shown in Fig. 6(a) to (l). There is no peak of any impurity elements which confirms the single phase formation of the samples. However, single peak of carbon appeared which is due to the carbon tape on which samples were mounted with holder. The value of average grain size calculated from XRD pattern is consistent with the one obtained from SEM analysis.

FIGURE 4 Williamson Hall analysis of (a) NdFeO3 and (b) NdCrO3

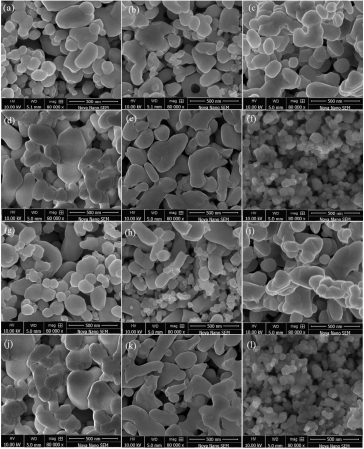
FIGURE 5 SEM images of perovskite (a) LaCrO3 (b) NdCrO3 (c) GdCrO3 (d) DyCrO3 (e) YCrO3 (f) CeCrO3 (g) LaFeO3 (h) NdFeO3 (i) GdFeO3 (j) DyFeO3 (k) YFeO3 and (l) CeFeO3

FIGURE 6 EDX images of perovskite (a) LaCrO3 (b) NdCrO3 (c) GdCrO3 (d) DyCrO3 (e) YCrO3 (f) CeCrO3 (g) LaFeO3 (h) NdFeO3 (i) GdFeO3 (j) DyFeO3 (k) YFeO3 and (l) CeFeO3

The variation in lattice parameters (a,b,c/2) and cell volume (V) with ionic radii of rare earth cations on Re site in the prepared ReFeO3 (Re = La, Nd, Gd, Dy, Y) is shown in Fig. 7(a). It is obvious from the graph that a, c/2 and V increases with the increase in the ionic radius of Re site ion i.e. [from Y3+ (1.04 Å) to La3+ (1.172 Å)], but lattice parameter b remains almost unaltered. The similar variations were observed in lattice parameters and cell volume for ReCrO3 (Re = La, Nd, Gd, Dy, Y), not shown in the graph, but values for this system are given in Table I.

FIGURE 7 Variation of (a) lattice parameters (a; b; c= √2) and cell volume V. (b) Orthorhombicity factor (b/a). (c) Orthorhombic distortion (D) and cell distortion (d). (d) Orthorhombic strain (S) and Elastic strain (E) with ionic radius of Re-site. 

The orthorhombic factor (b/a) sharply increases, with decreasing ionic radius of Re site in ReFeO3, as shown in the Fig. 7(b). Similar trend is also obtained for ReCrO3, not shown here. To study the structural distortion, cell distortion (d) [32] was calculated as,

d=(a/2-ap)2+(b/2-ap)2+(c/2-ap)23ap×104,

where ap=(a/2+b/2+c/2)/3. The value of cell distortion increases for both ReFe(Cr)O3 by the replacement of large ionic radius La3+ to small ionic radius Y3+ are given in Table II and Table III. It is worth mentioning that the decrease in cell distortion has been observed when we replace bigger Re3+ cation in ReFeO3 as indicated in Fig.7(c), similar results were obtained for ReCrO3. According to the analysis mentioned above, the variance of lattice parameters with coupled substitution on Re site and on Tm site is the result of distortion in TmO6 octahedra for matching Re sizes. That is why distortion at octahedral site increases with replacement of the small ionic radius on Re site, because the cations rearrange themselves in such a way that they fit in the unit cell and results in decreasing the unit cell volume.

TABLE II Crystallographic characteristics of ReFeO3 (Re = La, Nd, Gd, Dy, Y). 

Sample Code LFO NFO GFO DFO YFO
Chemical formula LaFeO3 NdFeO3 GdFeO3 DyFeO3 YFeO3
Orthorhombic distortion (D) 0.4150 0.4102 0.4056 0.4057 0.4056
Cell distortion (d) x10-6 3 386 1673 2005 2252
Orthorhombic strain (S) 0.0018 0.0237 0.0493 0.0543 0.0577
Elastic strain (E) 0.0552 0.0600 0.0656 0.0693 0.0723
Grain size (nm)(Scherrer formula) 52.38 39.00 31.62 27.78 25.48
Grain size (nm)(W-H analysis) 67.56 60.52 47.38 40.29 35.77
BET surface area (m2/g) 17.26 22.08 25.18 27.61 41.32
X-ray density (dx-ray) (g/cm3) 6.64 6.97 7.54 7.82 5.70
Bulk density (d bulk ) (g/cm3) 5.20 5.43 5.92 6.11 3.32
Porosity(P) 0.2163 0.2212 0.2147 0.2193 0.4178

TABLE III Crystallographic characteristics of ReCrO3 (Re = La, Nd, Gd, Dy, Y). 

Sample Code LCO NCO GCO DCO YCO
Chemical formula LaCrO3 NdCrO3 GdCrO3 DyCrO3 YCrO3
Orthorhombic distortion (D) 0.0047 0.0071 0.0272 0.0323 0.0358
Cell distortion (d) x10-6 30 60 940 1320 1620
Orthorhombic strain (S) 0.0062 0.0097 0.0375 0.0446 0.0493
Elastic strain (E) 0.0599 0.0653 0.0708 0.0749 0.0766
Grain size (nm)(Scherrer formula) 55.00 41.62 38.82 36.89 33.79
Grain size (nm)(W-H analysis) 72.30 67.60 53.52 44.29 41.47
BET surface area (m2/g) 16.05 20.32 20.14 20.38 30.77
X-ray density (dx-ray) (g/cm3) 6.78 7.09 7.68 7.98 5.77
Bulk density (d bulk ) (g/cm3) 5.05 5.28 5.77 5.96 3.17
Porosity(P) 0.2545 0.2565 0.2488 0.2537 0.4514

Orthorhombic distortion (D), which is defined as the ratio of standard deviation to average of the lattice parameters is calculated as33,

D=(ai-a¯)2a¯, (6)

where ai = a, b and c/2 and a¯ is the average of ai. The orthorhombic distortion remains almost constant in region of ionic radii of Re3+ 1.078 Å, in this region lattice parameter b increases slightly. After further increase in ionic radio of Re3+ a linear increase has been observed in orthorhombic distortion, in this region lattice parameter b slightly decreases. The variation in orthorhombic distortion with Re3+ ionic radii is shown in Fig. 7(c). The elastic strain of the prepared compounds can be calculated by using the formula E = β/2cotθ. The value of elastic strain increases with the decrease in the grain size both for ReFeO3 and ReCrO3 as obvious from Table II and Table III. The observed variation in the calculated elastic strain in ReFe(Cr)O3 elaborate the broadening of the XRD pattern. The elastic strain decreases with the increase in Re site ionic radii for ReFeO3 as shown in Fig. 7(d). The spontaneous orthorhombic strain, defined as S = 2(a - b)/(a + b), is tabulated in Table II. The value of S decreases from 0.0577 to 0.0118 for YFO to LFO. The variation in orthorhombic strain with ionic radius of rare earth cations is shown in Fig. 7(d). The reason for decrease of this parameter may be the substitution on Re site of smaller ionic radius cation Y3+ to bigger La3+. The similar results also obtained for YCO to LCO i.e. 0.0493 to 0.0062. It is obvious from the results that replacement of small radius transition metal cation Fe3+ to big radius Cr3+ on Tm-site of ReTmO3 also gives the similar trend i.e. decrease in the orthorhombic strain. The X-ray density, bulk density and porosity for all samples were determined using the following relations

FIGURE 7 Variation of (a) lattice parameters (a; b; c=√2) and cell volume V. (b) Orthorhombicity factor (b/a). (c) Orthorhombic distortion (D) and cell distortion (d). (d) Orthorhombic strain (S) and Elastic strain (E) with ionic radius of Re-site. 

dx-ray=ZMNAVcell, (7)

where M the molar mass, Z is the number of molecules per formula unit (4 for the orthorhombic structure), N A Avogadro s number (6.02×10²³ /mole) and V cell is the unit cell volume. The bulk density was calculated by the following relation,

dbulk=mV, (8)

where 𝑚 is the mass and 𝑉 = πr2h (where r is the radius and h is the height/thickness of pellet) is the volume of the pellet. The porosity (P) of all the samples was calculated using the equation,

P=1-dbdx, (9)

where db is the bulk density and dx is the X-ray density. The measured values of dx, db, and P of ReFeO3 for various Re (Re = La, Nd, Gd, Dy, Y) site replacement are tabulated in Table II. Figure 8 shows that the dx and the db increase with increase in the formula weight of the prepared ReFeO3 for various Re (Re = La, Nd, Gd, Dy, Y) compounds. The increase in the dx is considered to be due to the fact that the atomic mass of various Re [Re= Y (89 amu), La (139 amu), Nd (144 amu), Gd (157 amu), Dy (162.5 amu)] increases due to which formula weight or mass of the compound increases . While the increase in the db is due to the fact that increase in value of densities of Re [Re = Y (4.472 g/cm3), La (6.162 g/cm3), Nd (7.400 g/cm3), Gd (7.900 g/cm3), Dy (8.536 g/cm3)]. The magnitude of the db is smaller than that of the dx as can be seen from the graph. These results indicate that the experimental db is less than the theoretical dx due to the presence of pores created during preparation or sintering process of the samples . Figure 8 shows the 𝑃 decreases with the increase of formula weight of the sample from YFO to LFO, but remains almost constant for further increase in the formula weight of prepared compounds. The increase in the db confirms that samples become denser with the increase in density of individual Re site element, due to which the porosity of the samples decreases.

FIGURE 8 Variation in x-ray density (dx), bulk density (db) and porosity (P) with variation of the formula weight of ReFeO3 (Re = Y, La, Nd, Gd, Dy). 

The Brunauer-Emmett-Teller (BET) specific surface areas of ReTmO3 (Re = La, Nd, Gd, Dy, Y and Tm = Fe, Cr) nanoparticles are measured by the BET relation of the form,

BET=6(dx-ray)D, (10)

where D is the orthorhombic distortion and dx-ray is the X-ray density. The values of the specific surface area are given in Table II and III for ReFeO3 and ReCrO3, respectively.

3.2. Optical Properties

The obtained UV-visible diffuse reflectance spectra (DRS) of 𝑅𝑒FeO 3 and 𝑅𝑒CrO 3 (Re = La, Ce, Nd, Gd, Dy, Y) were measured by using UV/VIS/NIR spectrophotometer and are shown in Fig. 9(a) and (b), respectively. The absorbance spectrum of ReFeO3 and ReCrO3 is obtained from their reflectance spectrum according to the Kubelka-Munk theory38. Moreover, optical energy band gap of ReFeO3 and ReCrO3 (Re = La, Ce, Nd, Gd, Dy, Y) is estimated by using the Tauc relation39.

FIGURE 9 UV-visible reflectance spectra of (a) ReFeO3 and (b) ReCrO3

αhν=A(hν-Eg)n, (11)

where hv is the energy of the incident photon, α is the absorption coefficient, A is a characteristic parameter, Eg is the band gap. Exponent n specify the type of transition and it may be 1/2 or 2 for the allowed direct or allowed indirect transition, respectively. Here, we assume a direct band gap system and from the plot of (αhν)1/2 versus hv by extrapolating the linear portion to the hv (i.e. α = 0) determine theE g . The obtained value of E g for ReFeO3 and ReCrO3 is found to be in the range 1.77 - 1.87 eV and 2.77 - 3.14 eV, respectively as shown in Fig. 10(a) and (b). It is noted that in ReFeO3 only single band gap is observed due to the transition from O 2p valence band to Fe 3d conduction band. This constitues a charge transfer energy gap. Interestingly, three edges are observed for ReCrO3 at 1.58 eV, 2.20 eV and 3.14 eV values for YCrO3. Khuong P Ong et al. have also observed three types of energy gap in LaCrO3 theoretically . Interestingly similar trend of energy gaps were also observed experimentally in our prepared compounds of family of orthochromites. The energy gap at 1.58 eV (value for YCrO3), which is the energy band gap among the occupied t2g (Cr 𝑑 𝑥 2 − 𝑦 2 , 𝑑 𝑥𝑧 , and 𝑑 𝑦𝑧 ) and unoccupied eg (Cr dz2 and dxy) states, has been observed. This type of energy gap is Mott-type insulating gap. The second edge at 2.20 eV (value for YCrO3) reveals the optical transitions between the Cr t2g and Cr e g bands which are, of course, partly hybridized with O 𝑝. These transitions are in visible range and indicate the color of various orthocromites ReCrO3. The theoretical calculation reveals that the green color of these prepared compounds have its origin from the transition between Cr t2g bands centered at (-0.23 eV) and Cr e g bands at (2.15 eV)40. Another important transition at 3.14 ev (value for YCrO3), shows the transition between the top of O p bands and the bottom of the Cr e g conduction bands, this constitues a charge transfer gap. T. Arima et al. estimated E g for LaCrO3 and YCrO3 experimentally 41,42, which is consistent with the observed values of optical band gap of ReCrO3. So far, the experimental optical gap at higher energy edge for ReCrO3 was considered as the energy band gap between the transition to the top of the valance band and the bottom of the conduction band by previous theoretical works . The minimum E g for Fe-based system (i.e. 1.77 eV) than that of Cr-based system (i.e. 2.77 eV) may be attributed to lower energy of 3d orbital of Fe than that of Cr.

FIGURE 10 Tauc plot of (a) ReFeO3 and (b) ReCrO3

4.Conclusion

The sol-gel auto combustion citrate method is successfully used for the synthesis of polycrystalline ReTmO3 (Re = La, Nd, Gd, Dy, Y and Tm = Fe, Cr) and single phase character has been confirmed by XRD patterns. A systematic increase in grain size with increasing r Re and r Tm has been observed and found to vary from 25-75 nm for both ReFeO3 and ReCrO3, which is consistant with SEM results. The various crystallographic parameters have been calculated and found to be affected by changing Re and Tm sites as described earlier. The allowed direct E g estimated to be 1.77 - 1.87 eV and 2.77 - 3.14 eV for ReFeO3 and ReCrO3, respectively. Three edges are observed for ReCrO3 at 1.58 eV which is a Mott-type insulating gap, at 2.20 eV are in visible range corresponds to light green color of orthocromates and at 3.14 eV this is due to charge transfer gap (E g ) between O 2p valance and Cr 3d conduction band. Moreover, the E g has larger value (∼ 1 eV) in ReCrO3 as compared to ReFeO3 which may be attributed to the Jahn Teller distortion.

REFERENCES

1. J.-S. Zhou, J. Goodenough, B. Dabrowski, Phys. Rev. lett. 95 (2005) 127204. [ Links ]

2. J. Torrance, P. Lacorre, A. Nazzal, E. Ansaldo, C. Niedermayer,.. Phys. Rev. B 45 (1992) 8209. [ Links ]

3. X. Granados, J. Fontcuberta, X. Obradors, L. Manosa, J. Torrance,.. Phys. Rev. B 48 (1993) 11666. [ Links ]

4. N. Q. Minh,.. J. Am. Ceram. Soc. 76 (1993) 563. [ Links ]

5. K. Haralambous, Z. Loizos, N. Spyrellis,.. Mater. Lett. 11 (1991) 133. [ Links ]

6. C. Alcock, R. Doshi, Y. Shen,.. Solid State Ionics 51 (1992) 281. [ Links ]

7. H. Aono, E. Traversa, M. Sakamoto, Y. Sadaoka,.. Sens. Actuators, B 94 (2003) 132. [ Links ]

8. S. Bukhari, J. Ahmad,.. Acta Phys. Pol., A 129 (2016) 43. [ Links ]

9. F.-K. Chiang, M.-W. Chu, F. Chou, H. Jeng, H. Sheu, F. Chen, C. Chen,.. Phys. Rev. 83 (2011) 245105. [ Links ]

10. B. Naidu, U. Gupta, U. Maitra, C. Rao,.. Chem. Phys. Lett. 591 (2014) 277. [ Links ]

11. P. Negi, G. Dixit, H. Agrawal, R. Srivastava,.. J. supercond. Novel Magn. 26 (2013) 1611. [ Links ]

12. S. Saha, S. Chanda, A. Dutta, T. Sinha,.. Mater. Res. Bull. 48 (2013) 4917. [ Links ]

13. X. Wang, D. Li, T. Cui, P. Kharel, W. Liu, Z. Zhang,.. J. Appl. Phys. 107 (2010) 09B510. [ Links ]

14. O. Buassi-Monroy, C. Luhrs, A. Chávez-Chávez, C. Michel,.. Mater. Lett. 58 (2004) 716. [ Links ]

15. M. Alifanti, G. Bueno, V. Parvulescu, V. Parvulescu, V. C. Corberan,.. Catal. Today 143 (2009) 309. [ Links ]

16. W. Chen, F. Li, J. Yu,.. Mater. Lett. 61 (2007) 397. [ Links ]

17. V. Dudnikov, D. Velikanov, N. Kazak, C. Michel, J. Bartolome, A. Arauzo, S. Ovchinnikov, G. Patrin,.. Phys. Solid State 54 (2012) 79. [ Links ]

18. L. Predoana, B. Malic, M. Kosec, M. Carata, M. Caldararu, M. Zaharescu,.. J. Eur. Ceram. Soc. 27 (2007) 4407. [ Links ]

19. S. Saha, S. Chanda, A. Dutta, T. Sinha,.. J. Sol-Gel Sci. Technol. 69 (2014) 553. [ Links ]

20. S. Mathur, H. Shen, N. Lecerf, A. Kjekshus, H. Fjellvaag, G. F. Goya,.. Adv. Mater. 14 (2002) 1405. [ Links ]

21. A. Wu, H. Shen, J. Xu, L. Jiang, L. Luo, S. Yuan, S. Cao, H. Zhang,.. J. Sol-Gel Sci. Technol. 59 (2011) 158. [ Links ]

22. S. Hui, X. Jiayue, W. Anhua,.. J. Rare Earth. 28 (2010) 416. [ Links ]

23. S. Wang, K. Huang, C. Hou, L. Yuan, X. Wu, D. Lu,.. Dalton Trans. 44 (2015) 17201. [ Links ]

24. A. P. B. Selvadurai, V. Pazhanivelu, C. Jagadeeshwaran, R. Murugaraj, I. P. Muthuselvam, F. Chou, P. M. Gazzali, G. Chandrasekaran,.. J. Sol-Gel Sci. Technol. 80 (2016) 827. [ Links ]

25. E. Pollert, S. Krupička, E. Kuzmičová,.. J. Phys. Chem. Solids 43 (1982) 1137. [ Links ]

26. B. Hall, D. Zanchet, D. Ugarte,.. J. Appl. Crystallogr. 33 (2000) 1335. [ Links ]

27. H. Jiang, M. Rühle, E. Lavernia,.. J. Mater. Res. 14 (1999) 549. [ Links ]

28. V. Biju, N. Sugathan, V. Vrinda, S. Salini,.. J. Mater. Sci. 43 (2008) 1175. [ Links ]

29. G. Williamson, W. Hall,.. Acta Metall. 1 (1953) 22. [ Links ]

30. F. Mustafa, S. Aslam A. Jamil, M. A. Ahmad,.. Optik 140 (2017) 38. [ Links ]

31. A. W. Burton, K. Ong, T. Rea, I. Y. Chan,.. Microporous Mesoporous Mater. 117 (2009) 75. [ Links ]

32. G. Huo, D. Song, Q. Yang, F. Dong,.. Ceram. Int. 34 (2008) 497. [ Links ]

33. K. Knížek, Z. Jirák, J. Hejtmánek, M. Veverka, M. Maryško, G. Maris, T. Palstra,.. Eur. Phys. J. B 47 (2005) 213. [ Links ]

34. R. Kelsall, I. W. Hamley, M. Geoghegan, Nanoscale science and technology, (John Wiley & Sons, 2005). [ Links ]

35. J. Ahmad, M. Q. Awan, M. E. Mazhar, M. N. Ashiq,.. Physica B 406 (2011) 254. [ Links ]

36. A. Sattar,.. Egptian J Sol 27 (2004) 99. [ Links ]

37. M. Ahmed, N. Okasha, M. Oaf, R. Kershi,.. J. Magn. Magn. Mater. 314 (2007) 128. [ Links ]

38. P. Kubelka, F. Munk,.. Z. Tech. Phys 12 (1931) 593. [ Links ]

39. J. Tauc, R. Grigorovici, A. Vancu, ..Phys. Status Solidi B 15 (1966) 627. [ Links ]

40. K. P. Ong, P. Blaha, P. Wu,.. Phys. Rev. B 77 (2008) 073102. [ Links ]

41. T. Arima, Y. Tokura, J. Torrance,.. Phys. Rev. B 48 (1993) 17006. [ Links ]

42. T.-h. Arima, Y. Tokura,.. J. Phys. Soc. Jpn. 64 (1995) 2488. [ Links ]

43. N. Hamada, H. Sawada, K. Terakura, Spectroscopy of Mott Insulators and Correlated Metals (1995) pp. 95-105. [ Links ]

44. I. Solovyev, N. Hamada, K. Terakura, ..Phys. Rev. B 53 (1996) 7158. [ Links ]

45. Z. Yang, Z. Huang, L. Ye, X. Xie,.. Phys. Rev. B 60 (1999) 15674. [ Links ]

Received: January 22, 2018; Accepted: April 14, 2018

Creative Commons License This is an open-access article distributed under the terms of the Creative Commons Attribution License