Research
Research in Condensed Matter
Optimal doping for d-wave superconducting ground states within the generalized Hubbard model
B. Millána
L.A. Pérezb
J. Samuel Millánc
*
a Instituto de Investigaciones en Materiales, Universidad Nacional Autónoma de México, Apartado Postal 70-360, 04510, Ciudad de México, México.
b Instituto de Física, Universidad Nacional Autónoma de México, Apartado Postal 20-364, 01000, Ciudad de México, México.
c Facultad de Ingeniería, UNACAR, 24180, Cd. del Carmen, Campeche, México.
ABSTRACT
A single-band generalized Hubbard model that describes two-dimensional superconductivity with
d-wave symmetry on a square lattice within the BCS formalism is considered. For
a set of Hamiltonian parameters and varying the ratio between nearest-neighbor
and next-nearest neighbor hoppings (t'/t); an optimal electron
density (nop) can be found for each
t'/t value, where the temperature is maximum
(Tc-max). After calculating the
superconducting gap at T=0 K and the corresponding ground state energy
(Eg) for all the carrier
concentrations, a ground state energy minimum
(Eg-min) is found close to
half filling. Since Tc-max is the
highest critical temperature for a given ratio t'/t, the
minimum of all the Tc-max values
defines a supreme for this set of temperatures, named as
Tc-max-sup . The
corresponding optimal doping for
Tc-max-sup will be called
nop-sup, and the results show
that Eg-min is located at
nop-sup. The Fermi surface (FS)
is analyzed for carrier concentrations close to
nop-sup and it is suggested
that the location for over (OD) and under (UD) doping regimes
(nOD >
nop-sup
> nUD) could define a
pseudogap zone for high critical temperature superconductors.
Keywords: Theories and models of superconducting state; pairing symmetries (other than s-wave); pseudogap regime
PACS: 74.20.-z; 74.20.Rp; 74.72.Kf
1. Introduction
Anisotropic superconductivity has been subject of study since the discovery of high critical
temperature superconductors (HTSC) in 1986 by Bednorz and Müller. d-wave symmetry
appears in phase sensitive experiments1 for several hole- and electron-doped cuprates. Three-band
Hubbard models have been proposed to describe the dynamics of the carriers on the
CuO2 planes2 and the
electronic states close to the Fermi energy (EF) can be reasonably well described by a single-band tight-binding model on
a square lattice with second neighbor hoppings3. In this work, a generalized Hubbard model that
describes d-wave superconductivity on a square lattice within the BCS formalism is
considered4,5. This model contains
nearest-neighbor (Δt) and next-nearest-neighbor (Δt3) correlated hoppings, in addition to on-site (U) and
inter-site (V) coulombic repulsions. The mean-field electronic
dispersion relation (εMF) in the studied square lattice includes mean-field single-particle
hoppings that are functions of the electron density (n). To clarify
the importance of these mean-field hoppings, a systematic study of the
superconducting critical temperature (Tc
) versus n was performed for a set of Hamiltonian parameters with fixed Δt and Δt3. It is important to mention that U does not affect the
shape of εMF, since it only modifies the electron self-energy
(EMF) and shifts the
superconducting chemical potential (μ) without changing the superconducting critical temperature. Therefore
U can be taken equal to zero. On the other hand, as shown
below, to obtain a solution for the superconducting gap equation [Eq. (12)], (V-4Δt3) should to be negative and therefore the condition V<4Δt3 must be satisfied. In order to keep a minimum set of parameters but
keeping the d-wave symmetry that arises from Δt3, V will be set to zero too. In this work, we determine
the optimal electron density (nop) and
the corresponding ground state energy for each value of the ratio between next- and
next-nearest-neighbor hoppings (t'/t). Since a supreme is the least
upper bound of a set of high bound values, we expect that the supreme of
Tc-max corresponds to that with
minimal energy at T=0 K. This scenario has been verified numerically for two
different sets of Hamiltonian parameters that can be applied to superconducting
systems.
2. The model
We consider a single-band Hubbard model in a square lattice with first- (Δt) and second-neighbor (Δt3) correlated hoppings, in addition to on site (U) and
first-neighbor (V) Coulombic repulsions. The corresponding
Hamiltonian (H^) is 6:
H^=Ht+Ht'+HU+HV+HΔt+HΔt3
(1)
with
Ht=t∑<i,j>,σciσ†cjσ
(2)
Ht' =t'∑≪i,j≫,σciσ†cjσ
(3)
HU=U∑ini↑ni↓
(4)
HV =V2∑<i,j>ninj
(5)
HΔt=Δt∑<i,j>,σciσ†cjσ(ni,-σ+nj,-σ)
(6)
HΔt3=Δt3∑ciσ†cjσnl
(7)
where ni=ni,↑+ni,↓, ni,σ=ci,σ†ci,σ, and ci,σ†(ci,σ), is the creation (annihilation) operator with spin σ=↓ or ↑ at site i. <i,j> and ≪i,j≫ denote nearest-neighbour and next-nearest neighbour sites, respectively.
The expressions for model parameters, in terms of the Wannier functions [φ(r-Ri)], centred at the lattice site
Ri , are given in the Table I.
Table I Expressions for the Hubbard model parameters.
| Single-particle parameters |
|
ti,j=∫d3rφ*r-Rj -h2∇22m+urφr-Rj;u(r) is the lattice periodic potencial |
|
t = t
i,j
with < i, j > |
|
t' = t
i, j
with << i, j >> |
| Electron-electron interaction parameters |
|
Uijkl=∫d3rd3r'φ*r-Rjφ*r'-Rjv(r-r')φ(r-Rk)φ(r'-Rl)
|
|
v (r-r') is the interaction potential between two electrons in the lattice |
|
U=Uiiii; ∆t=Uiiij with<i, j>; ∆t3=Uillj with<i, l>, <j, l>and≪i, j≫
|
After a Fourier transformation ck,σ†=1/Ns∑jexp(ik⋅Rj)cj,σ†, Eq. (1) becomes:
H^= ∑k,σε(k)ck,σ†ck,σ+1NS ∑k, k', q,σ Vk,k',qCk†+q,↑C†-k+q,↓C-k'+q,↓Ck'+q,↑
(8)
where ε(k) is the dispersion relation and
Ns is the total number of lattice
sites. The interaction potential (Vk,k',q)considers only Cooper pairs with antiparallel spins and it can be written
as:
Vk,k',q=U+Vβk-k'+∆tβk+q+β-k+q+βk'+q+β-k'+q+∆t3[γk+q,k'+q+γ-k+q,-k'+q]
(9)
with
β(k)=2[cos(kxa)+cos(kya)]
(10)
γ(k⋅k')=4cos(kxa)cos(k'ya)+4cos(kxa)cos(kya)
(11)
where a is the lattice parameter. The chemical potential (μ) and superconducting gap [Δ(k) ] can be obtained from the mean-field BCS coupled equations for d-wave superconductors7:
1=-V-4∆t3a24π2 ∬1Bz[cos(kxa-coskya]22Ek×tanhEk2kBTdkxdky
(12)
n-1=-a24π2∬1Bzεk-μEk×tanh Ek2kBTdkxdky
(13)
where 1BZ refers to the first Brillouin zone, defined as *20c-πa,πa⊗*20c-πa,πa the quasi-particle energy [E(k)] is given by:
E(k)=(εMF-μ)2+Δ2(k)
(14)
and the mean field dispersion relation is
εMFk=EMF+tMFcoskxa+coskya+4t'MF[coskxacoskya]
(15)
with
EMF=U2+4Vn
(16)
t'MF=t'+2nΔt3
(17)
tMF=t+nΔt
(18)
where n is the electron density.
The d-wave symmetry superconducting gap is given by (7):
Δ(k)=Δd[cos(kxa)-cos(kya)]
(19)
where Δd is the gap amplitude. The critical temperature can be determined from
Eq. (12) by considering that Δd(T=Tc)=0. On the other hand, the ground state energy
(Eg ) per site can be obtained
from the following equation (8):
Eg1Ns∑k[εMFk-E(k)]+∆d24∆t3-V+(n-1) μ-U4+2Vn2
(20)
3. Results
We fixed Δt3=0.05 eV as in Ref. 4, and then we
consider two cases: Δt=0.1 eV, which gives Tc-max-sup≈40 K; and Δt=0.5 eV which gives Tc-max-sup≈100 K. The first case can be applied to La2-x
Srx
CuO4 (LSCO)9,
while the second one to Bi2Sr2Ca
m-1
CumO4+2m+δ (BSCO), where m is the number of superconductors planes,
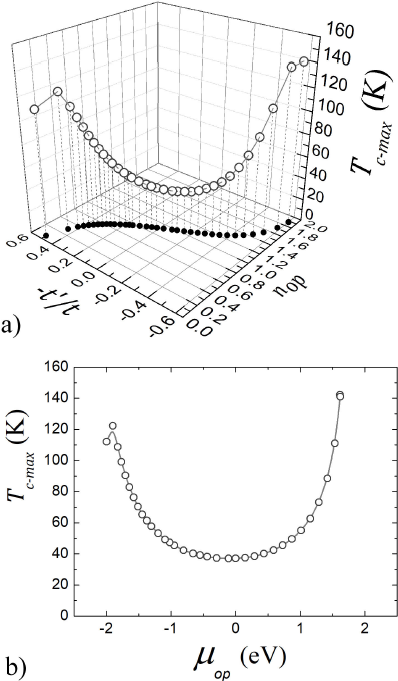
m = 2, 3 for Tc-max=85, 110 K, respectively10. Figure 1 (a) shows the
maximum critical temperature (Tc-max) versus the electronic density (n) and the ratio
-t'/t for Δt=0.1 eV. Around half filling, at nop-sup=0.975 and (-t')/t=-0.07, the supreme value of Tc is Tc-max-sup=37 K. Notice that for nop close to the band filling extremes, 0 and 2, a higher Tc-max is found. Likewise, Fig. 1 (b)
shows Tc-max versus the superconducting chemical potential (μop) at the optimal doping or optimal electronic density (nop) for the same parameters as in Fig. 1
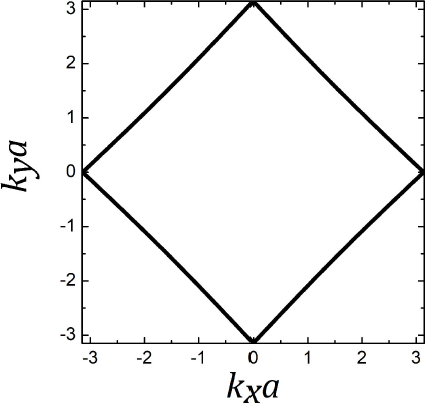
(a). Moreover, Fig. 2 shows the
Fermi surface (FS) for the model parameters leading to Tc-max-sup=37 K. Notice that the FS is electron-like and similar to the FS of a square
lattice with first-neighbor hopping only at half-filling.
The superconducting properties, such as the superconducting gap amplitude (Δd), the Fermi energy (EF),
i.e., the chemical potential at T = 0 K, and
the condensation energy (Econd), for electron densities
close to nop-sup =0.975, are summarized in Table II. Observe that E
cond attains a minimum value at nop-sup
=0.975. Figure 3 shows the ground state energy
versus both t'/t and the optimal electronic density
(nop). Notice the match of the minimum energy
Eg-min at nop-sup = 0975
for - t'/t = -0.07. The location of the minimum energy close to the
half filled band agrees with the experimental results reported in Ref. 11. Moreover, it is worth mentioning that
a ratio of t'/t = 0.1 has been estimated for the LSCO systems12 which is very close to the value
of 0.07 obtained at the optimal doping.
Table II Superconducting physical properties close to
Tc-max-sup
for Δt = 0.1 eV and
Δt3 = 0.05 eV.
| -t'=t |
n |
Tc (K) |
Eg (eV) |
∆d
(eV) |
Econd (eV) |
EF (eV) |
| -0.02 |
0.933750 |
37.37 |
-1.4567774678 |
0.0029534054 |
0.0000076362 |
-0.2935801622 |
| -0.07 |
0.975 |
37.00 |
-1.4612415658 |
0.0029192932 |
0.0000074563 |
-0.1101008940 |
| -0.10 |
1.0 |
37.13 |
-1.4590325950 |
0.0031720718 |
0.0000075504 |
0.0000008715 |
Figure 3 shows the ground state energy versus
both t'/t and the optimal electronic density
(nop). Notice the match of the minimum energy
Eg-min at nop-sup = 0975
for -t'/t = -0.07. The location of the minimum energy close to the
half filled band agrees with the experimental results reported in Ref. 11. Moreover, it is worth mentioning that a
ratio of t'/t = 0.1 has been estimated for the LSCO systems12 which is very close to the value
of 0.07 obtained at the optimal doping.
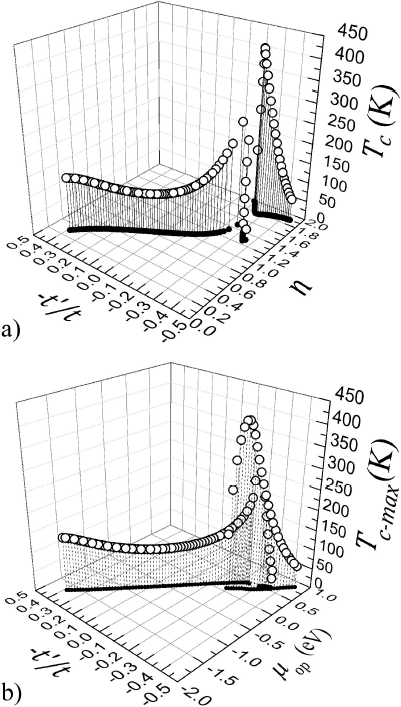
We also analyzed the case with Δt=0.5 eV which leads to a Tc-max-sup close to 100 K. Figure 4 (a) shows Tc versus t'/t and n. Notice that the minimum of Tc-max corresponds to -t'/t=0.06 and nop=0.805, hence Tc-max-sup=99.8 K. The projection on the plane nop-t'/t (solid circles) shows an inflection point for nop close to half filling. Figure 4 (b) depicts Tc-max versus both t'/t and the optimal chemical potential (μop) where an almost linear dependence of μop with respect to t'/t∈[0.4,-0.2] is observed. Moreover, for carrier densities close to full band filling, the band width is reduced to [-2.0,0.6] eV and the critical temperature is enhanced. Moreover, it has been verified that for -t'/t→-0.45, there is no Fermi surface. In order to understand this, we recall that the mean-field single-electron band width is proportional to the single-electron mean-field hopping parameters (tMF,t'MF) given by Eqs. (17) and (18). For certain values of electron density (n) and correlated hoppings (Δt,Δt3), the effective or mean-field hopping parameters are almost zero and also the corresponding effective band width. When this occurs, the superconducting chemical potential μop lies outside the single-electron band, and then there is no single-electron energy that satisfies εMF(k)=μop. For the parameters used in this work, this band-width shrinking occurs for -t'/t∈[-0.2,-0.45], where we also found that μop is the same for different t'/t ratios. This regime could be related to the pseudogap one, which is characterized by the disappearance of the Fermi surface and a suppression of the excited states above the superconducting critical temperature Tc and below a characteristic temperature T*, for a given interval of electron density11. The origin of this pseudogap phase is not yet understood and it could be due to the formation of another electronic phase competing with the superconducting one.
Figure 5 shows the FS for -t'/t=0.06, nop-sup=0.805, and Δt=0.5 eV. Notice that the FS is hole-like in contrast with that shown in Fig. 2, corresponding to -t'/t=0.06, nop-sup=0.975 and Δt=0.1 eV, which is electron-like.
In contrast with previous studies where the first-neighbor correlated hopping (Δt) only leads to s*-wave superconductivity13, in our case, d-wave superconductivity is driven by the second-neighbor correlated hopping (Δt3) and the value of t'/t strongly affects the superconducting properties. Moreover, the more appropriate t'/t ratio will be that which minimizes the ground state energy for a given set of other model parameters.
Figure 6 (a) shows the ground state energy (Eg) versus both t'/t and nop. Likewise, Fig. 6 (b) shows Eg versus n for -t'/t=0.06. Notice the linear dependence of Eg(n) satisfying the condition Eg-UD>Eg-OP>Eg-OD, where UD, OP and OD denotes underdoped, optimal doped and overdoped regimes, respectively. This inequality indicates that the underdoped regime is not the most stable, since its energy is higher than the optimal doped one. Moreover, if t'/t is fixed, the largest condensation energy (Econ), defined as the difference between the ground state energies Eg at T=Tc and T=0 K, is achieved at nop, in agreement with experimental results14. Figure 6 (c) shows Econ(n) for both cases, -t'/t=0.06 with Δt=0.5 eV (squares), and -t'/t=-0.07 with Δt=0.1 eV (circles).
In practice, as occurs in LSCO and BSCO systems, the electronic doping n can be modified by atomic substitution, which in turn changes the value of t'/t due to the variations in atomic sizes and the corresponding modification of the lattice parameter. It is important to mention that, for d-wave superconductors, U only shifts the mean-field self-energy, EMF (Eq. (16)) whereas a positive V could affect the superconducting state by diminishing the effect of Δt3. In fact, the latter interaction parameter is the more important one for d-wave superconductivity, although all of them are present in transition metals with narrow bands15.
On the other hand, the superconducting properties obtained for Δt=0.5 eV and Δt3=0.05 eV are summarized in Table III. Observe that the minimum energy, Eg-min=-0.89731704 eV, occurs at nop=0.790 with Tc-max=101.27 K, i.e., as one could expect, the maximum Tc is attained for the most stable superconducting system. It is important to mention that the chemical potential (μ) is a function of temperature, therefore, for a fixed set of model parameters, they are somewhat different at T=0 K and T=Tc. For this case, Δt=0.5 eV, which leads to a larger Tc, this difference is also larger and then there is a slight discrepancy between the location of Eg-min and Tc-max-sup=99.8 K.
Table III Superconducting physical properties close to
Tc-max-sup
for ∆t = 0.5 eV and
∆t3 = 0.05 eV.
| -t'/t
|
nop
|
Tc-max (K) |
Eg (eV) |
∆d
(eV) |
Econd (eV) |
EF
(eV) |
| 0.04 |
0.825 |
100.27 |
-0.8952952 |
0.00869208 |
0.000075024 |
-0.487767611 |
| 0.06 |
0.805 |
99.8 |
-0.8963881 |
0.00863401 |
0.000070351 |
-0.555325242 |
| 0.07 |
0.790 |
101.27 |
-0.8973170 |
0.00865858 |
0.000073722 |
-0.592148720 |
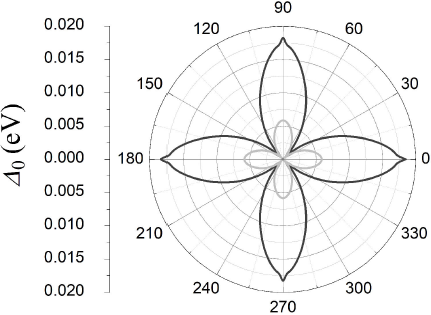
Figure 7 shows the single-excitation energy gap (Δ0), defined as the minimum value of E(k) along the φ=tan-1(ky/kx) direction, for the parameter values where the supreme value of Tc is reached with Δt=0.1 eV (light gray line) and Δt=0.5 eV (dark gray line). For the latter case, notice the sharp feature at the antinodal points 0∘, 90∘, etc., or at the corresponding points (π,0),(0,π), etc., of the first Brillouin zone which could be detected by ARPES technique16.
4. Discussion
A discussion has already been done along the paper, however, it is important to emphasize that it is possible to define a supreme value for the set of maximum critical temperatures which occurs at the minimum of the ground state energy. The results presented in this work give an alternative way to look for the appropriate set of Hamiltonian parameters to fit the experimental data by studying the supreme value of Tc-max as a function of t'/t. From this point of view, the mean field treatment can be considered as a first good approximation to describe the superconductivity for a great variety of superconductors reported in the literature.
5. Conclusions
In summary, we have studied the d-wave superconducting ground state as a function of the ratio t'/t within the generalized Hubbard model, where a second neighbor correlated-hopping term is included. Within the BCS formalism, the superconducting properties are calculated by solving two coupled integral equations (12) and (13), where the integrals involved can be efficiently calculated by isolating the region around the Fermi surface. The ground state energy (Eg) was obtained for all the optimal electron concentrations where Tc is maximum, for both Δt=0.1 eV and Δt=0.5 eV, with Δt3=0.05 eV. For the second case, the critical temperature is considerably enhanced and there is a doping regime where the single-electron band width is reduced and the superconducting chemical potential lies out of this band. In this case, the Fermi surface disappears, opening the question about the pseudogap regime experimentally found for superconductors with carrier concentrations close to half-filling. It is suggested that this pseudogap could be found for nop>nop-sup. It is worth mentioning that the difference of 0.4 eV between the two values of Δt studied, leads to a critical temperature enhancement of 60 K for d-wave superconductors, even if the d-wave superconductivity is originated from the Δt3 interaction. This effect is lower than that found for s*-wave superconductors, where only Δt is considered13. The results reported in this work suggest a possible semi-analytical approach to Eqs. (12) and (13), where the length and shape of the FS should be considered. Since the computing time needed to obtain nop-sup is large, it is necessary a complementary numerical method to fit the set of Hamiltonian parameters with a real superconductor system, and this will be the subject of future works. Finally, references4,5 consider other approaches to fit the model parameters from experimental results, but now it is also suggested to consider that superconductivity occurs at some optimal doping with maximum critical temperature and minimum ground state energy within the parameters space.
Acknowledgments
This work has been supported by UNAM-UNACAR exchange project and DGAPA-UNAM-PAPIIT IN10717. Computations were performed at Miztli of DGTIC-UNAM (Project LANCAD-UNAM-DGTIC-180).
REFERENCES
1. C.C. Tsuei and J.R. Kirtley, Rev. Mod. Phys. 72 (2000) 969.
[ Links ]
2. H.B. Schüttler and A.J. Fedro, Phys. Rev. B 45 (1992) 7588.
[ Links ]
3. I.I. Mazin and D.J. Singh, Phys. Rev. Lett. 79 (1997) 733.
[ Links ]
4. J.S. Millán, L.A. Pérez, C. Wang, Physica C 471 (2011) 735.
[ Links ]
5. C. Galván, L.A. Pérez, C. Wang, Phys. Lett. A 376 (2012) 1380.
[ Links ]
6. L.A. Pérez, J.S. Millán, C. Wang, Int. J. Mod. Phys. B 24 (2010) 5229.
[ Links ]
7. L.A. Pérez, C. Wang, Solid State Commun. 121 (2002) 669.
[ Links ]
8. J.S. Millán, L.A. Pérez, E. Shelomov, C. Wang, Physica C 460-462 (2007) 1051.
[ Links ]
9. T. Matsuzaki, N. Momono, M. Oda, M. Ido, J. Phys. Soc. Jpn. 73 (2004) 2232.
[ Links ]
10. J. Tarascon et al., Phys. Rev. B 38 (1988) 8885.
[ Links ]
11. Masatoshi Imada, Atsushi Fujimori, and Yoshinori Tokura, Rev. Mod. Phys. 70 (1998) 1039.
[ Links ]
12. E. Pavarini, I. Dasgupta, T. Saha-Dasgupta, O. Jepsen, O.K. Andersen, Phys. Rev. Lett. 87 (2001) 047003.
[ Links ]
13. J.E. Hirsch and F. Marsiglio, Phys. Rev. B 39 (1989) 11515.
[ Links ]
14. T. Matsuzaki, M. Ido, N. Momono, M. Oda, Physica C 217 (2003) 388-389.
[ Links ]
15. J. Hubbard, Proc. Roy. Soc. London A 276 (1963) 238.
[ Links ]
16. A. Damascelli, Z. Hussain, Z-X. Shen, Rev. Mod. Phys. 75 (2003) 473.
[ Links ]


 nova página do texto(beta)
 Inglês (pdf)
 Artigo em XML
 Referências do artigo
 Enviar este artigo por email
 Citado por SciELO
  Similares em
SciELO
Similares em
SciELO 
 Permalink