SciELO - Scientific Electronic Library Online

 
vol.64 número3Structural, electrical and magnetic properties of the pyrochlorate Er2−x Srx Ru2O7 (0 ≤ x ≤ 0.10) systemOptimal doping for d-wave superconducting ground states within the generalized Hubbard model índice de autoresíndice de materiabúsqueda de artículos
Home Pagelista alfabética de revistas  

Servicios Personalizados

Revista

Articulo

Indicadores

Links relacionados

  • No hay artículos similaresSimilares en SciELO

Compartir


Revista mexicana de física

versión impresa ISSN 0035-001X

Rev. mex. fis. vol.64 no.3 México may./jun. 2018


Research

Research in Condensed Matter

Preparation, characterization and temperature-dependent photoluminescence in Ca0.90Sr0.10RuO3 compound

A. Quiroza  b 

M. Abatala 

E. Chavirab 

V. Garcia-Vazquezc 

E. Marinerod 

M. Nishiokae 

a Facultad de Ingeniería, Universidad Autónoma del Carmen, Av. Central S/N Esq. Con Fracc. Mundo Maya, Ciudad del Carmen, Campeche, 24115 Mexico.

b Instituto de Investigaciones en Materiales, Universidad Nacional Autónoma de México, Apartado Postal 70-360 Ciudad de México, 04510 Mexico.

c Instituto de Física Luis Rivera Terrazas, Benemérita Universidad Autónoma de Puebla, Apartado Postal J-48, Puebla, Pue., 72570 Mexico.

d Purdue University, Hovde Hall, 610 Purdue Mall, West Lafayette, IN 47907-2040 USA.

e Hitachi San José Research Center, San José California 3403, Yerba Buena Road, 95135 USA.


ABSTRACT

We report the Ca0.90Sr0.10RuO3 compound synthesized by solid-state reaction method at ambient pressure using temperatures between 700 and 800 C in air. By X-ray powder diffraction (XRD), we determine a solid solution until Ca0.85Sr0.15RuO3 compound. Scanning electron microscopy (SEM) indicates than the particle size varies between 0.422 and 1.598 μm. The resistance measurement, as a function of temperature measurement from 10 to 300 K for Ca0.90Sr0.10RuO3 compound shows a metallic behavior. Finally, photoluminescence (PL) and its temperature dependence of Ca0.90Sr0.10RuO3 compound in the temperature range 6.7-296 K were measured. It was observed than the main broad band centered at ∼ 1.73 eV with the shoulders at ∼ 1.38 eV and ∼ 2.05 eV exists in the entire temperature range. It can be well fitted by three Gaussian curves B1, B2 and B3, centered at ∼ 1.38, ∼ 1.73 and ∼ 2.05 eV, respectively. The transitions identified as B1 and B2 are studied with temperature. The photoluminescence mechanics for Ca0.90Sr0.10RuO3 compound are presented based on the electronic structures formed by the interactions among spin, charge and lattice, in which B1 was identified with the charge transfer excitation of an electron from the lower Jahn-Teller split eg level of a Ru3+ ion to the eg level of an adjacent Ru4+ ion, B2 was assigned to the transition between the spin up and spin down eg bands separated by Hund’s coupling energy Ej , whereas B3 is attributed to the transition, determined by the crystal field energy Ec between a t2g core electron of Ru3+ to the spin up eg bands of Ru4+ by a dipole allowed charge transfer process.

Keywords: X-ray diffraction; ruthenates; photoluminescence; colossal magnetoresistance

PACS: 61.05.cp; 74.70.Pq; 78.55.-m; 75.47.Gk

1. Introduccion

Perovskite manganites compounds with mixed manganese valence, La1-x Ax MnO3 where A for a divalent metal, have attracted a great deal of attention due to anomalously large negative “colossal” magnetoresistance (CMR) for 0.2<x<0.5 1-3. Understanding the behavior of these Mn-based materials is a challenge for experimentalist and theorist. It is now accepted that both double exchange (DE) 4 and Jahn-Teller (J-T) lattice distortions 5 play an important role in the magnetic and transport properties of the manganites. Other effects such as magnetic polarons, electron localization and phase separation of carriers have been suggested as further subjects of research6,7. These effects show that spin, charge and lattice are strongly coupled in the CMR materials8. Although most of the attention has been focused on the effect of applied magnetic field and temperature on the conductivity, there is much to be learned from the properties (such as photoluminescence) determined by the electronic structure in La2/3Ca1/3MnO3 (LCMO)8 compound. Photoluminescence (PL) in solid materials is always resulting from radiative decay of electronic transitions. In semiconductors, the PL comes from band to band transition or excitonic states, while in insulators it results from impurities, as transition metal or rare earth ions. Some few cases that are not exactly explained by these two mechanisms have been reported, as porous silicon or nanometric particles6. In this paper, we present the first report on the PL features and their temperature dependence of Ca0.90Sr0.10RuO3 (CSRO) compound, which provides another case that cannot be explained by the mechanisms mentioned above. The results indicate than the unconventional features for the electronic structure and their variation with temperature, which arise from the extremely strong coupling among the conduction electrons, local spins and lattice.

2. Materials and Methods

The polycrystalline sample of the CSRO compound was synthesized by solid-state reaction method at ambient pressure. Starting materials were RuO2 anhydrous (99.9% STREM), SrCO3 (99.5% CERAC) and CaCO3 (99.99% BAKER). Prior to weighing, SrCO3 and CaCO3 were preheated during 10-20 minutes at 120°C in order to dehydrate them. Stoichiometric mixture of these starting materials was done in air during 15 minutes using an agate mortar, resulting homogenous slurry. The produced milled polycrystals were then annealed in air during two days at a temperature between 700 and 800°C in a Thermolyne 46100 furnace (±4°C) with the intention of decompose the carbonates. The resultant CSRO nano-crystals were compressed into pellets (13 mm diameter, 1.0-1.5 ± 0.05 mm thickness), by applying a pressure of 1/4 ton/cm2 for 15 minutes in vacuum. The resulting compacted specimens were then sintered in air at 800°C during four days. All reagents and final products were characterized by X-ray powder diffraction (XRD) with a Bruker-AXS D8-Advance diffractometer using CuK( radiation (λ=1.5406 Å) and a graphite monocromator. Diffraction patterns were collected at room temperature over a range 52θ70 with a step size of 0.017° and a time per step of 4 s. The change in morphology grain size in CSRO compound obtained by different heat treatments, was observed by scanning electron microscopy (SEM) on a JOEL JSM- 6610LV. The micrographs at 50.00 K.X, were taken with a voltage of 20 kV, current intensity of 1000 pA and WD = 10 mm. The Energy Dispersive X-Ray (EDX) was performed on the same equipment equipped with an Oxford/Link System electron probe microanalyzer (EPMA). Low temperature DC resistance measurements were performed using the standard four-probe method from room temperature down to 10 K. The magnetization was obtained on a MODEL-P525: PPMS vibrating sample magnetometer, Quantum Design, 16 T. To measure the zero field-cooled (ZFC) and the field-cooled (FC) magnetization, the samples were cooled down to 2 K at zero field and 100 Oe, respectively9. Finally, the PL spectra of the (Ca1-x Srx)RuO3 pellets were recorded by mounting them on a cold finger of a Displex system and keeping the temperature range 6.7-296 K. The spectra were analyzed thorough an automated, HORIBA JOBIN YVON IHR320 monochromator and CCD detector. The samples were excited using Ar+ laser with power of 0.73 mW and wavelength of λ=476.5.

3. Results and Discussion

Figure 1 shows the XRD patterns of the (Ca1-x Srx)RuO3 system with x = 0.07, 0.10, and 0.1510-12. From those spectra, compounds show a solubility up to x = 0.15. All samples crystallize in a single orthorhombic phase identified as CaRuO3 PDF (70-2790) and form a continuous solid solution. With respect to the examined diffractograms, it is worth to mention than the compound with x = 0.10 (Ca0.90Sr0.10RuO3) present reflections of a secondary phase identified as RuO213 and the lattice parameter a = 5.524 Å, b = 7.843 Åand c = 5.432 Å. The solid line corresponds to an orthorhombic phase and it is identified as CaRuO3 compound with PDF (70-2790). The phase marked with an asterisk (*) corresponds to the RuO2 compound, PDF (43-1027). The presence of this very small amount of RuO2 compound was detected in the (Ca1-x Srx)RuO3 0.07x0.15 system then indicated than occur an overload of the reagent in all the system. This is presumably a consequence of loss of volatile ruthenium oxide13. This solubility is a result of the anions, which contributed to the formation of the mechanism of the solid solution in this (Ca0.90Sr0.10RuO3) compound. The reason why we selected this (Ca0.90Sr0.10RuO3) compound is that it lies in the formation region of the solid solution.

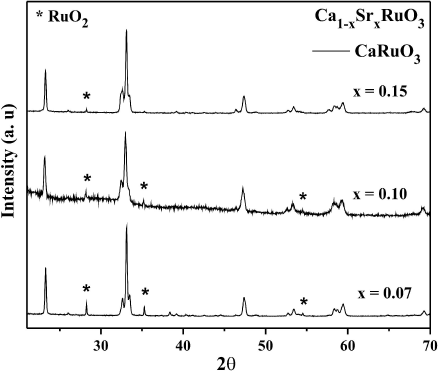
Figure 1 XRD patterns of (Ca1-x Srx)RuO3 system with x = 0.07, 0.10, and 0.15. The solid line corresponds to an orthorhom-bic phase and it is identified as CaRuO3 compound. The phase marked with an asterisk (*) corresponds to the RuO2 compound. 

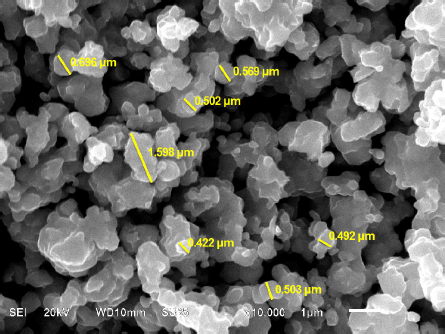
The next step was the characterization of the Ca0.90Sr0.10RuO3 compound achieved by SEM, to observe the morphology and grain sizes of the crystals. The micrograph shown in Fig. 2 was taken on the surface of the Ca0.90Sr0.10RuO3 compound with a magnification of the 50.00 K. X. Also, in some regions we observe semi-fusion than can be attributed to the ruthenium content. We can observe the secondary phase in the other gray color and the grain size varies between 0.592 and 1.598 µm. This coincide with the XRD data, than we obtain diverse components in the diffractograms, this generally happens, because SEM technique is more sensitive that XRD.

Figure 2 SEM Image of Ca0.90Sr0.10RuO3 showing a particle size varies between 0.422 and 1.598 µm. 

The electrical resistance as a function of temperature is present in Fig. 3. The Ca0.90Sr0.10RuO3 compound show a metallic behavior and short-range ferromagnetic interactions appear. This indicates that the ferromagnetism has been suppressed through the process of substitution of Sr2+ ions by Ca2+ ions10-14. For the compounds with large Ca2+ ions doping (x0.7), no clear phase transition is discerned, and only some irreversibility is observed in the magnetization curves of these materials. The disappearance of the long-range magnetic order is commonly related to the distortion of the RuO6 octahedra associated with the partial or total replacement of Sr2+ ions by Ca2+ ions, and the corresponding narrowing of the 4d bandwidth15.

Figure 3 Electrical resistance as a function of temperature for the Ca0.90Sr0.10RuO3 compound. 

Figure 4 shows the PL spectra for the (Ca1-x Srx) RuO3 system with x = 0.0, 0.07, 0.10, 0.15 and 1.0 measured at room temperature. In the measurements performed at low temperature on the (Ca1-x Srx)RuO3 system with x = 0.0, 0.07, 0.10, 0.15 and 1.0, it was observed a change in the intensity peaks due to temperature effects, although there exists small changes in the peaks position due to effects of the Sr2+ ions incorporation. The most notable observation in than the signal of PL is very intense when we have only CaRuO3, but the gradual increase of the signal is due to Sr2+ ions incorporation in the system, than indicates larger density of states near Fermi level EF and smaller lattice distortion14. Therefore, the intensity is related to the peaks of the 4d band than should be even narrower in CaRuO3 compound than in SrRuO3 compound because a Ca-O bond has a more covalent character than a Sr-O bond. This argument is consistent with the photoemission studies, which reveal that the free-electron component in CaRuO3 compound is weaker than in SrRuO3 compound and hence the 4d band is narrower in CaRuO3 compound15-16. Such changes in interactions are observed through this change of chemical composition. Due to the other compounds of the (Ca1-x Srx)RuO30.07x0.15 system do not show any change in the intensity of the PL spectrum in the temperature range 297 to 6.7 K. The main interest to study the photoluminescence (Ca0.90Sr0.10RuO3) compound is due to than the PL spectrum presents a gradual increase in intensity in the temperature range 297-6.7 K under the same experimental conditions.

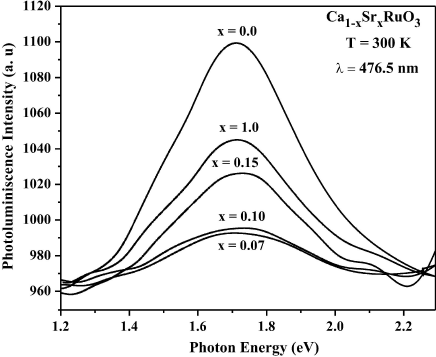
Figure 4 PL spectral on (Ca1-x Srx) RuO3 system with x = 0.0, 0.07, 0.10, 0.15 and 1.0 measured at room temperature. 

In the Fig. 5 displays the PL spectra (1.3-2.5 eV) of the Ca0.90Sr0.10RuO3 compound in the range 6.7-296 K, for which an excitation laser wavelength of the 476.5 nm was used. The main peak at ∼1.73 eV, along with the shoulders at ∼1.38 eV and ∼2.05 eV, respectively, is observed through the whole temperature range. As to the PL bands with the photon energies of 2.2 and 2.5 eV in our studied CSRO compound, W.L. Zhu et al suggest that they do not originate from the oxygen vacancies or other defect states, which should be sample-dependent19. T. Ding et al suggest that the PL bands around 2.2 and 2.5 eV arise perhaps from the interband transition between the O 2p and Ru 4d bands20.

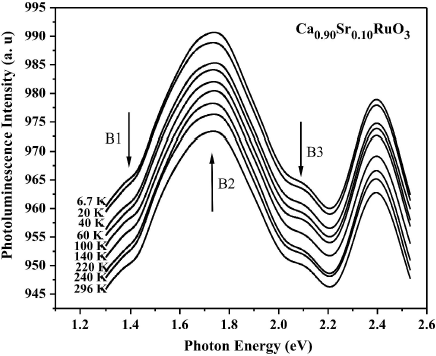
Figure 5 PL spectra of Ca0.90Sr0.10RuO3 compound at different temperatures from 6.7 to 296 K. Labels indicate the position of the peaks for the fitting. Excitation: λ = 476:5 nm. 

In the following, we only concentrate on the temperature dependence of PL spectra in the photo-energy range 1.3-2.2 eV, ascribed to the Ru 4d band21. We use the multi-peaked Gaussian fitting to the mixed band (PL); the results are perfectly adjusted and determine the position of each peak, which is 1.38 eV for B1 , 1.73 eV for B2 , and 2.05 eV for B3 (Fig. 6), respectively, which represent three different types of electronic transitions.

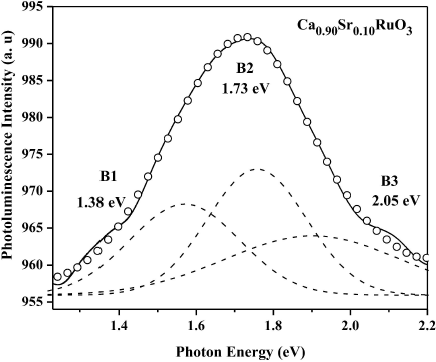
Figure 6 Experimental (open circles) and fitted (solid line) data of PL spectrum at 40 K. The best fit is given by three Gaussian curves B1 , B2 and B3 (dashed lines) centered at 1.38, 1.73, and 2.05 eV, respectively. 

The temperature dependence of the intensity for each peak is clearly shown in Fig. 7. In the entire temperature range 6.7-296 K, the intensity of B1 and B2 increased with decreasing temperature. However, the intensity of B3 is almost temperature-independent. In order to reveal the mechanisms of PL CSRO, its related electronic structure should be understood.

Figure 7 The temperature dependence of the PL intensities for each peak B1 , B2 and B3

Figure 8 shows the electronic structure of the Ru3+ and Ru4+ ions and the possible optical transitions. The upper panel shows the energy of Ru eg and t2g levels around the ferromagnetic transition region for adjacent Ru3+ and Ru4+ ions. The spin up eg levels in the Ru3+ ions are split by ETJ due to the J-T effect. Transition A is the dipole active photoionization of the J-T small polaron. The lower panel shows the energy levels in the metallic ferromagnetic state at low temperatures. The spin up and spin down eg bands are separated by ETJ. The aligned core spins in the t2g levels lie below the spin up eg levels by the crystal field energy ECF. Process B promotes a t2g core electron of Ru3+ to the spin up eg bands Ru4+ by a dipole allowed charge transfer process. The transition between the spin up eg bands and spin down eg bands depicted by C is allowed only transition involves electrons from the spin up eg level of Ru3+ to the spin down t2g level of Ru4+ with spin flip process.

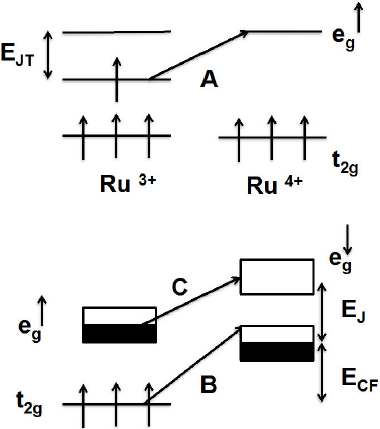
Figure 8 Schematic electronic structure of the eg and t2g levels of Ru3+ and Ru4+ ions and the optical transitions relevant to the PL peaks. From Ref. 8

The existence of these three transition processes was supported by the temperature dependence. At lower temperatures, the spins are all aligned, so the effect of the intensity is expected to be maximum, whereas at higher temperatures, where the spins aligned randomly, and the effect of the intensity to be spin system is reduced. The growing intensity reflects the enhanced metallic character in Ca0.90Sr0.10RuO3 compound and helps to explain the observed ferromagnetism 10.

4. Conclusion

In conclusion, the visible PL of Ca0.90Sr0.10RuO3 compound in the range temperature 6.7-296 K was measured, and its temperature dependence was also presented. The intensities of the peak B 1 and B 2 varied with temperature. The Ca0.90Sr0.10RuO3 compound show a metallic behavior and short-range ferromagnetic interactions appear. The disappearance of the long-range magnetic order is commonly related to the distortion of the RuO6 octahedra associated with the partial or total replacement of Sr2+ ions by Ca2+ ions, and the corresponding narrowing of the 4d bandwidth.

Acknowledgments

This work was partially supported by CONACYT-80380, 10010-2015-03 No. 265614 and UNAM-IN109308.

REFERENCES

1. S. Jin, T.H. Tiefel, M. McCormack, R.A Fastnacht, R. Ramesh, and L.H. Chen, Science 264 (1994) 413. [ Links ]

2. P. Schiffer, A.P. Ramirez, W. Bao, and S.W. Cheong, Phys. Rev. Lett. 75 (1995) 3336. [ Links ]

3. Y. Murakami, J.H. Yoo, D. Shindo, T. Aton, and M. Kikuchi, Nature 423 (2003) 965. [ Links ]

4. C. Zener, Phys. Rev. 81 (1951) 440. [ Links ]

5. A.J. Millis, P.B. Littlewood, and B.I. Shraiman, Phys. Rev. Lett. 74 (1995) 5144. [ Links ]

6. P.S. Pizani et al., Appl. Phys. Lett. 81 (2002) 253. [ Links ]

7. Y. Okimoto et al., Phys. Rev. Lett. 75 (1995) 109. [ Links ]

8. Y. G. Zhao et al., Phys. Rev. Lett. 81 (1998) 1310. [ Links ]

9. http://www.qdusa.comLinks ]

10. A. Quiroz et al., Materials Science and Applications 6 (2015) 16. [ Links ]

11. N. Keawprak, R. Tu, and T. Goto, J. Alloys. Comp. 523 (2012) 182. [ Links ]

12. R.S. Singh and K. Maiti, Phys. Rev. B. 76 (2007) 085102. [ Links ]

13. T. Takeda et al., J. Solid State Chem. 140 (1998) 182-193. [ Links ]

14. R.D. Shannon, Acta Cryst. A 32 (1976) 751. [ Links ]

15. G. Cao, S. McCall, M. Shepard, J.E. Crow, and R.P. Guertin, Phy. Rev. B. 56 (1997) 321-329. [ Links ]

16. B.N. Lin, C.Y. Lin, Y.S. Wu, and H.C. Ku, J. of Magn. Magn Mater. 272 (2004) 479. [ Links ]

17. A. Gulino, R.G. Egdell, P.D. Battle and H. Kim, Phys. Rev. B. 51 (1995) 6827. [ Links ]

18. P.A. Cox, R.G. Egdell, J.B. Goodenough, A. Hamnett, and C.C. Naish, J. Phys. C. 16 (1983) 6221. [ Links ]

19. W.L. Zhu et al., Mater. Res. Bull. 44 (2009) 1867-1870. [ Links ]

20. T. Ding et al., Solid State Commun. 132 (2004) 815. [ Links ]

21. J. Manica, M. Abbate, J.A. Guevara, and S.L. Cuffin, Physica B 354 (2004) 39. [ Links ]

Received: September 11, 2017; Accepted: February 14, 2018

Creative Commons License This is an open-access article distributed under the terms of the Creative Commons Attribution License