


 nueva página del texto (beta)
 Inglés (pdf)
 Artículo en XML
 Referencias del artículo
 Enviar artículo por email
 Citado por SciELO
  Similares en
SciELO
Similares en
SciELO 
 Permalink
1. Introduction
The thermal effusivity is of importance since it gives information of how heat is exchanged with the surrounding media, i.e. thermal dissipation capabilities of materials. Thermal effusivity could be of interest, to study how biomaterials dissipate thermal energy to its surroundings and how this thermal property may change due to pathological diseases. In particular, thermal effusivity has been measured by means of thermopiles, thermistors, resistors or hotwire probes 1-3, being these the typical methods used. In this type of sensors they usually rise the temperature of the sample more than 20°C (35), hence altering or in the worst case completely destroying them. In addition, these approaches have the inconvenience for their use in corrosive environments or special care must be paid to isolate the probes since these techniques require being in contact with the sample. Some optical techniques offer the advantage of being non-invasive since the probing beam is not in contact with the sample to be characterized 6. Particularly, the laser beam deflection technique has been used to determine thermal properties of solids and liquids 7, as well as for spectroscopic refractometry 7-9 where the heating beam directly irradiate the samples and the probing beam propagate in free space thus making this technique prone to external noise 10,11, these techniques tend to be complex to integrate.
In a previous work, we proposed a sensor based on the beam deflection technique integrated in a solid slab to differentiate heat conduction in liquids using a deflection angle sensor with good resolution and stability 12. In this previous work, the heating beam is replaced by an opaque film in the slab heated by a non-coherent light source, thus avoiding direct laser irradiation for the sample. More recently, we proposed a numerical study of the laser beam deflection technique integrated in a slab, to characterize thermal properties of biological tissue 13.
We also determined the diffusivity of liquid samples for glycerol in tridistilled-water dissolutions for concentrations variating from 0.8 wt. % to 1.2 wt. % 14. Using an oblique incidence of the heat source, we determined the angle of the most pronounced change in heat conduction thus finding the critical angle of the incident thermal wave. This method did not depended on photometric measurements and was used to obtain the thermal diffusivity of dissolutions of glycerin in tridistilled-water with good agreement with reported values. Nevertheless, it had the disadvantage of requiring several measurements by sample to obtain a thermal property.
In this work, we propose an extension of our latest proposals to determine the thermal effusivity of liquid samples at a fixed incident angle thus simplifying the device complexity and reducing the number of measurements needed to only one by sample. We also reduced the measurement time and increase the temperature to no more than 3°C thus; reducing the stress we induce in the samples avoiding their damage.
2. Basis
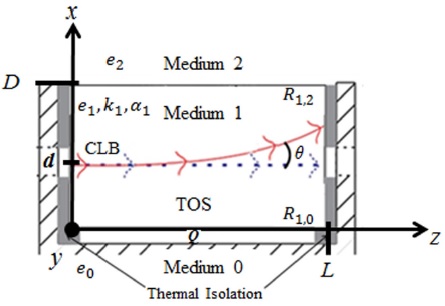
Let us consider a finite thermo-optic slab (i.e. medium 1) of known thermal properties; thermal effusivity e1, thermal conductivity k1, and thermal diffusivity α1 with its lateral faces thermally isolated, and that the lower and the upper media, medium 0 and medium 2 respectively, are considered as semi-infinite.
Now, if we apply a heat step Q for 300s at the interface 1 (between medium 0 and the thermo-optic slab) there is an induced temperature distribution Tx in the thermo-optic slab (TOS). Since we consider the walls perpendicular to the wall where Q is applied to be thermally isolated and the media 0 and 2 to be semi-infinite, we can assume that the heat flows only in the x-direction. We can also assume that there is a heat wave reflection on each interface due to the difference of effusivity of media 0 (e0) and effusivity of media 2 (e2), so the temperature distribution Tx depends on the contribution of the heat waves travelling in the positive x-direction and backwards in the opposite x-direction. This temperature distribution produces a gradual change of the refractive index n of the TOS that depends on the temperature at each point 12.
Finally, we consider a collimated laser beam (CLB) of wavelength λ = 1550 nm that propagates along the zdirection at a distance d from the interface 1. The change in the refractive index n along the optical path, induced by the application of the heat source Q, would produce an angular deflection Î, of the CLB to the coldest region of the slab. A schematic of the physical considerations is shown in Fig. 1.
Under these assumptions, it is possible to estimate the temperature distribution in the TOS using the onedimensional Fourier’s law of heat conduction. The solution to the resulting equation for a thermal conduction problem with these characteristics was given by Sandoval et al12, where the resulting temperature distribution with respect to x (Tx) due to a heat step can be obtained from:
where R1,0 and R1,2 are the thermal reflection coefficients for the thermal waves that depend on the thermal effusivity of the surrounding media and can be expressed like:
and
The generated thermal waves interact nw times at the interface 1 and the interface 2 (between medium 1 and medium 2).
The sensibility of the sensor depends in part to the thermal and optical properties of the TOS. Then, it is of importance to choose a material that has good optical transparency to reduce optical power loss due to absorption, and that has a high thermo-optical coefficient (∂n/∂T) because for higher values of ∂n/∂T we need lower temperatures to achieve a sufficient Tx. On the other hand, the operational range depends on the thermal effusivity of the TOS due to the thermal reflection coefficients (R1,0 and R1,2). This is why for this study we use a commercial acrylic TOS since it has an adequate transmittance of τacrylic = 50% for the near infrared interval, a ∂n/∂T of −1.05 × 10⁻⁴ [K−1] that is at least two orders of magnitude higher than those of the commercial optical glasses, and has a thermal effusivity of 150 [W s0.5 m−2 K−1], which allows to measure samples that has higher values of effusivity due to the restriction of R1,0 and R1,2.
To obtain a theoretical thermal distribution Tx, we evaluate Eq. 1 considering; a heat pulse of Q = 194 [W/cm2], an acrylic TOS of dimensions: L = 0.03 m, D = 0.01 m, and the thermal properties shown in Table I:
Table I Thermal properties considered to obtain a theoretical T x .
| Thermal | Thermal | Thermal | |
| effusivity | conductivity | diffusivity | |
| [W s0.5 m-2 K-1] | (W/mK) | [m2/s] | |
| Medium 0 (air) | e0 = 5.5 | - | - |
| Medium 1 (acrylic) | e1 = 150 | k1 = 0.158 | α1 = 1.28 × 10⁻⁷ |
We evaluated Eq. 1 for several values of thermal effusivity of Medium 2 (thermal effusivity of the sample) of known liquids. The effusivities used are shown in Table II.
Table II Thermal effusivity values used to evaluate Eq. 1 for several liquid samples.
| Medium 2 | Thermal effusivity [W s0.5 m-2 K-1] |
|---|---|
| e2-ethanol* | 634.9 |
| e2-glycerol* | 938.16 |
| e2-blood** | 1395 |
| e2-bile** | 1549.6 |
| e2-tri-water* | 1250 |
*Obtained from M.N. Pop15, and
**from L. Mcintosh et al 16
The results of evaluating Eq. 1 with the values mentioned above are shown in Fig. 2, where we plotted the Tx as a function of time.
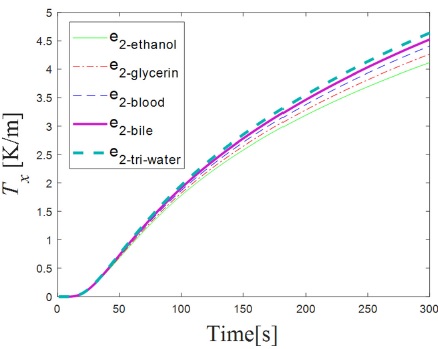
Figure 2 Theoretical temperature distribution Tx as function of time for values of thermal effusivity e2 of known liquids.
In Fig. 2 we show the generated Tx with respect of time as it increases due to the heat pulse. The Tx further increases for higher values of e2−sample, because there is a higher heat exchange between medium 1 and medium 2. Note that the Tx for each sample can be distinguished from time 140 s to 300 s, where the characteristic response for each sample is markedly different, therefore, this is the period of time where the thermal effusivity of the samples can be obtained.
The deflection angle θ of the CLB in an acrylic TOS, produced by the change in the refractive index due to a thermal distribution, can be approximated according to the equation:
where ∂n/∂T is the thermo-optical coefficient of the acrylic 17 (−1.05 × 10⁻⁴ [K−1]), n is its refractive index (1.49), L is the length of the TOS (0.03 m), and Tx is determined from Eq. 1. We obtained the deflection angle of the CLB in the TOS produced by the application of a heat pulse of a Q = 194 [W/cm2] for 300 s for the same values of e2 mentioned in Table II. Figure 3 shows the deflection angle obtained as function of the thermal effusivity at the time t = 300 s.
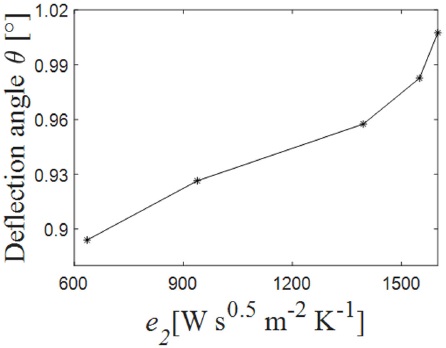
Figure 3 Deflection angle as function of the thermal effusivity at afixedheight of the TOS d=6.5×10⁻³ m.
As we can see from Fig. 3, it is possible to obtain a particular deflection angle for liquids within a range of effusivity between 600 [W s0.5 m−2 K−1] and 1500 [W s0.5 m−2 K−1] applying a small amount of energy and for a short period of time.
2.1. Theoretical sensor response
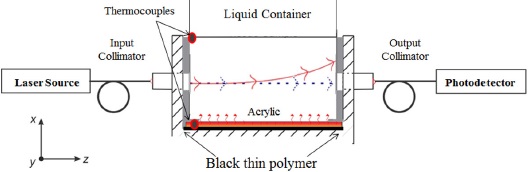
To obtain the effusivity of liquid samples, we estimate the change of optical power due to the decoupling of the CLB, using an angle deflection sensor (ADS). The ADS is formed by input and output collimators connected to a laser source and a photodetector, respectively. The TOS is between the input and output aperture of the ADS as shown in Fig. 4A. As we explained early, the decoupling of the CLB at the output collimator is caused by the beam deflection due to the induced thermal distribution Tx when a heat source Q is applied. The change of optical power can be approximated with the integration of the deflecting CLB in the area of the output fiber core with respect to the time. Initially, we assume that the Gaussian CLB propagates along the optical axis of the device (z-direction) when there is no Q applied, and maximum power is detected. Then, when the Q is applied, there is a beam deflection according to Eq. 2, that depends on the thermal properties of the TOS and the thermal effusivity of the sample (e2), namely the unknown variable.
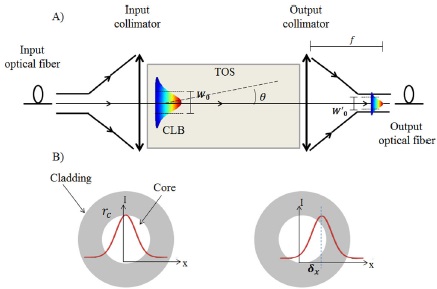
Figure 4 Schematic of A) the angle deflection sensor (ADS) and B) the beam displacement (δx) in the fiber optic entrance due to the angular deflection in the TOS.
To estimate the power change due to the deflection angle, we estimate the deflection of the CLB of intensity I that is projected into a SMF-28 optical fiber core of diameter ϕcore = 8.2 μm. The projection of the angular deflection in the core is transduced to a lateral displacement (δx) in the x-direction of the propagated beam. A schematic of the sensor transduction is shown in Fig. 4B.
The diameter of the projected spot can be estimated with the equation: φspot = 4λf/πϕcol where f is the focal length of the output collimator, and ϕcol is the diameter of the collimated beam incident on the output lens and λ is the wavelength of the laser source. Then, the waist radius projected in the core entrance of the optical fiber (W'0) can be calculated by: W'0= λf/πw0, where w0 is the original waist of the CLB. The lateral displacement δx is then calculated straightforward as: δx = f · tan(θ), where θ is obtained from Eq. 2.
Ultimately, to estimate the power change due to the lateral beam displacement, we calculate the overlapping of the fundamental propagation mode incident in the core entrance of the fibre optic using:
where
where I is the laser beam intensity of 1.1 mW, and the erf function is equivalent to
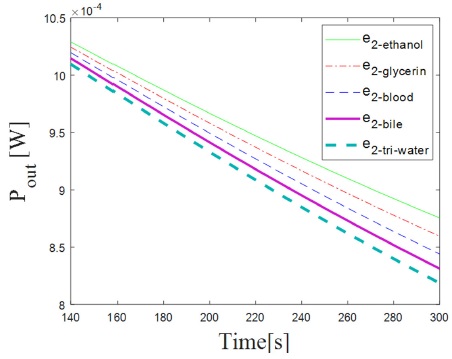
We can see from Fig. 5 that for higher values of e2−sample we measure a lower Pout, like in the case of tridistilled-water, due to a decrease in the reflection coefficient R1,2, and in consequence there is an increase of the thermal energy transfer from medium 1 to medium 2.
As said in the section before, it is possible to distinguish the curves for the different values of thermal effusivity for the periods of time between 140 s and 300 s of heating; therefore it is the period of time where the experimental values of effusivity are obtained.
3. Experimental setup
To measure the angular deflection, we use a fiber optic ADS (Fig. 6) formed by a Thorlabs laser source at 1550 nm connected to a single mode optical fiber mounted in a factoryaligned Thorlabs U-bench model FBC-1550-FC with a transmittance τbench = 90%. The TOS is a 0.03 × 0.01 × 0.01 m acrylic slab placed at the U-bench aligned to the optical axis. For the TOS alignment, we used a three-axis micrometric mounting. The output power is measured with a Thorlabs P001188 photodetector. We used a thin black polymer layer at the bottom of the TOS illuminated by a halogen lamp as a heat source due to the absorption of photons by the photothermic effect. At the opposite side of the heat source we build an acrylic liquid container of dimensions 0.03 × 0.01 × 0.05 m.
This is a simplified version of the previous work where we had additional to the ADS a mobile heat source to find the critic angle. In this case we do not have to sweep a range of angles thus reducing the number of measurements.
Also, for each experiment the sensor and samples are thermalized to an initial temperature of 25° C assuring that each measurement starts at the same temperature. Then we apply a heat source of Q = 194 [W/cm2] monitoring the sensor output for 300 seconds, compared to previous measurements where we monitored the sensor for at least 1200 seconds. To approximate the experimental condition of medium 2 to be considered as semi-infinite, we used samples of 1.5 g for filling the liquid container, which it is 5 times taller than the TOS. We also monitored the temperature at the two interfaces of the TOS with the heat source and the sample during the entire experiment using two thermocouples. As a calibration method, we characterized the sensor response to tridistilled water and glycerol.
4. Experimental results
To validate the proposed experimental method and as means of calibration, we corroborated the sensor response using the procedure described in the past section. The sensor response measured as the output power for 3 consecutive measurements of glycerol and tridistilled-water is shown in Fig. 7. The output power is normalized to the maximum power registered when there is no heat applied.
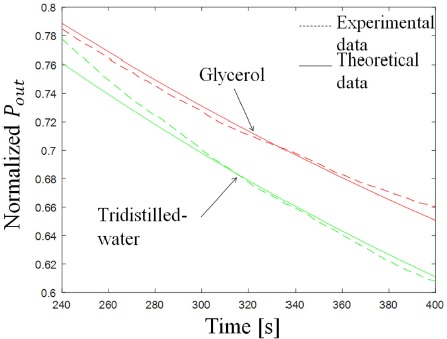
Figure 7 Sensor response to tridistilled-water and glycerol liquid samples. Dashed lines represent experimental values and solid lines represent theoretical values.
Using the theoretical model, we fitted the effusivity values of each sample, shown in dashed lines in Fig. 8, thus obtaining a thermal effusivity of
for tridistilled water and
for glycerol. These values compared with those previously reported have a relative error of 4.7% and 3.8%, respectively.
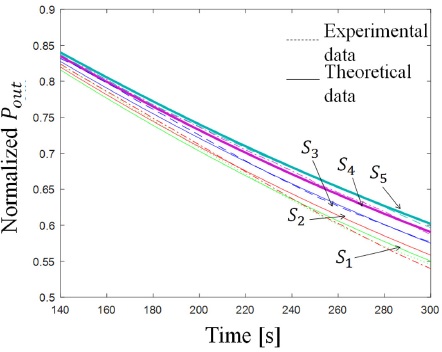
Figure 8 Sensor response for 5 different samples of NaCltridistilled water dissolutions (refer to Table I) with its best theoretical approximation. Dashed lines represent experimental values and solid lines theoretical values.
Then, we characterized the response of the sensor for five different dissolutions of NaCl in tridistilled-water. The concentrations vary from 0 wt.% to 25 wt.% (see Table II). The curves in Fig. 8 show how the normalized power with respect to time as the response of the sensor to this samples.
We can see in Fig. 8 that effusivity of the sample e2−S decreases as the concentration of NaCl increases, thus transferring less thermal energy between the TOS and the sample and producing a less changing thermal distribution.
The retrieved values of thermal effusivity and its uncertainty for the samples are summarized in Table III. For comparison purposes, we present the values reported in a previous work for NaCl-tridistilled water dissolutions for the NaCl concentrations of 0% wt., 10 wt.% and 20 wt.%.
Table III Description of the samples used in the experimental setup and the thermal effusivity values estimated in this work as well as the ones found in literature.
For completeness purpose we also compared the obtained thermal effusivity values with the
thermal effusivity estimated from the series mixing model for a binary mixture 18. Considering the effective
thermal conductivity to be: Keff =
vKNaCl + (1 −
v)Ktri−water,
where v is the volume of NaCl in tridistilled water,
KNaCl is the thermal conductivity of NaCl and
Ktri−water is the thermal
conductivity of tridistilled water. Then the heat capacity per unit volume for the
binary mixture is: ρCeff = (1 −
v)(ρCtri−water) +
v(ρCNaCl), where
ρCtri−water is the density times
the heat capacity of the tridistilled-water and
ρCNaCl is the density times the
heat capacity of the NaCl. Finally, to obtain the effective effusivity of the binary
mixture we have that:
If we consider Ktri−water = 0.59 [W/K m], KNaCl = 0.44 [W/K m], ρtri−water = 997 [Kg/m3], ρNaCl = 2165 [Kg/m3], Ctri−water = 4180 [J/K Kg], and CNaCl = 880 [J/K Kg], we obtain a maximum relative error of 8.5%, compared to the measured effusivity values.
The values obtained using this optical device show good agreement with those of the literature with a maximum error of 7.3%, as well as the binary mixture solution, validating this technique to obtain the thermal effusivity of liquid samples. The proposed optical device to obtain the thermal effusivity of liquid samples is suitable to characterize thermal effusivity of dissolutions with concentrations which vary in at least 5% of the solute. The photo-thermal device response could be improved by increasing the heat applied that also can diminish the response time, however, special attention should be paid to some samples that could be altered.
5. Conclusions
A simplified photo-thermal device to estimate the thermal effusivity of liquids has been proposed and validated for water and glycerol. The configuration used allows us to obtain the thermal effusivity o liquids reducing the number of measurements. We also demonstrated the use of the proposed technique to characterize thermal effusivity of homogeneous dissolutions of NaCl in tridistilled-water with a maximum relative error of 7.3%. The proposed device has the advantage of inducing minimal alteration to samples, since we indirectly heat each sample; we also reduced the experiment time in which we obtain the thermal properties thus reducing the time in which the samples are submitted to heating. Moreover, the pumping beam conventionally used for heating in the optical beam deflection technique is replaced by a non-coherent light source, thus, the effect of the local heating is highly diminished.

